Analyzing the Future of International Tourism in New South Wales

Verified

Added on  2023/06/11

|19
|3251
|345
Report
AI Summary
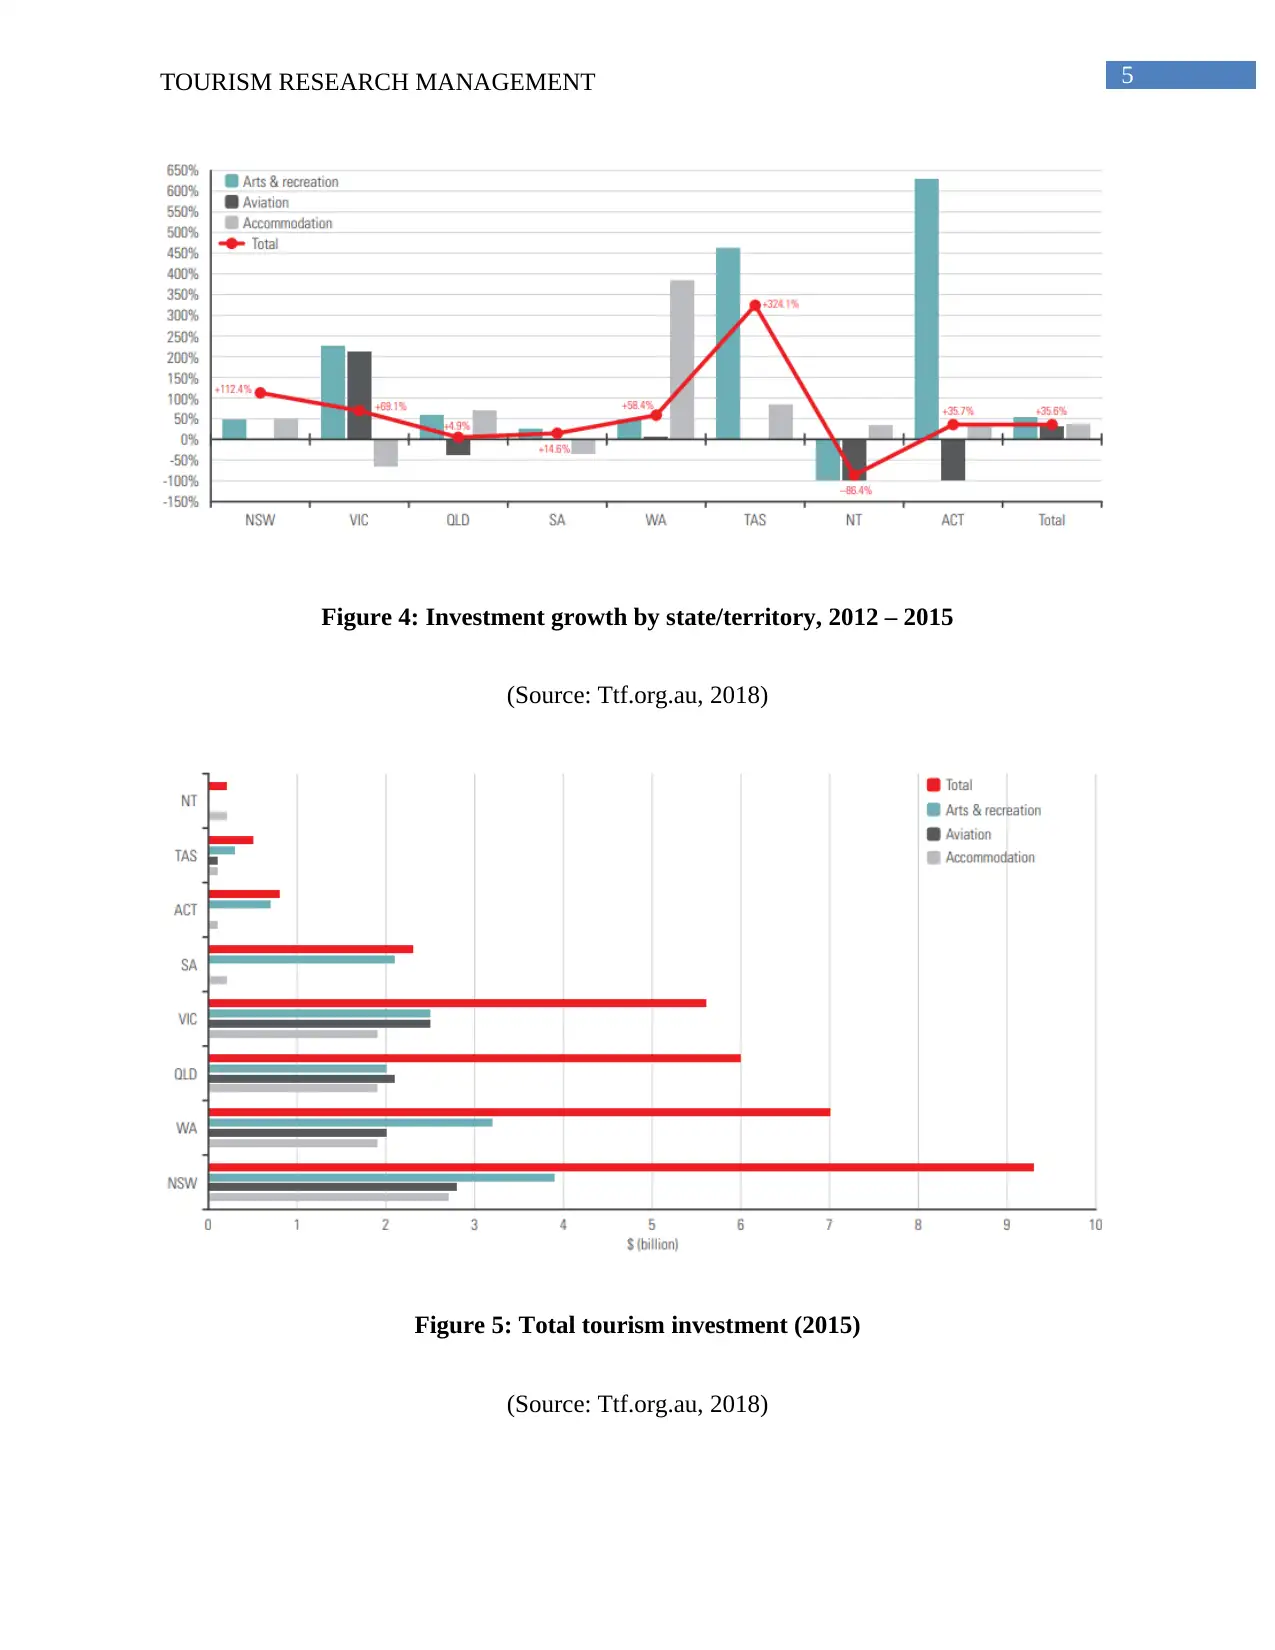
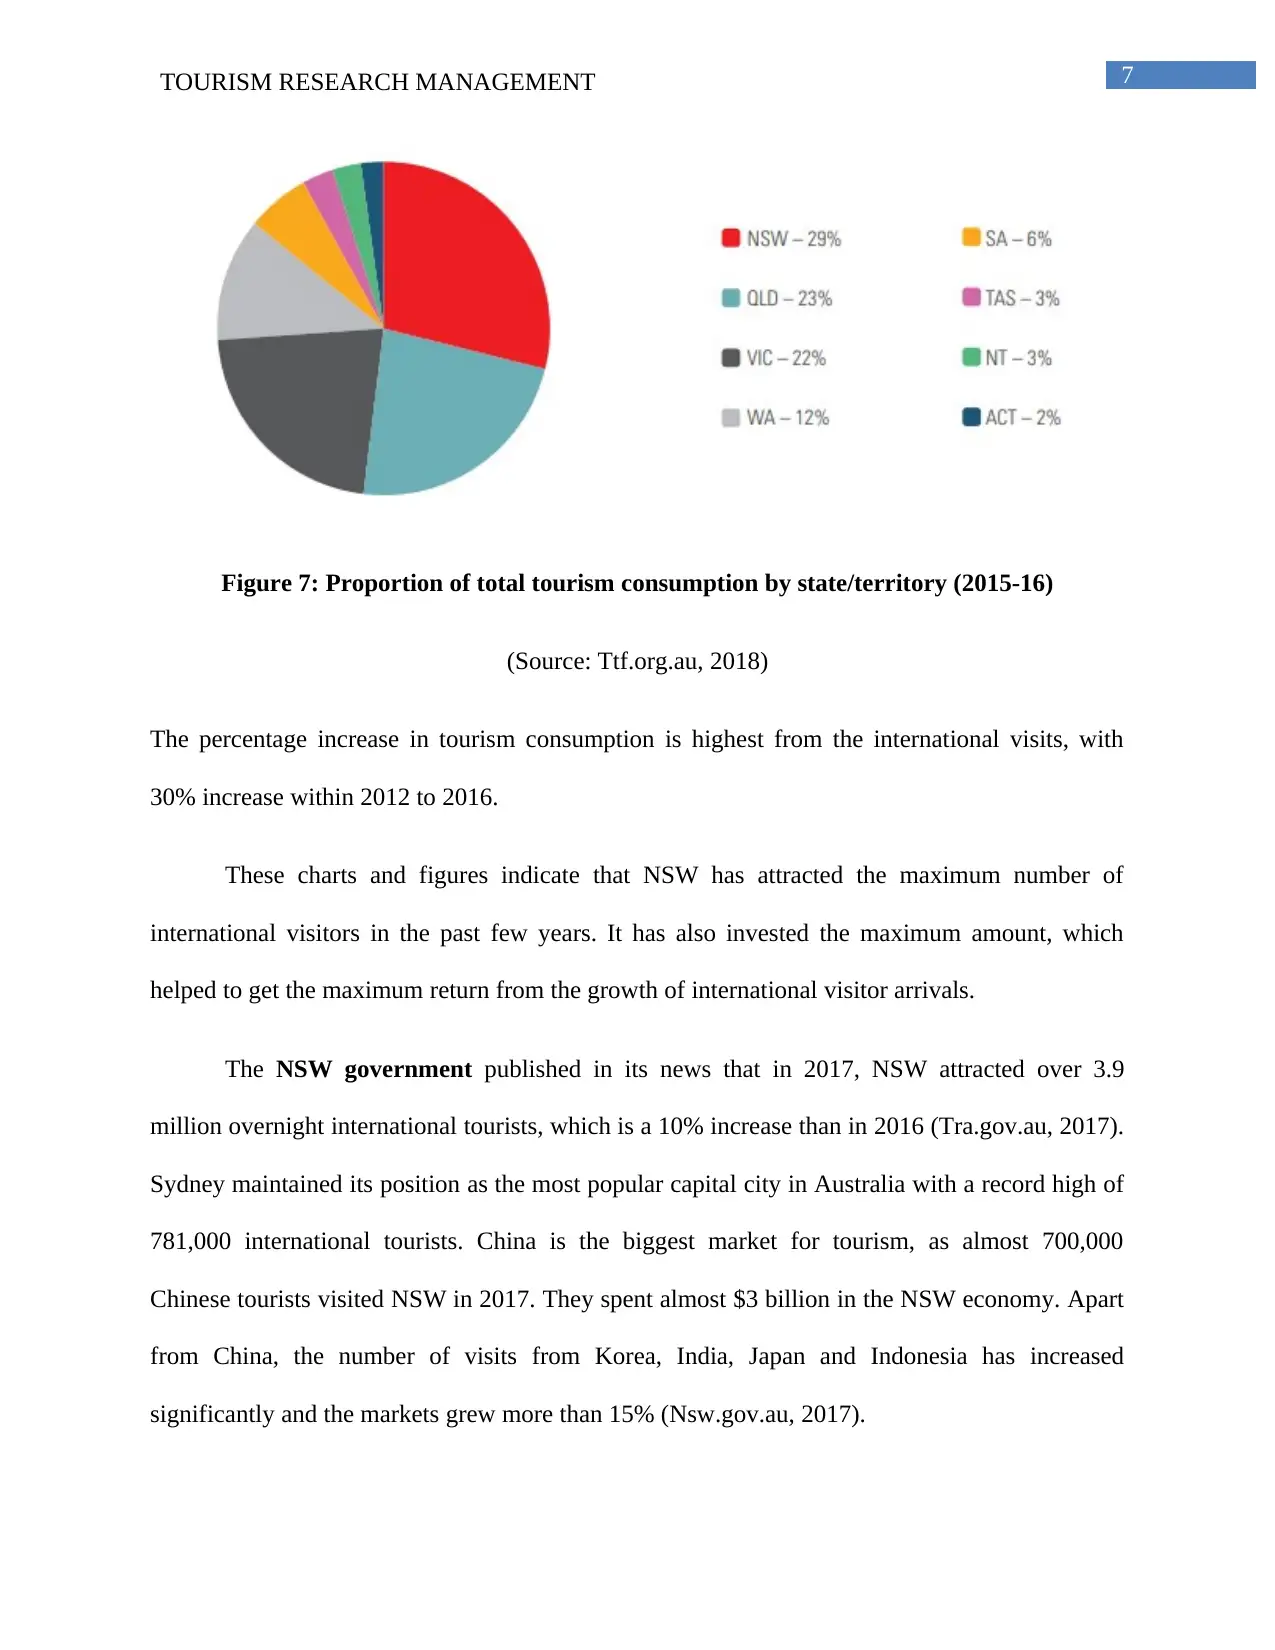
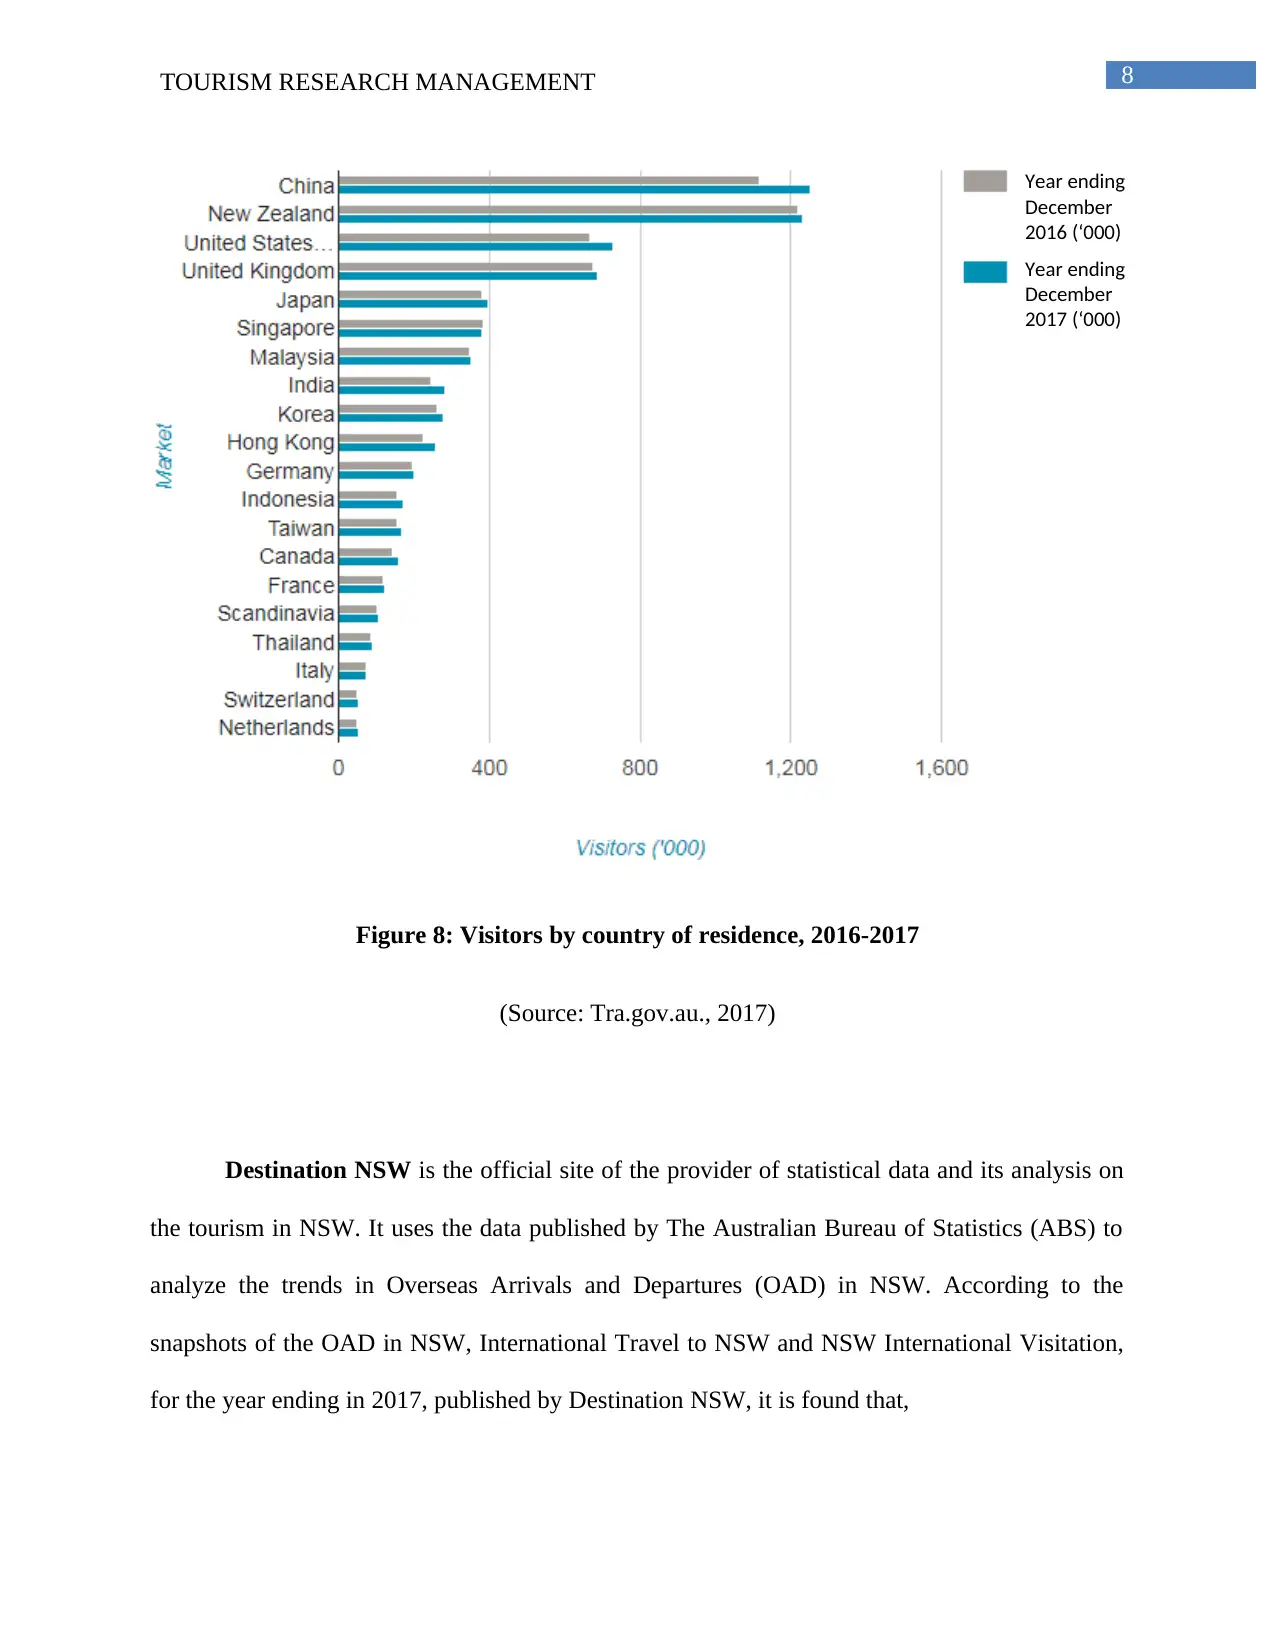
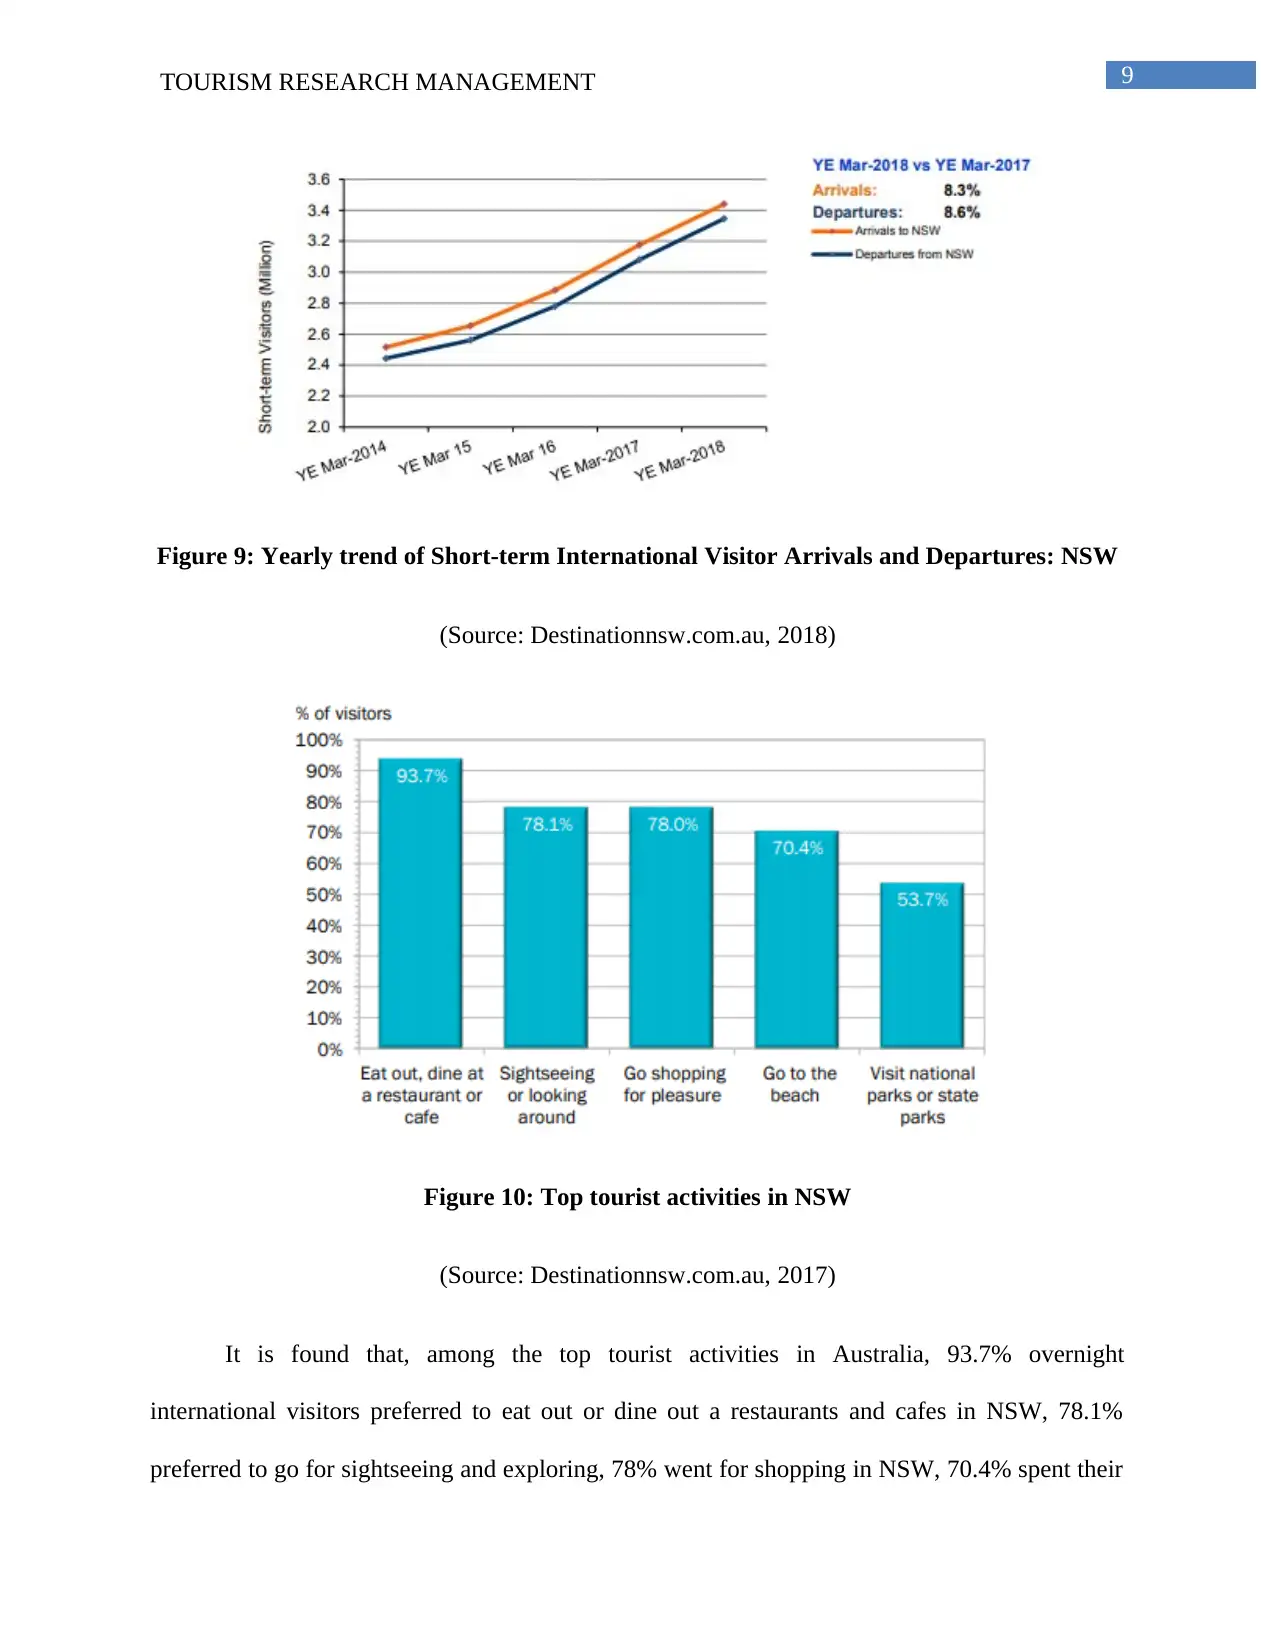
This research report analyzes the trends of international tourism in New South Wales (NSW), Australia, and its implications for predicting the future of tourism in the state. It utilizes secondary data from sources like Destination NSW, Tourism Research Australia, and Tourism & Transport Forum (TTF) to examine visitor arrivals, spending, and investment patterns. The analysis reveals that NSW leads the tourism market in Australia, attracting the highest number of international visitors and experiencing significant growth since 2012. Sydney stands out as a popular destination, with substantial contributions from Chinese tourists and increasing visits from other countries. The report highlights the NSW government's investment in tourism infrastructure and initiatives aimed at enhancing transport, supporting cultural events, and promoting sustainable tourism. The findings suggest a positive outlook for international tourism in NSW, driven by improved facilities, diverse attractions, and a strong education sector. Desklib provides access to similar reports and solved assignments for students.
Document Page
Running head: TOURISM RESEARCH MANAGEMENT
Future of International Tourism in NSW
Name of the Student:
Name of the University:
Author note:
tabler-icon-diamond-filled.svg

Paraphrase This Document

Need a fresh take? Get an instant paraphrase of this document with our AI Paraphraser
Document Page
1TOURISM RESEARCH MANAGEMENT
Introduction
Tourism in Australia is one of the major components of the economic growth. This service
sector has been rapidly growing for the past few decades. In 2014-15, the tourism sector
constituted 3% of the GDP of Australia, with AUD 47.5 billion contribution in the national
economy (Pham, Nghiem & Dwyer, 2017). All the federal territories of Australia have some
unique tourist destinations, which attract the local as well as global tourists. Among all the
territories, New South Wales (NSW) has been attracting the most national and international
tourists. Canberra, the capital of Australia and Sydney, the most glamorous city of the nation are
situated in NSW (Reisinger, 2015). According to Ironside (2015), Sydney, the state capital of
NSW, is also stated the tourism capital of Australia. The city has been flooding with local and
international tourists for the past few years. This contributes majorly in the growth of not only
the state of NSW, but also of the nation. Apart from Sydney, NSW also has many top rated
tourist attractions, which allures the international visitors more than any other territories or
states. NSW topographically represents the diverse landscapes of the nation, which is a major
attraction of this state (Hastings, 2016). Thus, the state has become most preferred tourist
destination for the international tourists. This research report will highlight the data of the
international tourism in NSW for the past few years and its impact on the economy, and will
analyze it to present the tourism trend in the state. The aim of the report is to present the future of
the international tourism in NSW.
Data collection
Data collection is the primary part for any research report. Data creates the foundation for
a research, based on which the analysis is done. Data is of two types, primary and secondary.
Primary data refers to the information that is collected directly from the field of study, while
Document Page
2TOURISM RESEARCH MANAGEMENT
secondary data is the information, which is collected from already published sources, such as,
books, peer-reviewed journals, online publications, governmental and other official websites, and
newspaper articles (Cheng & Phillips, 2014).
The research study will be conducted on the topic of trend of international tourism in
New South Wales and its implications for predicting the future of the tourism in the state. Hence,
to conduct this study, the data on international tourism in NSW from recent past is required.
Thus, secondary data, that is, published information from the following tourism government
websites will be collected. The websites are Destination NSW, Tourism Research Australia,
Production Commission of Australian Government and Tourism & Transport Forum (TTF).
These websites have published reports on international tourism trend in NSW, which will be
used for this report. The collected data will be analyzed by using the descriptive method under
qualitative analysis process. The published tables and graphs will be analyzed using descriptive
analysis method.
Data analysis
As per the report of Ttf.org.au (2018), the international tourism in Australia has been
growing rapidly. It is seen that during March 2018, there were 872,400 international visitor
arrivals, which is 13% greater from the same period in previous year. There is also a growth of
7.7% in the number of international tourists in the year ending March 2018 than the previous
year, with 9 million visitor arrivals. In this regard, the Tourism & Transport Forum (TTF) has
drilled down further to calculate the percentage of international visits in 2016 in each state and
territory of Australia.
Document Page
3TOURISM RESEARCH MANAGEMENT
According to Tourism & Transport Forum (TTF) (2018), Australia received 295
million tourists in 2016, which comprised of 190 million (64%) domestic daytrips, 94 million
(32%) domestic overnight visits and 11 million (4%) international visits. The most popular
destinations are NSW with 90 million (31%) visits, followed by 73 million (25%) in Victoria,
and 64 million (22%) in Queensland.
Figure 1: Total visitation in Australia (2016)
(Source: Ttf.org.au, 2018)
Figure 2: Proportion of total visitation by state/territory (2016)
tabler-icon-diamond-filled.svg

Paraphrase This Document

Need a fresh take? Get an instant paraphrase of this document with our AI Paraphraser
Document Page
4TOURISM RESEARCH MANAGEMENT
(Source: Ttf.org.au, 2018)
In the last few years, from 2012 to 2016, there was 14% increase in the total visits,
among which international visitation comprised of 33%, which is quite a significant number and
the majority of this visit goes to NSW. NSW experienced a significant growth of 10%.
The report also highlights the percentage of spending on international tourism by each
state and territory. It shows that, NSW invests spends the highest amount, 29.5%, among all the
states for improving the tourism facilities, within 2012 to 2015.
Figure 3: Proportion of total investment by state/territory (2015)
(Source: Ttf.org.au, 2018)
TTF also found that majority of the investments are made in the field of arts and
recreation, although NSW has focused only on accommodation facilities and aviation, which
ensures the consistency of the international visitor arrivals and overnight spending.
Document Page
5TOURISM RESEARCH MANAGEMENT
Figure 4: Investment growth by state/territory, 2012 – 2015
(Source: Ttf.org.au, 2018)
Figure 5: Total tourism investment (2015)
(Source: Ttf.org.au, 2018)
Document Page
6TOURISM RESEARCH MANAGEMENT
NSW is the most dominant jurisdiction in terms of its proportion of the tourism investment
pipeline, with 30% of the total (around $9 billion). This is followed by investment into WA
(22%), Queensland (19%) and Victoria (18%). In these states, the total investment was primarily
driven by funding in the arts & recreation industry (Ttf.org.au, 2018).
Regarding the total tourism consumption, that is, consumer spending on tourism
activities, TTF found that the total spending is highest in NSW (29%). The spending is
comprised of domestic daytrip, domestic overnight and international overnight. It can be seen
from the following graph that, in 2015-2016, the international overnight spending is maximum in
NSW.
Figure 6: Total tourism consumption (2015-16)
(Source: Ttf.org.au, 2018)
tabler-icon-diamond-filled.svg

Paraphrase This Document

Need a fresh take? Get an instant paraphrase of this document with our AI Paraphraser
Document Page
7TOURISM RESEARCH MANAGEMENT
Figure 7: Proportion of total tourism consumption by state/territory (2015-16)
(Source: Ttf.org.au, 2018)
The percentage increase in tourism consumption is highest from the international visits, with
30% increase within 2012 to 2016.
These charts and figures indicate that NSW has attracted the maximum number of
international visitors in the past few years. It has also invested the maximum amount, which
helped to get the maximum return from the growth of international visitor arrivals.
The NSW government published in its news that in 2017, NSW attracted over 3.9
million overnight international tourists, which is a 10% increase than in 2016 (Tra.gov.au, 2017).
Sydney maintained its position as the most popular capital city in Australia with a record high of
781,000 international tourists. China is the biggest market for tourism, as almost 700,000
Chinese tourists visited NSW in 2017. They spent almost $3 billion in the NSW economy. Apart
from China, the number of visits from Korea, India, Japan and Indonesia has increased
significantly and the markets grew more than 15% (Nsw.gov.au, 2017).
Document Page
8TOURISM RESEARCH MANAGEMENT
Figure 8: Visitors by country of residence, 2016-2017
(Source: Tra.gov.au., 2017)
Destination NSW is the official site of the provider of statistical data and its analysis on
the tourism in NSW. It uses the data published by The Australian Bureau of Statistics (ABS) to
analyze the trends in Overseas Arrivals and Departures (OAD) in NSW. According to the
snapshots of the OAD in NSW, International Travel to NSW and NSW International Visitation,
for the year ending in 2017, published by Destination NSW, it is found that,
Year ending
December
2016 (‘000)
Year ending
December
2017 (‘000)
Document Page
9TOURISM RESEARCH MANAGEMENT
Figure 9: Yearly trend of Short-term International Visitor Arrivals and Departures: NSW
(Source: Destinationnsw.com.au, 2018)
Figure 10: Top tourist activities in NSW
(Source: Destinationnsw.com.au, 2017)
It is found that, among the top tourist activities in Australia, 93.7% overnight
international visitors preferred to eat out or dine out a restaurants and cafes in NSW, 78.1%
preferred to go for sightseeing and exploring, 78% went for shopping in NSW, 70.4% spent their
tabler-icon-diamond-filled.svg

Paraphrase This Document

Need a fresh take? Get an instant paraphrase of this document with our AI Paraphraser
Document Page
10TOURISM RESEARCH MANAGEMENT
time in the beaches and 53.7% chose to visit the national or state parks (Destinationnsw.com.au,
2018).
Figure 11: Age group of visitors in NSW, 2017
(Source: Destinationnsw.com.au, 2017)
As seen from the above graph, among the overnight international visitors to NSW, the
biggest age group is 15 – 29 years (30.7%), followed by 30-39 years (17.7%) and 50-59 years
(16.2%).
The categories of the purpose of travel for the international visitors are holiday, visiting
friends and relatives (VFR), business, employment, and education (tra.gov.au., 2017). According
to Destination NSW (2017), the contribution of different purpose visits by the international
tourists in NSW is shown below.
Document Page
11TOURISM RESEARCH MANAGEMENT
Figure 12: Spend by Purpose of Visit (in Billion)
(Source: Destinationnsw.com.au, 2018)
It is seen that, educational visits contributed maximum (36%) in the economy of NSW in 2017,
followed by holiday purpose visits (33%) and VFR (14%).
Figure 13: International visitor nights spent within a state or territory by purpose of travel,
2013-2014
(Source: Pc.gov.au, 2015)
chevron_up_icon
1 out of 19
circle_padding
hide_on_mobile
zoom_out_icon
[object Object]