The Effect of Population Growth on the Transportation System of NSW
VerifiedAdded on 2020/05/16
|32
|6513
|207
Report
AI Summary
This report investigates the impact of population growth on the transportation system of New South Wales (NSW). It examines the relationship between population density and congestion levels, various modes of transportation (rail, bus, cars, and aircraft), and road construction. The research utilizes data collected from official websites, spanning from 2009 to 2016, and employs statistical analysis using SPSS. The report addresses specific research questions on how population density affects the NSW transport system, the influence of population growth on different modes of transport, and the correlation between population growth and road construction. The findings reveal that as the population of NSW increases, the use of all four modes of transportation also increases, leading to the construction of more roads to mitigate congestion. The report includes a literature review, methodology, findings and analysis, discussion, and conclusions, offering insights into the challenges and implications of population growth on transportation infrastructure.
Running Head: PROFESSIONAL PRACTICE
Professional Practice
The Impact on Population Growth on Trasporation System of New South Wales
Name of the Student
Name of the University
Author note
Professional Practice
The Impact on Population Growth on Trasporation System of New South Wales
Name of the Student
Name of the University
Author note
Paraphrase This Document
Need a fresh take? Get an instant paraphrase of this document with our AI Paraphraser
1PROFESSIONAL PRACTICE
Executive Summary
The report intends to evaluate the imapct of population density on the trasportation system of
New South Wales. There are three specific research questions that the paper focuses on. The
main question is how traport system of New South Wales are affected from high population
density. Additioanly, the paper tries to find how different mode of trasporation and construction
of new roads are influenced from growing population. Four mode of transportation are used
namely, rail, bus, cars and aircraft.
There are several reserches that have already undertaken in this field. Some of these paper are
based on quantitative analysis while other are based on quantitative analysis. The previous
papers conduct research on how people are affected from crowding in the trasportation. With
crowing in vehicles, people suffer from several discomfort. With increasing population road
congestion in likely to increase. People have to wait long for vehicles. Keeping in mind this
background, the paper conducts research on NSW trasportation.
Relavent data on population and transporation is collected from official websites. The data is
analyzed to find answer to the specific reserch question. It is found that with increasing
popualtion in NSW, use of all the four modes of trasportation increases. More roads are
constructed to avoid congestion.
Table of Contents
1. Introduction..................................................................................................................................3
1.1 Research Statement................................................................................................................3
1.2 Research aim and Research Question....................................................................................4
2. Literature Review........................................................................................................................4
3. Methodology................................................................................................................................9
2PROFESSIONAL PRACTICE
3.1 Data Collection......................................................................................................................9
3.2 Data Analysis.......................................................................................................................10
4. Findings and Analysis................................................................................................................11
4.1. Findings on congestion level and peak hours in NSW.......................................................11
4.2 Descriptive Statistics...........................................................................................................13
4.3 Relation between population and transportation.................................................................15
4.4 Population and different mode of transportation.................................................................15
4.5 Regression Analysis.............................................................................................................16
4.6 Population and Length of road............................................................................................19
5. Discussion..................................................................................................................................20
5.1 Population growth is related with transportation.................................................................20
5.2 Relation between different mode of transportation and population growth........................20
5.3 Road lengths are related with population............................................................................21
6. Conclusion.................................................................................................................................21
6.1 Addressing aim and objective of the research.....................................................................21
6.2. Limitation...........................................................................................................................22
6.3. Recommendation................................................................................................................22
7. Reference list.............................................................................................................................23
8. Appendix....................................................................................................................................30
1. Introduction
In the world of globalization, countries have become increasingly interconnected. In
building a strong inter-country relationship transport and communication system play an
important role. Now a day, different modes of transportation is being used. People travel to their
desired destination by road, water or air (Neirotti et al., 2014). Both private and public sector
have now come forward to invest in transportation. Means of transportation being a part of
infrastructural development has a vital role in economic growth of a nation (Meyer & Shaheen,
2017). With growing population, traffic congestion has become a major problem worldwide
(Mayer & Trevien, 2017).
⊘ This is a preview!⊘
Do you want full access?
Subscribe today to unlock all pages.
Trusted by 1+ million students worldwide
3PROFESSIONAL PRACTICE
1.1 Research Statement
The problem of traffic congestion in Australia is going worst day by day. People in
popular capital cities in Australia especially Sydney and Melbourne face trouble of congestion in
rush hours (Boyacı, Zografos, & Geroliminis, 2015). During peak hours, it takes more than
double time for commuters to reach office, schools and to other important places. New South
Wales is one of the most populated State of Australia. Around one third of Australia’s total
population live in New South Wales (Chaturvedi & Kim, 2015). The estimated population of
New South Wales during 2015-2016 is 7.7 million (Bugheanu, A. M., & Colesca, S. E. (2016).
With growing population, the state is likely to face severe traffic congestion. The research paper
aims at finding the impact of population growth on transportation system of New South Wales.
1.2 Research aim and Research Question
The aim of the research paper is to evaluate the relationship between transport system and
population growth overtime. The specific research questions are as follows
How the transport system of NSW is crowded due to high density of population?
How the mode of transportation varies with population growth?
How construction of new road is related with growth of population?
2. Literature Review
In connection to growing concern for impact of population on transportation system
several scholarly research have already been undertaken in this field. In a paper formulated by
Kroes et al., 2013 focus is given on finding the perceived value of overcrowding in public
transport vehicles in France. The paper has made a qualitative research analysis to derive
perceived value in terms of their physical comfort (Kroes et al., 2013). Passengers are classified
Paraphrase This Document
Need a fresh take? Get an instant paraphrase of this document with our AI Paraphraser
4PROFESSIONAL PRACTICE
into 4 groups- Type 1 contains passengers who fear closeness to other passengers, Type 2; this
group contains people who enjoy traveling a time of their own, Type 3; those who wait for
saving time and finally Type 4; those acting as individualist. The result of the paper reveals a
clear distinction of preferences to avoid crowding out among the four groups. Other papers as
well (Lam, Leung & Chu, 2016) support the results.
Another study developed by Haywood et al., 2017 concentrates on crowding out of
public transport vehicles. The paper has twin objectives. First is to analyze the discomfort in
public transport with varying density level and across heterogeneous groups. Second is to find
the reason for this effect of discomfort. The level of discomfort is analyzed using three different
perspectives- dissatisfaction arising from not getting seat and for long standing hours, discomfort
due to having less opportunity to utilize time at times of journey and finally uneasiness from
being physically close in the crowded vehicles (Haywood, Koning & Monchambert, 2017). The
paper concerns with interaction between in vehicle density (IVD) and crowding discomfort
(CDD). These seem to be significant and negative for discomfort measured from standing,
Wasted time and over closeness (Clifton & Mulley, 2016). Passengers having high level of
dissatisfaction in any of these three discomfort have greater disutility from crowing effect (Lam,
Taghia & Katupitiya, 2016). The results show Standing and Time Wasted from it are the most
important aspect affecting satisfaction (Geertman et al., 2017). This is followed by the problem
of over closeness. It is found that people have high disutility in times of high density followed
from long standing during their journey (Pearce, 2017).). The disutility arises from the not
getting scope for utilizing time while traveling and physical closeness to other passengers.
A similar research is conducted by Tiranchi, Hensher and Rose in their paper in 2016.
The effect of passengers’ density is different at bus stops, rail stations and inside trains and
5PROFESSIONAL PRACTICE
buses. The single paper researches on multiple dimension relating to long waiting time,
reliability of travel time, well-being of passengers, importance of time saving in vehicles, choice
of travelling route, size of vehicles and its fare (Tirachini, Hensher & Rose, 2013). The
externalities from crowding in vehicles are for bus and rai service in Sydney are estimated to
capture the impact of crowding on prediction of demand and in-vehicle time saving. A regression
estimation is made to find out how crowding impacted passengers in times of alighting and
boarding. The high level of occupancy raises the probability of vehicle circulation (Philip et al.,
2014). This causes people to wait for a long time in stations and bus stops increasing the waiting
time and variability of travel time (Hendrigan & Newman, 2017). While coming to impacts of
health and well-being the paper documented an increase in anxiety, exhaustion, stress level with
perceived risk for personal safety and interruption of privacy. These factors contribute to a
negative valuation for the resulting from high occupancy of passengers at stations and stops
(Chen, Gong & Paaswell, 2012). The passengers’ choice is likely to be affected from competing
routes and unbalanced loads of vehicles (Gharehbaghi & Georgy, 2015). The externality arises
from crowding increases marginal cost for travelling. This external effect should be taken into
consideration for designing the system of public transport. The frequency for vehicles
availability, its size and fare are subjected to the impact of population growth on vehicles
(Glazier et al., 2014).
The research paper developed by Li et al. in 2016, studies traveler’s mode of choice in
the presence of a multimodal network. The paper conducts a comprehensive study on perceived
behavioral differences based on a travel time reliability (TTR) model with considering crowding
out for different transport modes with a multimodal network. A survey of passengers’ is
conducted at two stage including a combined mode of travel with park and ride in reference to
⊘ This is a preview!⊘
Do you want full access?
Subscribe today to unlock all pages.
Trusted by 1+ million students worldwide
6PROFESSIONAL PRACTICE
four major factors ( Li, Gao & Tu, 2016). In the first stage, the perceived travel time reliability in
obtained with respect to delays at different transportation mode (Li, Burke & Dodson, 2017).
After obtaining perceived TTR, in the next stage the paper designs an experimental analysis
using balance theory of utility for the stated preference survey to examine mode of choice
behavior and the difference in passengers’ perception in TTR and crowding (Chen, Gong &
Paaswell, 2012). The results obtained from the first stage survey revealed that the travelers have
differential tolerance level regarding the span of accepted delays for different modes (Saberi et
al., 2017). The perceived TTR of travelers measured in relation to a certain delay differs by
transportation mode (Ricciardi, Xia & Currie, 2015). The survey results from the second stage
further confirms the result of perceived difference obtained from the first stage survey (Grinin &
Korotayev, 2018). TTR based on different modes greatly influences choice behavior and hence
should be taken for consideration in times of forecasting models used for analyzing mode in a
multimodal network (Blanco Ramírez, 2016).
There are studies that found some contrasting results on effect of population growth on
mode of transportation and satisfaction. According to Olsen, Macdonald and Ellaway, 2017 the
effect of population growth on trasportation is not uniform. That is it is not true that population
growth always have detremental effect on satisfaction and transportation (Olsen, Macdonald &
Ellaway, 2017). Studies aim at finding how overtime satisfaction changes with mode of
trasportation. It is found that satisfaction level of two third of the population increases with their
mode of transporatation (Boyacı, Zografos & Geroliminis, 2015). The unsatisfied people are
those who has poor health condition. Access to car was related with satisfaction level of
transportation (Yao & Yang, 2012). The deprivation or dissatisfaction offsets when adjusted for
car access to household. When population from 1997 to 2010 are considered, the results shows
Paraphrase This Document
Need a fresh take? Get an instant paraphrase of this document with our AI Paraphraser
7PROFESSIONAL PRACTICE
most of the retired individuals travelled by public transport with satisfaction (Bugheanu &
Colesca, 2016). However, those using private car are relatively less satisfied following increased
consumption level.
Based on the theoretical backgroud and research objectives following hypotheses are framed
Hypothesis 1
H01: There is no significant relation between railway trasporation and population growth
HA1: Significant relation exist between railway transpportation and population growth.
Hypothesis 2
H02: There is no significant relation between bus transportation and growth of population.
HA2: Population growth significantly influences bus transportation
Hypothesis 3
H03: There is no significant relation between aircraft travel and growth of population.
HA3: Population growth significantly influences aircraft travel and population growth
Hypothesis 4
H04: There is no significant relation between private car transportation and growth of
population.
HA4: A significant relation exists car transportation and population growth
8PROFESSIONAL PRACTICE
3. Methodology
3.1 Data Collection
Data on population and different mode of transportation are collected along with length
of road and safety measures. The timeframe considered are varied from 2009 to 2016. All the
relevant data are collected for New South Wales, one if the major capital city of Australia. The
data on population is obtained from “Australian bureau of statistics’. The data related to
transportation system are collected from ‘NSW and Sydney Transportation Facts’.
3.2 Data Analysis
The paper has conducted a quantitative research analysis. The obtained data are analyzed
with statistical software namely SPSS. The trend in population growth is considered by
constructing a line graph with respect to time. The description statistics is estimated to have an
overall idea about the mean, variability, range of the data set for the chosen timeframe (Golub &
Martens, 2014). As far as mode of transportation is concerned, transportation via Rail and Bus
routes are considered. The length of roads are considered for different time to find whether
population growth significantly influence length of roads. Finally, data on road, rail and aviation
accidents are considered to analyze the safety status.
⊘ This is a preview!⊘
Do you want full access?
Subscribe today to unlock all pages.
Trusted by 1+ million students worldwide
9PROFESSIONAL PRACTICE
4. Findings and Analysis
4.1. Findings on congestion level and peak hours in NSW
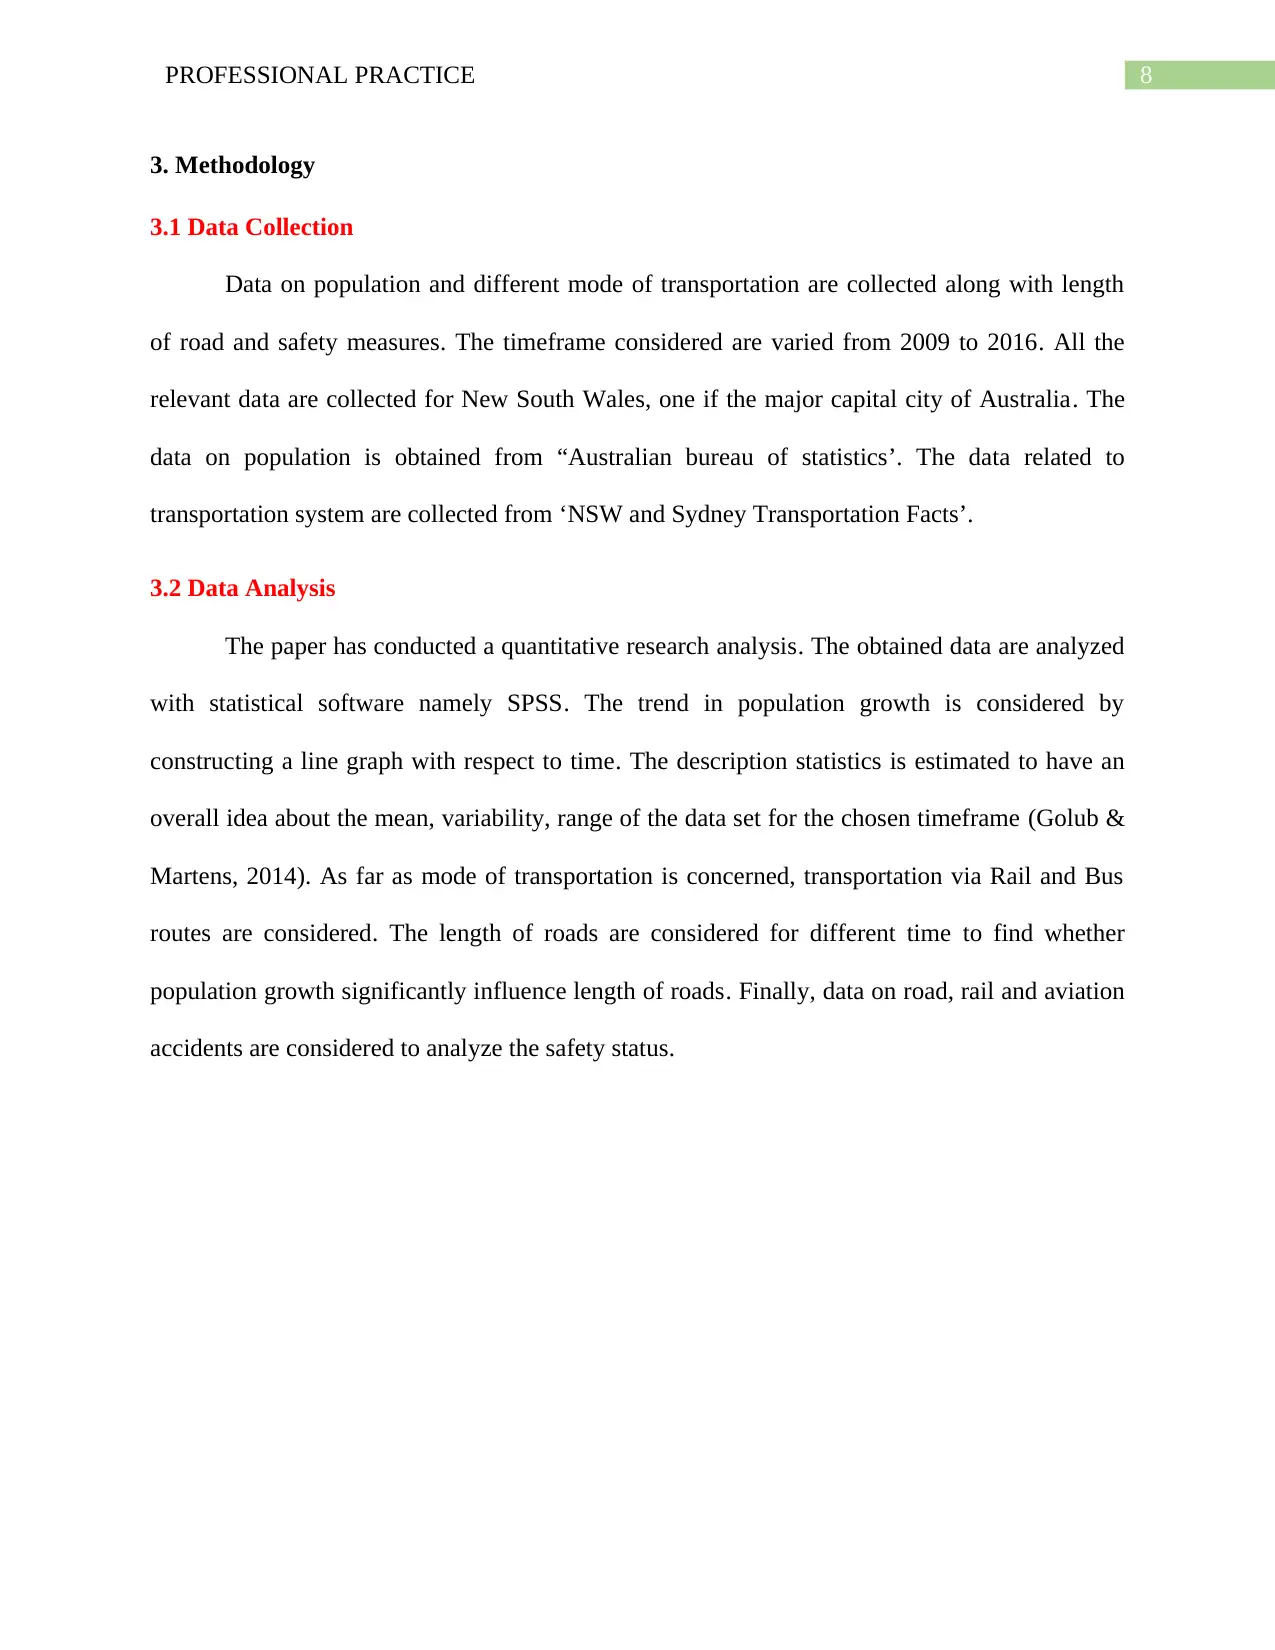
Chart 1: History of congestion level in NSW
The congestion history in New South Wales is presented in the above figure. In 2008, the
congestion level is below 20%. From 2009 onwards, the congestion level started to increase and
remain at the level 20% until 2015. Between 2015 and 2016, the congestion level grows up
slightly (Parolin & Rostami, 2017).
4. Findings and Analysis
4.1. Findings on congestion level and peak hours in NSW
Chart 1: History of congestion level in NSW
The congestion history in New South Wales is presented in the above figure. In 2008, the
congestion level is below 20%. From 2009 onwards, the congestion level started to increase and
remain at the level 20% until 2015. Between 2015 and 2016, the congestion level grows up
slightly (Parolin & Rostami, 2017).
Paraphrase This Document
Need a fresh take? Get an instant paraphrase of this document with our AI Paraphraser
10PROFESSIONAL PRACTICE
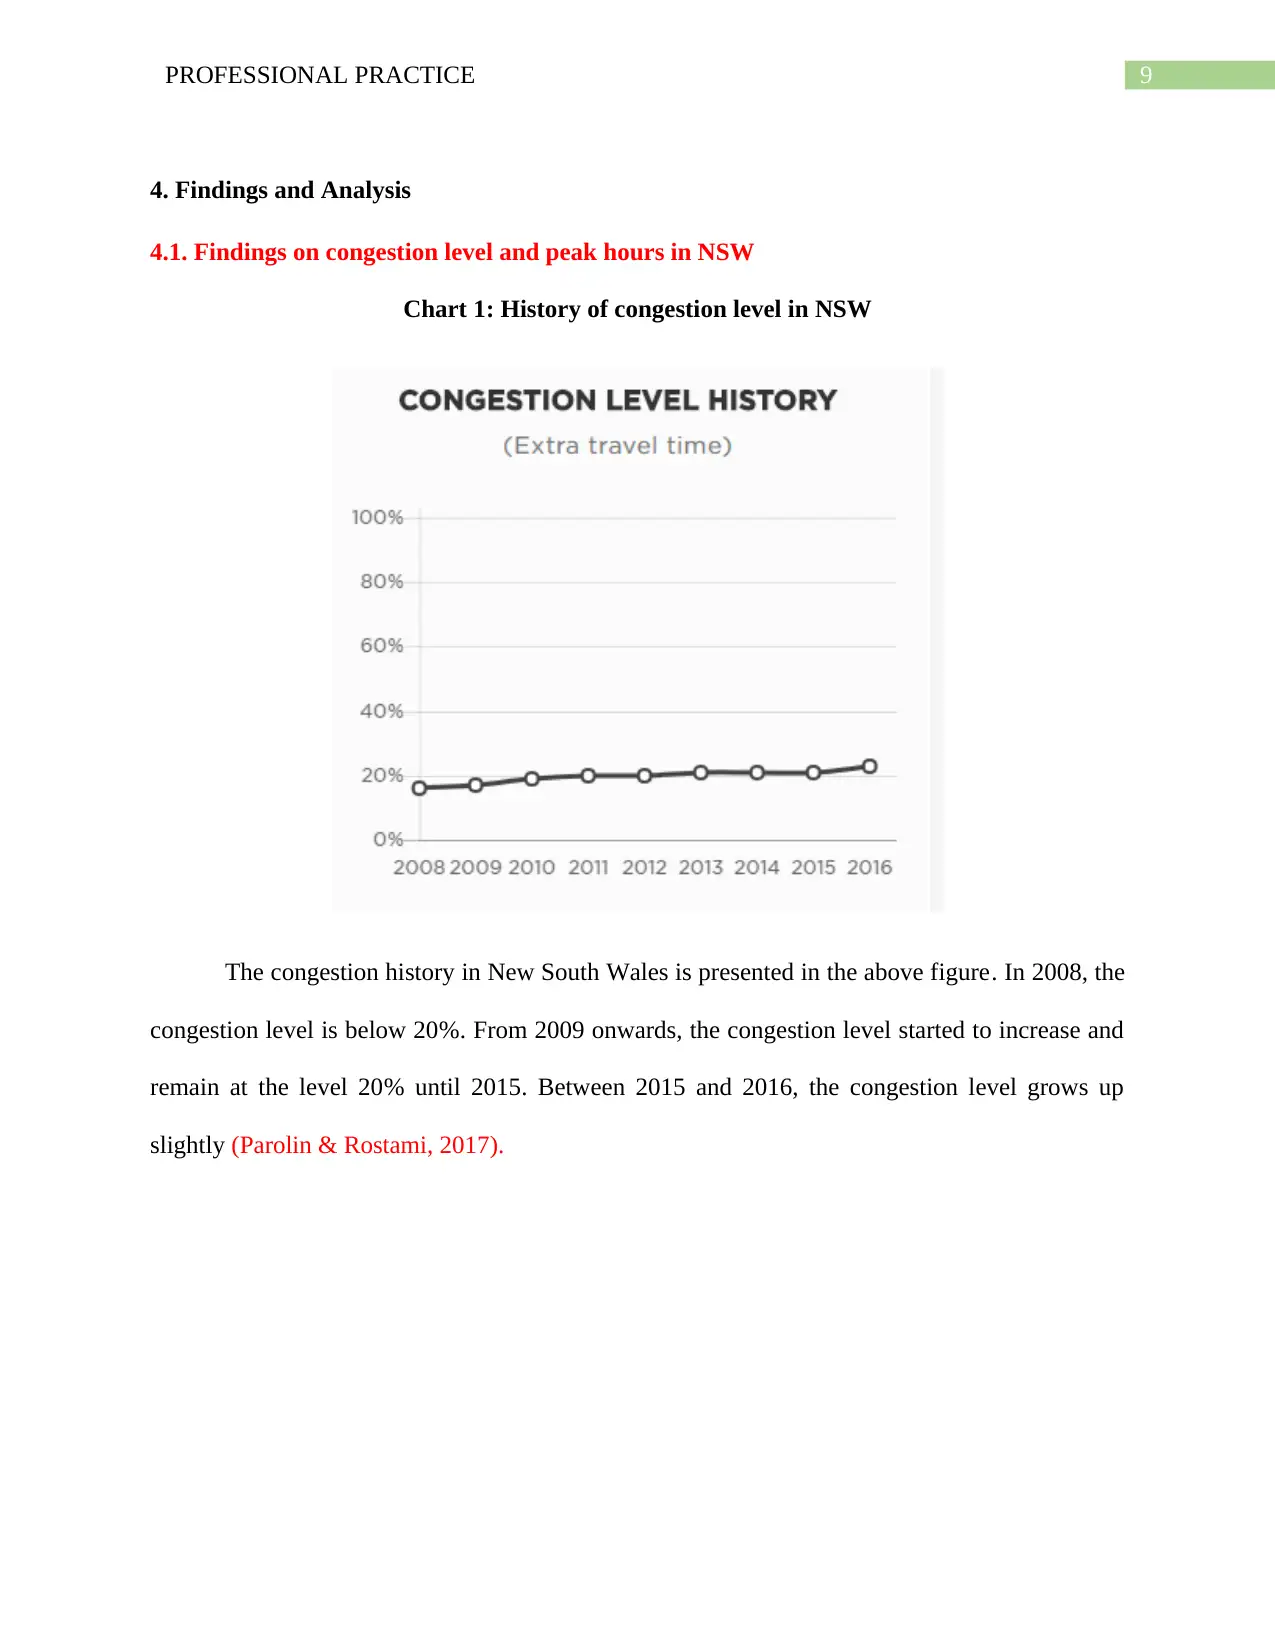
Char 2: Evening Peak Hours in NSW
The evening peak rate for different days of the week are considered. The peak rate for
Monday and Tuesday is almost same (Pettit et al., 2017) . Evening is high in Wednesday and
Thursday. Evening peak in Friday is less as compared to that is Thursday.
Chart 3: Morning Peak in NSW
The morning peak is greater as compared to the evening peak. Because of rush hours for
schools and offices morning peak is higher. The peak rate is maximum for Wednesday. For
11PROFESSIONAL PRACTICE
Tuesday and Thursday, peak rate is around that in Wednesday. For Monday and Friday, peak
rate is lower as compared to three other days but still higher than evening peak.
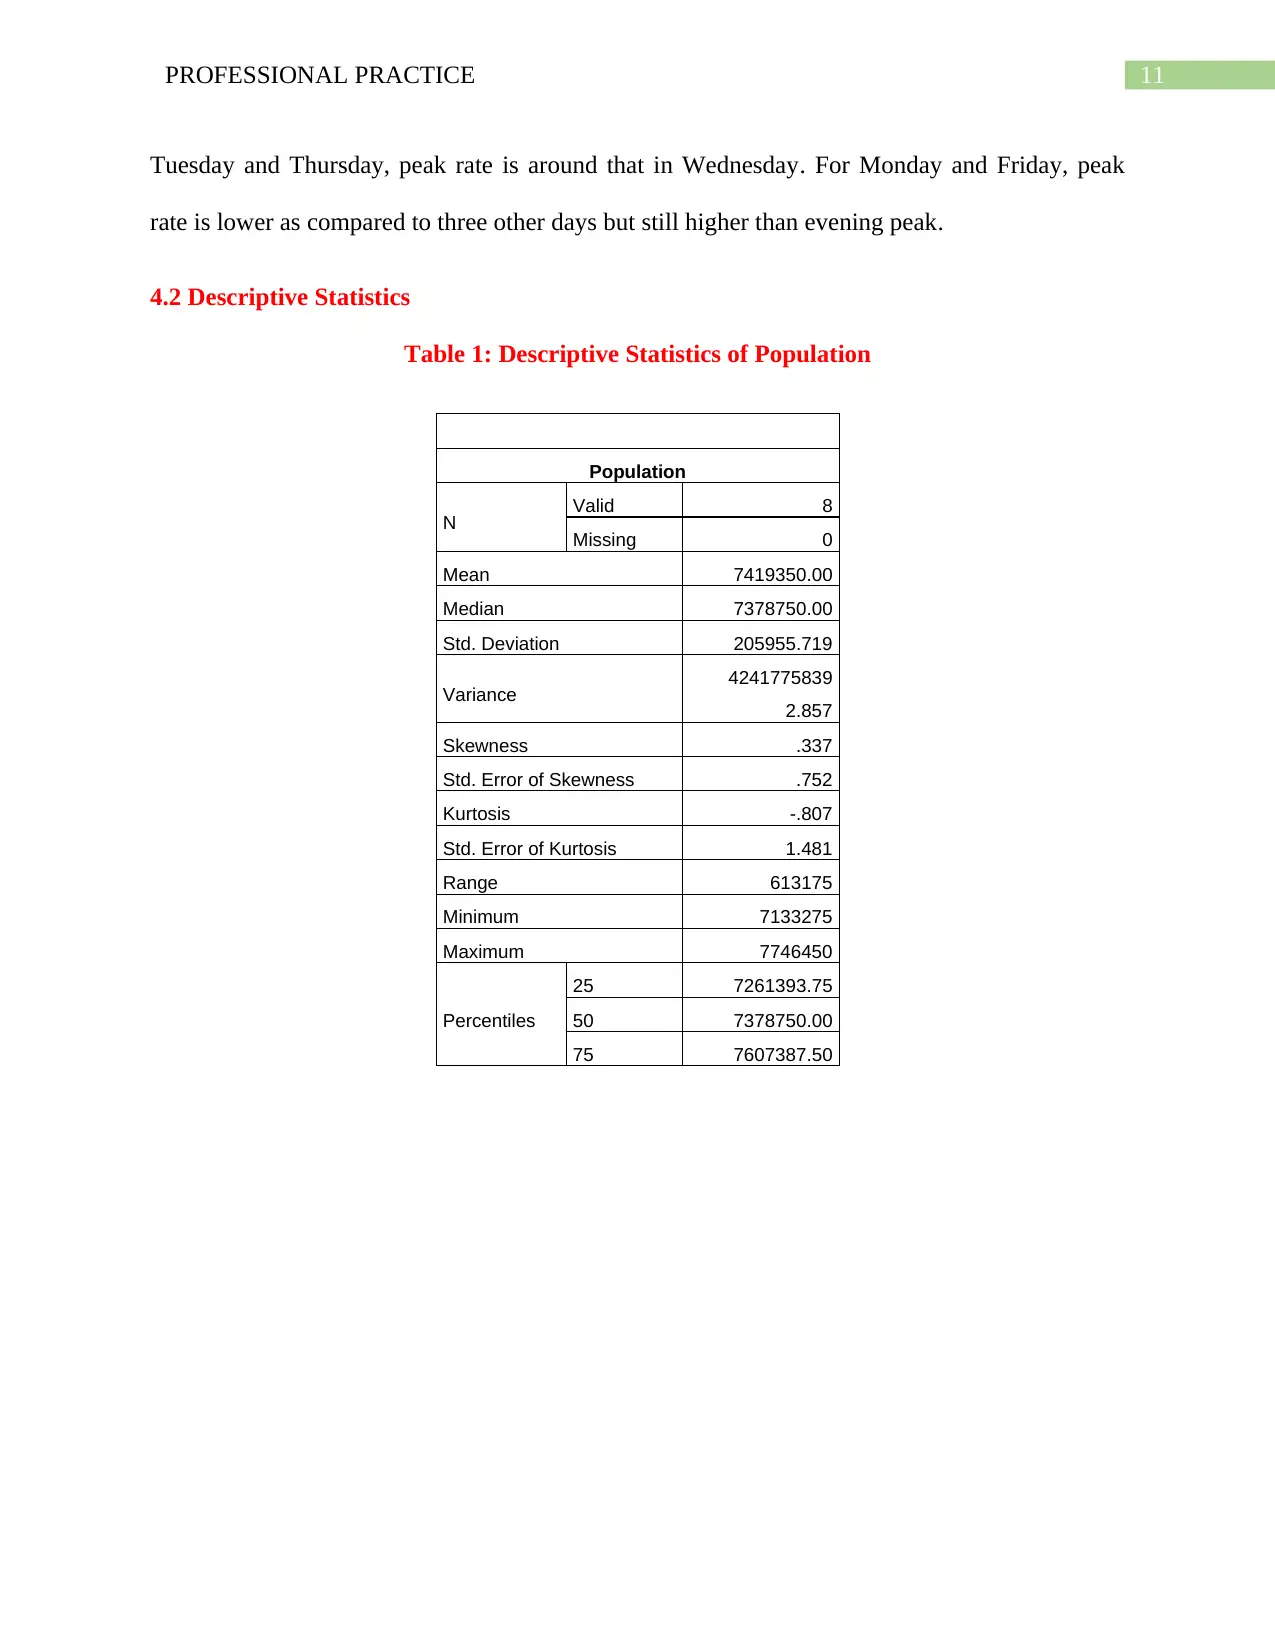
4.2 Descriptive Statistics
Table 1: Descriptive Statistics of Population
Population
N Valid 8
Missing 0
Mean 7419350.00
Median 7378750.00
Std. Deviation 205955.719
Variance 4241775839
2.857
Skewness .337
Std. Error of Skewness .752
Kurtosis -.807
Std. Error of Kurtosis 1.481
Range 613175
Minimum 7133275
Maximum 7746450
Percentiles
25 7261393.75
50 7378750.00
75 7607387.50
Tuesday and Thursday, peak rate is around that in Wednesday. For Monday and Friday, peak
rate is lower as compared to three other days but still higher than evening peak.
4.2 Descriptive Statistics
Table 1: Descriptive Statistics of Population
Population
N Valid 8
Missing 0
Mean 7419350.00
Median 7378750.00
Std. Deviation 205955.719
Variance 4241775839
2.857
Skewness .337
Std. Error of Skewness .752
Kurtosis -.807
Std. Error of Kurtosis 1.481
Range 613175
Minimum 7133275
Maximum 7746450
Percentiles
25 7261393.75
50 7378750.00
75 7607387.50
⊘ This is a preview!⊘
Do you want full access?
Subscribe today to unlock all pages.
Trusted by 1+ million students worldwide
1 out of 32
Related Documents


Your All-in-One AI-Powered Toolkit for Academic Success.
+13062052269
info@desklib.com
Available 24*7 on WhatsApp / Email
![[object Object]](/_next/static/media/star-bottom.7253800d.svg)
Unlock your academic potential
Copyright © 2020–2026 A2Z Services. All Rights Reserved. Developed and managed by ZUCOL.