Financial Analysis Report: Nufarm Limited's Performance and Key Ratios
VerifiedAdded on 2023/01/04
|19
|4171
|44
Report
AI Summary
This report provides a comprehensive financial analysis of Nufarm Limited, an ASX-listed agricultural chemical company. The analysis focuses on the company's performance in 2018 and 2019, utilizing ratio analysis to assess profitability, efficiency, and liquidity. The report compares key financial highlights, including return on equity, return on assets, gross profit margin, net profit margin, and earnings per share. Efficiency ratios such as asset turnover, inventory turnover, and debtor turnover are examined to evaluate the company's operational effectiveness. Liquidity ratios, including current ratio, quick ratio, and cash flow ratio, are used to assess the company's ability to meet its short-term obligations. The analysis reveals that Nufarm's financial performance improved in 2019 compared to 2018, particularly in terms of profitability and liquidity. The report highlights specific areas where the company demonstrated enhanced performance, such as dividend payout ratio and quick ratio, while also pointing out areas needing improvement, such as inventory and debtor turnover days. The report concludes with recommendations for further improvement in financial management and operational efficiency.

Financial Management
Paraphrase This Document
Need a fresh take? Get an instant paraphrase of this document with our AI Paraphraser
EXECUTIVE SUMMARY
The project report is based on analysis of financial performance of ASX limited company named
as Nufarm limited. The report summarizes detailed information of financial aspect of chosen
company for two distinct year and these outcomes are compared with industry’s ratios. From
below done analysis, this can be abstracted that company’s performance is better in year 2019
compared to year 2018.
Contents
EXECUTIVE SUMMARY.........................................................................................................................2
INTRODUCTION.......................................................................................................................................4
COMPANY ANALYSIS............................................................................................................................4
RATIO ANALYSIS....................................................................................................................................5
RECOMMENDATIONS...........................................................................................................................11
REFERENCES..........................................................................................................................................14
APPENDIX...............................................................................................................................................15
⊘ This is a preview!⊘
Do you want full access?
Subscribe today to unlock all pages.
Trusted by 1+ million students worldwide
INTRODUCTION
Financial management can be described as the field or role of an entity dealing with revenue,
spending, cash and credit, such that "organization may have the capability to take out its mission
as adequately as possible;" the latter is often characterized as optimizing the worth of the firm to
shareholders (Shapiro and Hanouna, 2019). The project report is based on a company which is
Nufarm limited. Nufarm is an Agricultural production chemical company based in Melbourne,
Australia. The business was launched in 1956 by Max Fremder. It maintains more than 2,100
brand approvals and sells products in far more than 100 nations in overall world. The business is
a producer of phenoxins, a class of insecticides that monitor and kills large-leaved weeds (About
Nufarm limited, 2020). These goods are produced at internationally interconnected factories in
Australia, England, Austria and the Netherlands. A broad variety of other crop protection goods
are manufactured at manufacturing plants in Australia, New Zealand, Asia, Europe, Africa and
the United States.
The report’s objective is to assess financial performance of above company and it has been done
by help of ratio analysis. Under report, detailed ratio analysis is performed by considering this
company and making comparison with industry’s ratios.
COMPANY ANALYSIS
Current Financial performance, Key financial highlights, Economic outlook
Current financial performance: In accordance of data of September, 2020, this can be stated that
company’s current assets value has been reduced as compared to March 2020. This is so because
in March 2020, current assets were of $2,617,477 Million which reduced and became of $
2,352,471 Million in September 2020 (Current financial performance of Nufarm limited, 2020).
Similarly, company’s total assets were also lower than previous time. While in the aspect of net
profit, this can be stated that company’s net margin has been dropped in September 2020
compared to March 2020. Hence, this can be stated that company’s current performance is less
effective.
Paraphrase This Document
Need a fresh take? Get an instant paraphrase of this document with our AI Paraphraser
Key financial highlights: On the basis of data of year 2020, below key highlights can be noted
that are as follows:
Reduction in dividend payment in September by 97.36%. As during March 2020,
company paid dividend of $ 90,296 Million while in September 2020, they just paid of $
2,132 Million.
There is huge reduction in cash flow from investing activities as in March 2020; there
was cash inflow of $ 1,115,592 Million which turned into cash outflow of $ 20,917
Million in September 2020 (Current financial performance of Nufarm limited, 2020).
Economic outlook: In accordance of current financial performance, above company’s future
analysis is done below in such manner:
Analysts expect that Nufarm will have strong growth opportunities for the next three
years. Projections of earnings per share ranged from $0.51 to $0.79, with average
projections of 78.6 per cent rise.
Around the same period, sales are projected to rise from $2,963 million to $3,207 million
in 2020 and the income is projected to increase marginally from $139 million to $183
million in 2020, nearly 1.3-fold (About future prospective of company, 2020). Profits are
still expected to be very appropriate at 5.7% during this period.
RATIO ANALYSIS
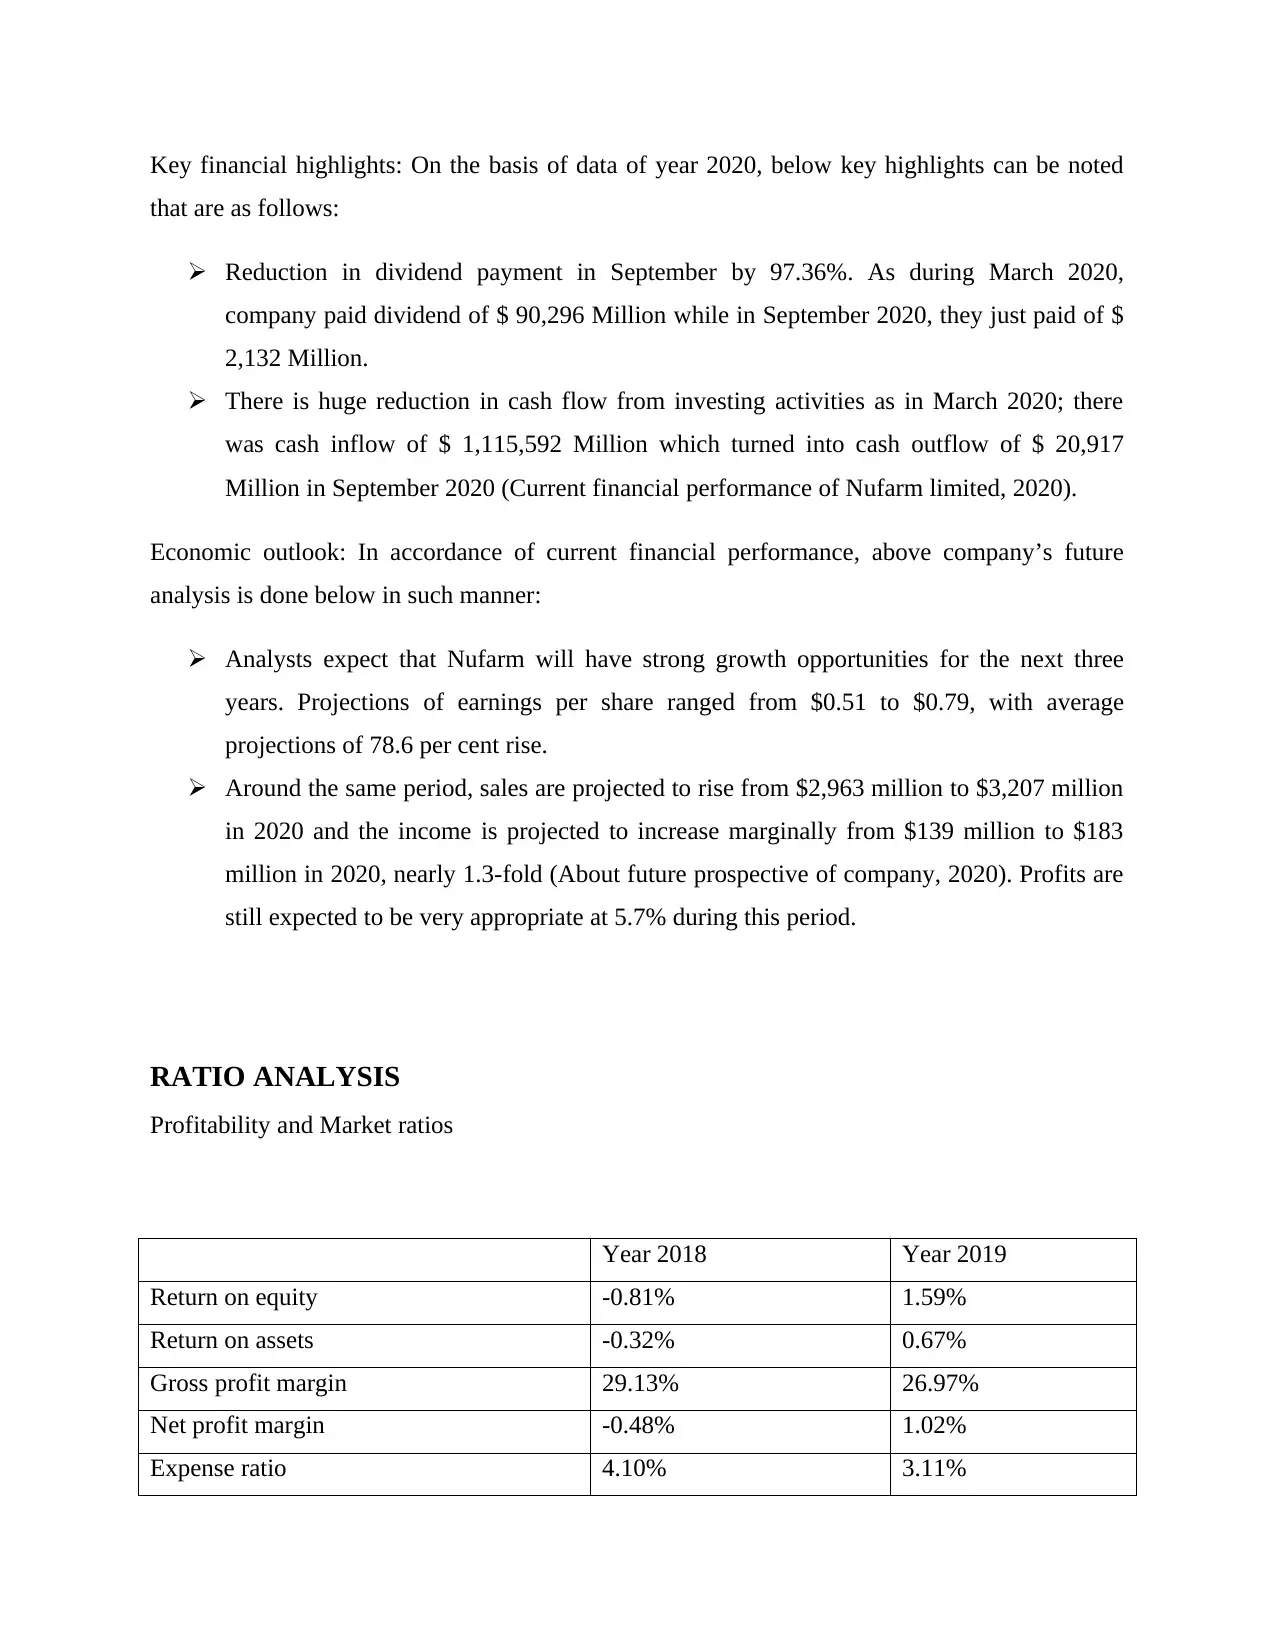
Profitability and Market ratios
Year 2018 Year 2019
Return on equity -0.81% 1.59%
Return on assets -0.32% 0.67%
Gross profit margin 29.13% 26.97%
Net profit margin -0.48% 1.02%
Expense ratio 4.10% 3.11%
that are as follows:
Reduction in dividend payment in September by 97.36%. As during March 2020,
company paid dividend of $ 90,296 Million while in September 2020, they just paid of $
2,132 Million.
There is huge reduction in cash flow from investing activities as in March 2020; there
was cash inflow of $ 1,115,592 Million which turned into cash outflow of $ 20,917
Million in September 2020 (Current financial performance of Nufarm limited, 2020).
Economic outlook: In accordance of current financial performance, above company’s future
analysis is done below in such manner:
Analysts expect that Nufarm will have strong growth opportunities for the next three
years. Projections of earnings per share ranged from $0.51 to $0.79, with average
projections of 78.6 per cent rise.
Around the same period, sales are projected to rise from $2,963 million to $3,207 million
in 2020 and the income is projected to increase marginally from $139 million to $183
million in 2020, nearly 1.3-fold (About future prospective of company, 2020). Profits are
still expected to be very appropriate at 5.7% during this period.
RATIO ANALYSIS
Profitability and Market ratios
Year 2018 Year 2019
Return on equity -0.81% 1.59%
Return on assets -0.32% 0.67%
Gross profit margin 29.13% 26.97%
Net profit margin -0.48% 1.02%
Expense ratio 4.10% 3.11%
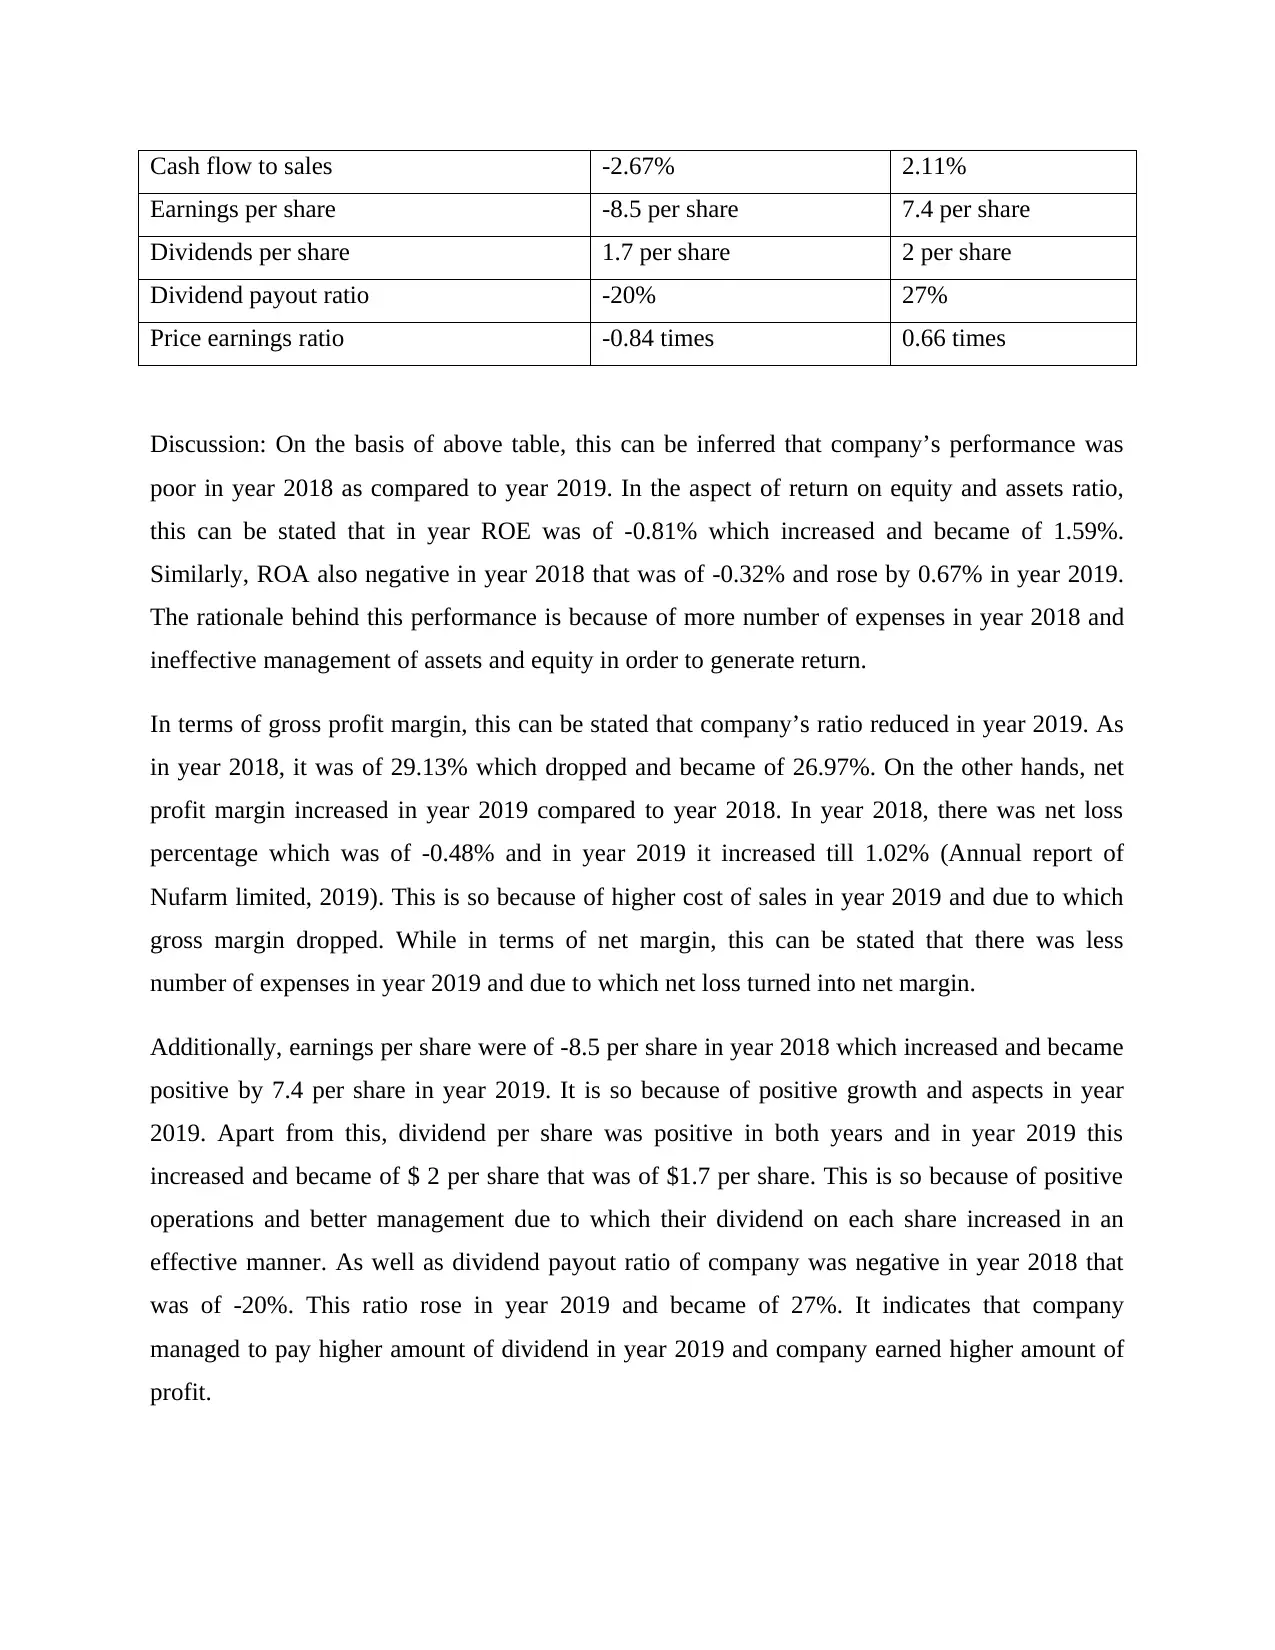
Cash flow to sales -2.67% 2.11%
Earnings per share -8.5 per share 7.4 per share
Dividends per share 1.7 per share 2 per share
Dividend payout ratio -20% 27%
Price earnings ratio -0.84 times 0.66 times
Discussion: On the basis of above table, this can be inferred that company’s performance was
poor in year 2018 as compared to year 2019. In the aspect of return on equity and assets ratio,
this can be stated that in year ROE was of -0.81% which increased and became of 1.59%.
Similarly, ROA also negative in year 2018 that was of -0.32% and rose by 0.67% in year 2019.
The rationale behind this performance is because of more number of expenses in year 2018 and
ineffective management of assets and equity in order to generate return.
In terms of gross profit margin, this can be stated that company’s ratio reduced in year 2019. As
in year 2018, it was of 29.13% which dropped and became of 26.97%. On the other hands, net
profit margin increased in year 2019 compared to year 2018. In year 2018, there was net loss
percentage which was of -0.48% and in year 2019 it increased till 1.02% (Annual report of
Nufarm limited, 2019). This is so because of higher cost of sales in year 2019 and due to which
gross margin dropped. While in terms of net margin, this can be stated that there was less
number of expenses in year 2019 and due to which net loss turned into net margin.
Additionally, earnings per share were of -8.5 per share in year 2018 which increased and became
positive by 7.4 per share in year 2019. It is so because of positive growth and aspects in year
2019. Apart from this, dividend per share was positive in both years and in year 2019 this
increased and became of $ 2 per share that was of $1.7 per share. This is so because of positive
operations and better management due to which their dividend on each share increased in an
effective manner. As well as dividend payout ratio of company was negative in year 2018 that
was of -20%. This ratio rose in year 2019 and became of 27%. It indicates that company
managed to pay higher amount of dividend in year 2019 and company earned higher amount of
profit.
⊘ This is a preview!⊘
Do you want full access?
Subscribe today to unlock all pages.
Trusted by 1+ million students worldwide
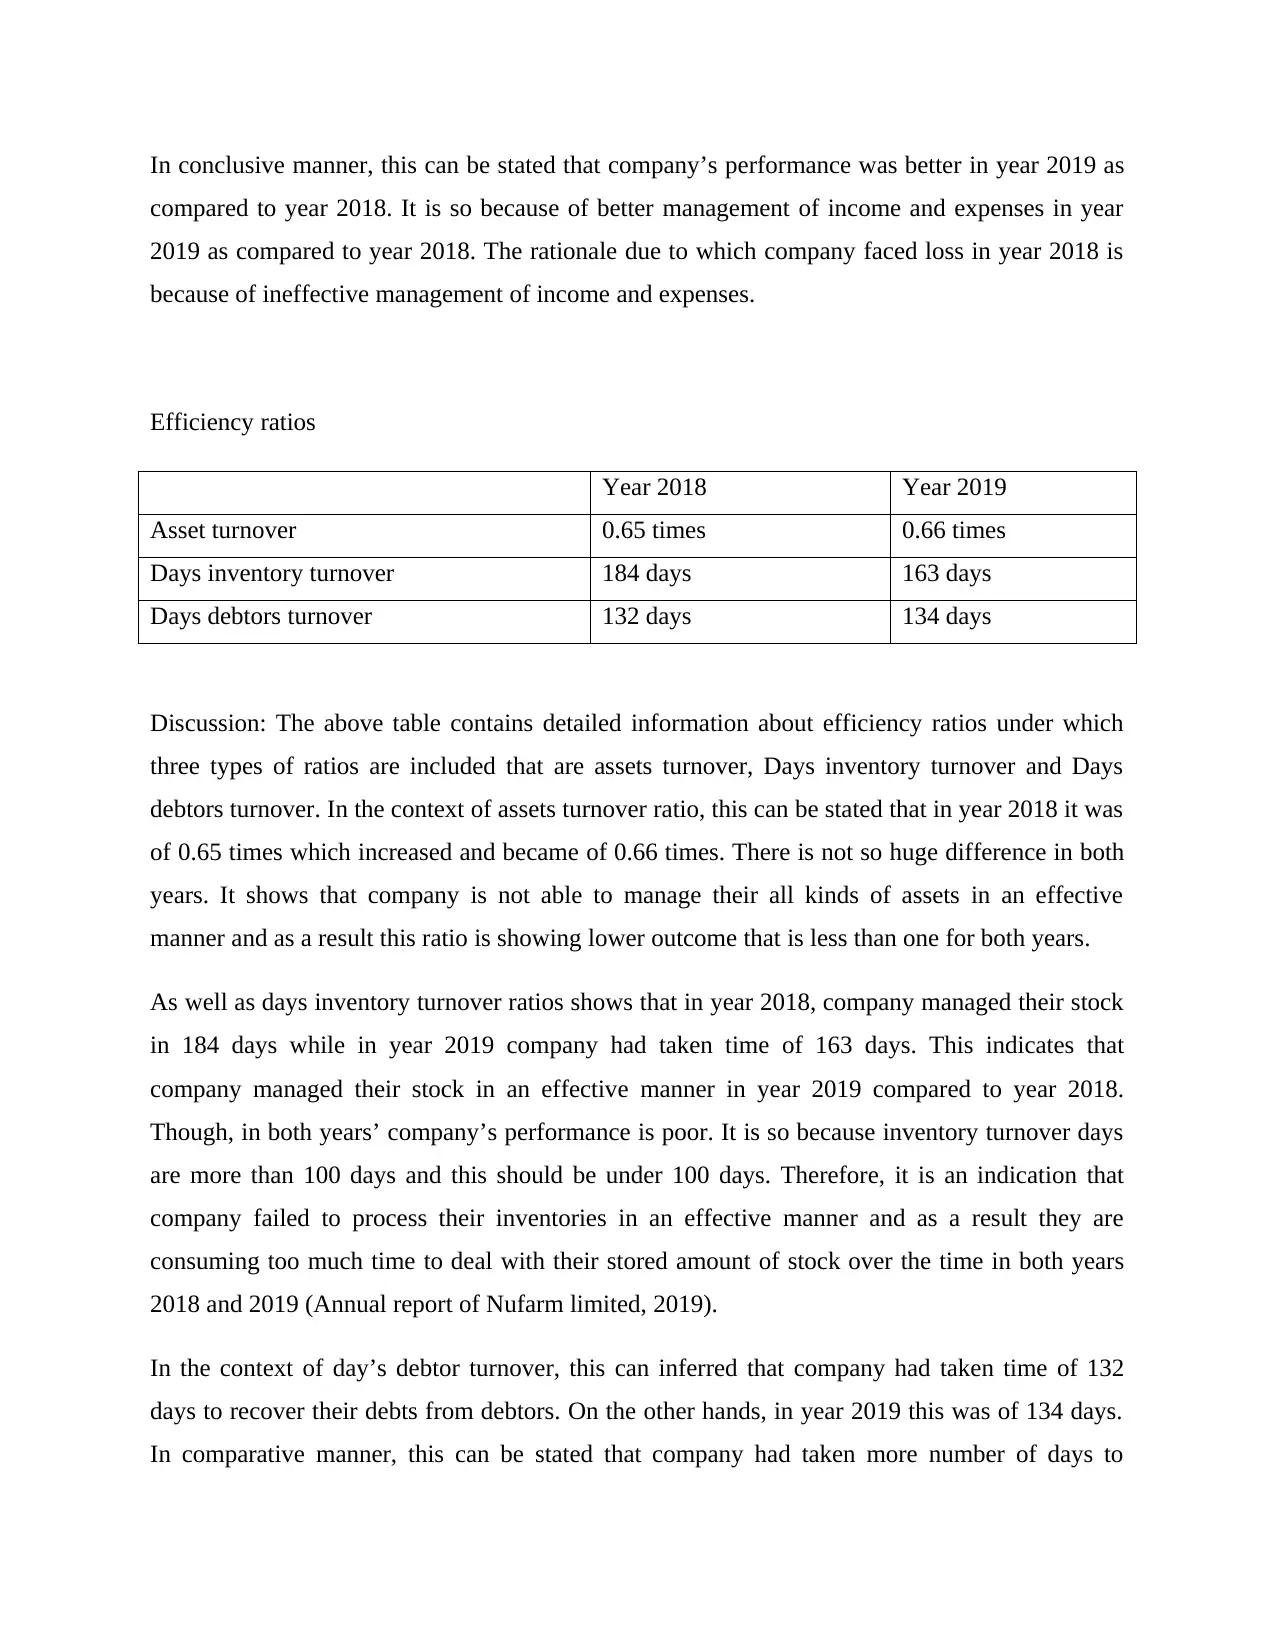
In conclusive manner, this can be stated that company’s performance was better in year 2019 as
compared to year 2018. It is so because of better management of income and expenses in year
2019 as compared to year 2018. The rationale due to which company faced loss in year 2018 is
because of ineffective management of income and expenses.
Efficiency ratios
Year 2018 Year 2019
Asset turnover 0.65 times 0.66 times
Days inventory turnover 184 days 163 days
Days debtors turnover 132 days 134 days
Discussion: The above table contains detailed information about efficiency ratios under which
three types of ratios are included that are assets turnover, Days inventory turnover and Days
debtors turnover. In the context of assets turnover ratio, this can be stated that in year 2018 it was
of 0.65 times which increased and became of 0.66 times. There is not so huge difference in both
years. It shows that company is not able to manage their all kinds of assets in an effective
manner and as a result this ratio is showing lower outcome that is less than one for both years.
As well as days inventory turnover ratios shows that in year 2018, company managed their stock
in 184 days while in year 2019 company had taken time of 163 days. This indicates that
company managed their stock in an effective manner in year 2019 compared to year 2018.
Though, in both years’ company’s performance is poor. It is so because inventory turnover days
are more than 100 days and this should be under 100 days. Therefore, it is an indication that
company failed to process their inventories in an effective manner and as a result they are
consuming too much time to deal with their stored amount of stock over the time in both years
2018 and 2019 (Annual report of Nufarm limited, 2019).
In the context of day’s debtor turnover, this can inferred that company had taken time of 132
days to recover their debts from debtors. On the other hands, in year 2019 this was of 134 days.
In comparative manner, this can be stated that company had taken more number of days to
Paraphrase This Document
Need a fresh take? Get an instant paraphrase of this document with our AI Paraphraser
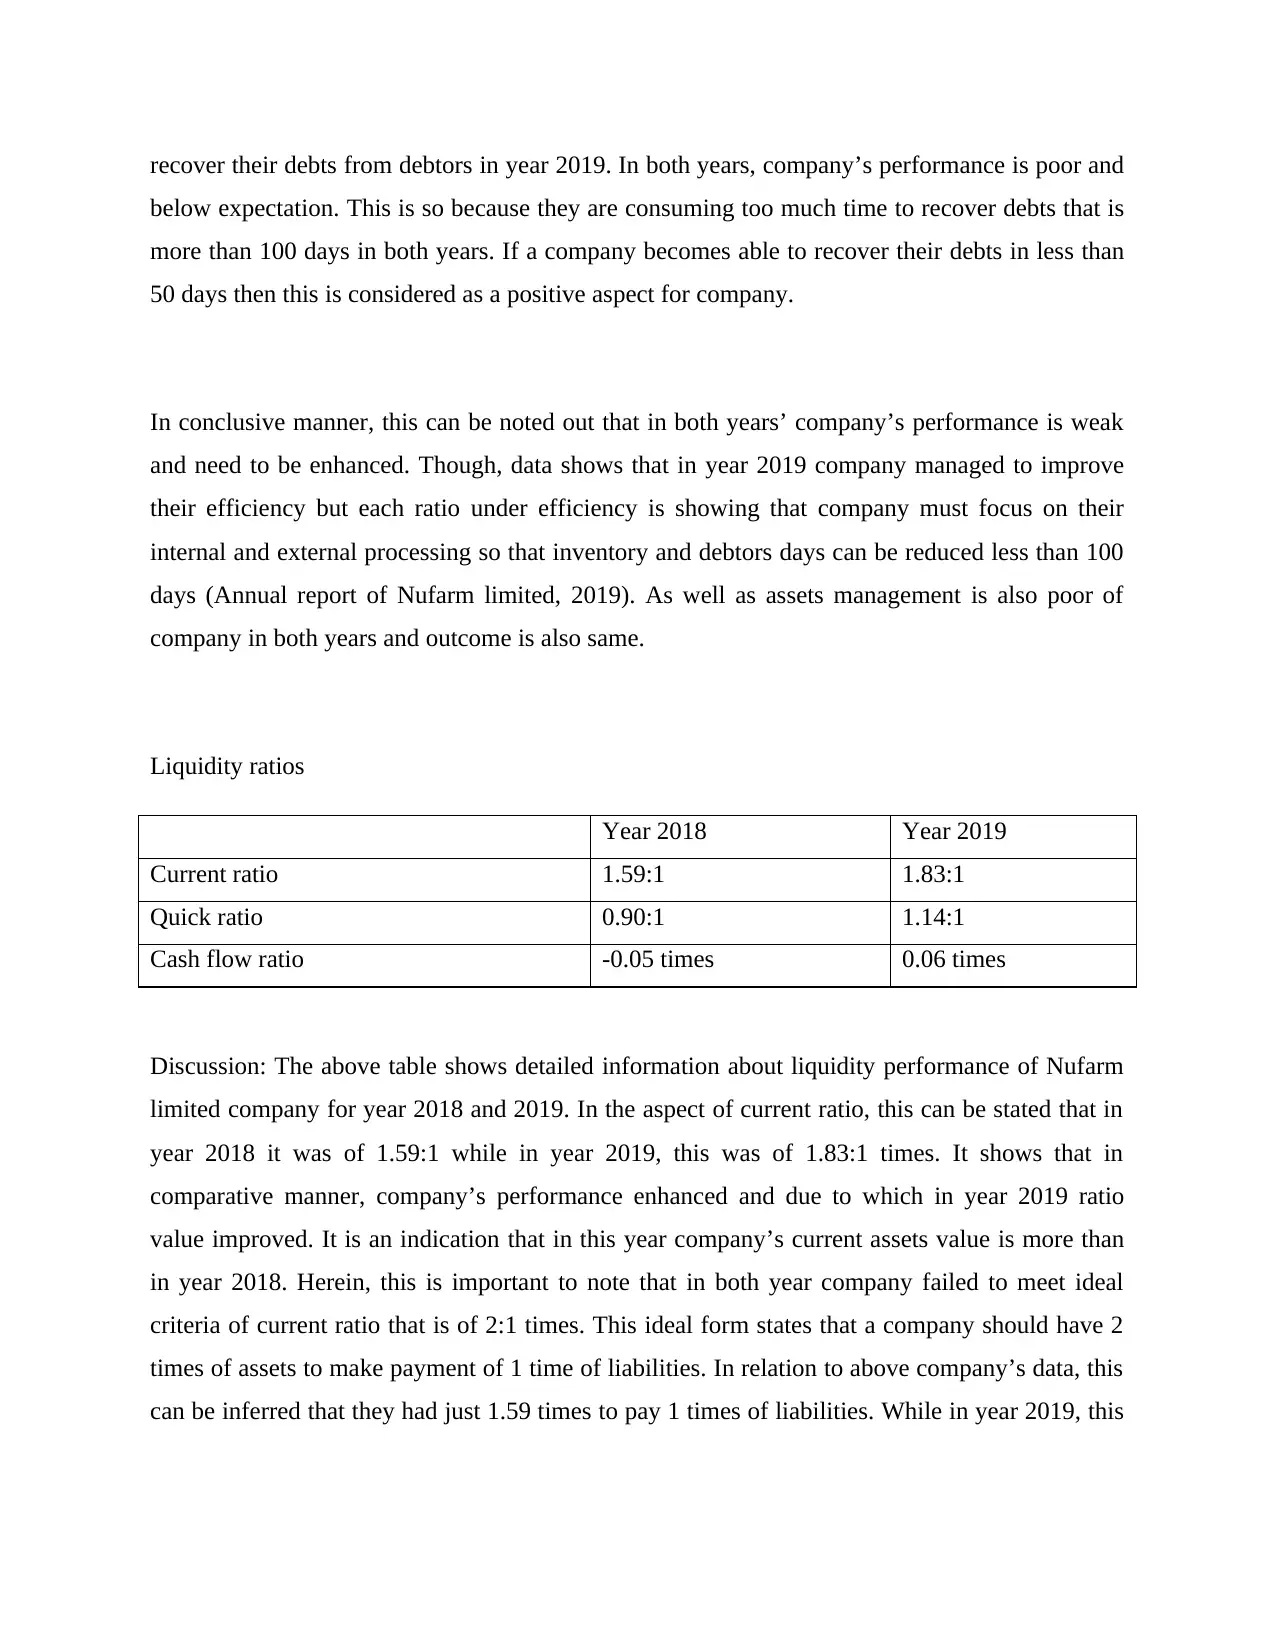
recover their debts from debtors in year 2019. In both years, company’s performance is poor and
below expectation. This is so because they are consuming too much time to recover debts that is
more than 100 days in both years. If a company becomes able to recover their debts in less than
50 days then this is considered as a positive aspect for company.
In conclusive manner, this can be noted out that in both years’ company’s performance is weak
and need to be enhanced. Though, data shows that in year 2019 company managed to improve
their efficiency but each ratio under efficiency is showing that company must focus on their
internal and external processing so that inventory and debtors days can be reduced less than 100
days (Annual report of Nufarm limited, 2019). As well as assets management is also poor of
company in both years and outcome is also same.
Liquidity ratios
Year 2018 Year 2019
Current ratio 1.59:1 1.83:1
Quick ratio 0.90:1 1.14:1
Cash flow ratio -0.05 times 0.06 times
Discussion: The above table shows detailed information about liquidity performance of Nufarm
limited company for year 2018 and 2019. In the aspect of current ratio, this can be stated that in
year 2018 it was of 1.59:1 while in year 2019, this was of 1.83:1 times. It shows that in
comparative manner, company’s performance enhanced and due to which in year 2019 ratio
value improved. It is an indication that in this year company’s current assets value is more than
in year 2018. Herein, this is important to note that in both year company failed to meet ideal
criteria of current ratio that is of 2:1 times. This ideal form states that a company should have 2
times of assets to make payment of 1 time of liabilities. In relation to above company’s data, this
can be inferred that they had just 1.59 times to pay 1 times of liabilities. While in year 2019, this
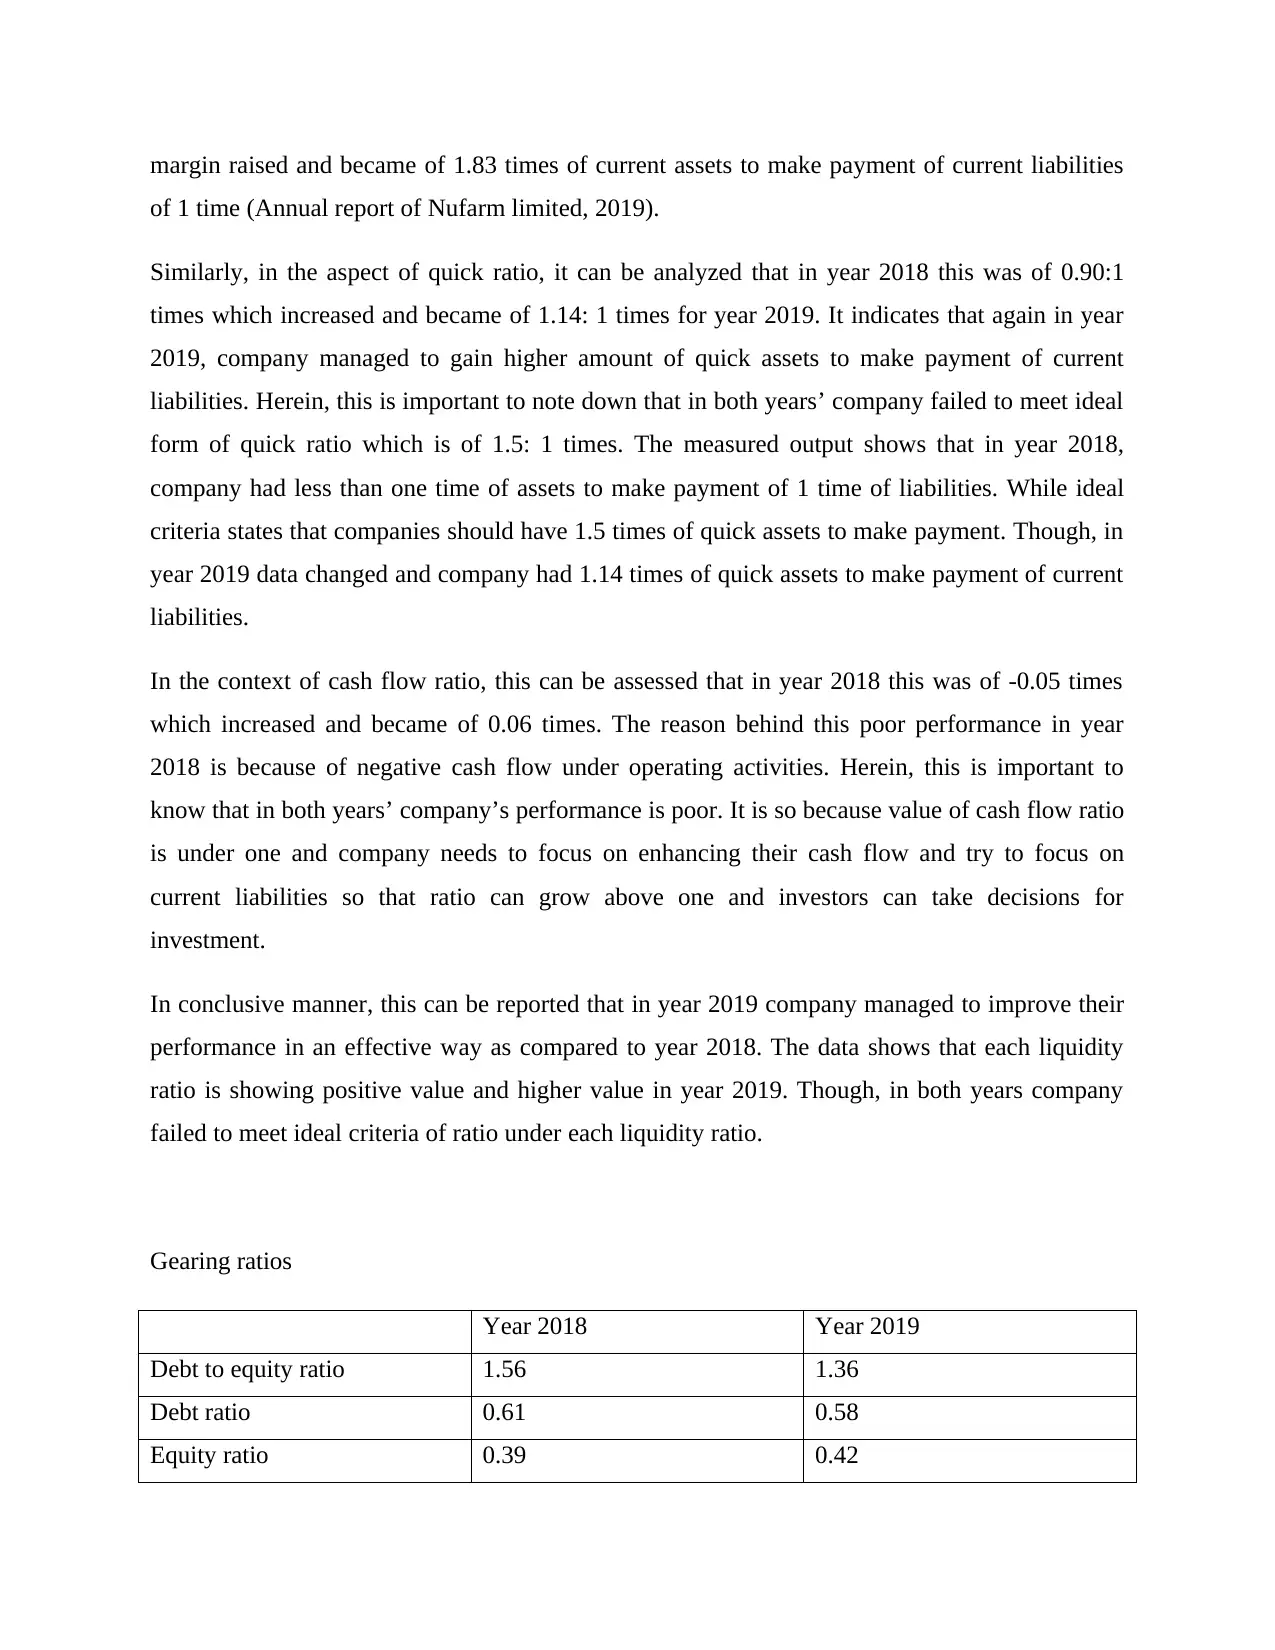
margin raised and became of 1.83 times of current assets to make payment of current liabilities
of 1 time (Annual report of Nufarm limited, 2019).
Similarly, in the aspect of quick ratio, it can be analyzed that in year 2018 this was of 0.90:1
times which increased and became of 1.14: 1 times for year 2019. It indicates that again in year
2019, company managed to gain higher amount of quick assets to make payment of current
liabilities. Herein, this is important to note down that in both years’ company failed to meet ideal
form of quick ratio which is of 1.5: 1 times. The measured output shows that in year 2018,
company had less than one time of assets to make payment of 1 time of liabilities. While ideal
criteria states that companies should have 1.5 times of quick assets to make payment. Though, in
year 2019 data changed and company had 1.14 times of quick assets to make payment of current
liabilities.
In the context of cash flow ratio, this can be assessed that in year 2018 this was of -0.05 times
which increased and became of 0.06 times. The reason behind this poor performance in year
2018 is because of negative cash flow under operating activities. Herein, this is important to
know that in both years’ company’s performance is poor. It is so because value of cash flow ratio
is under one and company needs to focus on enhancing their cash flow and try to focus on
current liabilities so that ratio can grow above one and investors can take decisions for
investment.
In conclusive manner, this can be reported that in year 2019 company managed to improve their
performance in an effective way as compared to year 2018. The data shows that each liquidity
ratio is showing positive value and higher value in year 2019. Though, in both years company
failed to meet ideal criteria of ratio under each liquidity ratio.
Gearing ratios
Year 2018 Year 2019
Debt to equity ratio 1.56 1.36
Debt ratio 0.61 0.58
Equity ratio 0.39 0.42
⊘ This is a preview!⊘
Do you want full access?
Subscribe today to unlock all pages.
Trusted by 1+ million students worldwide
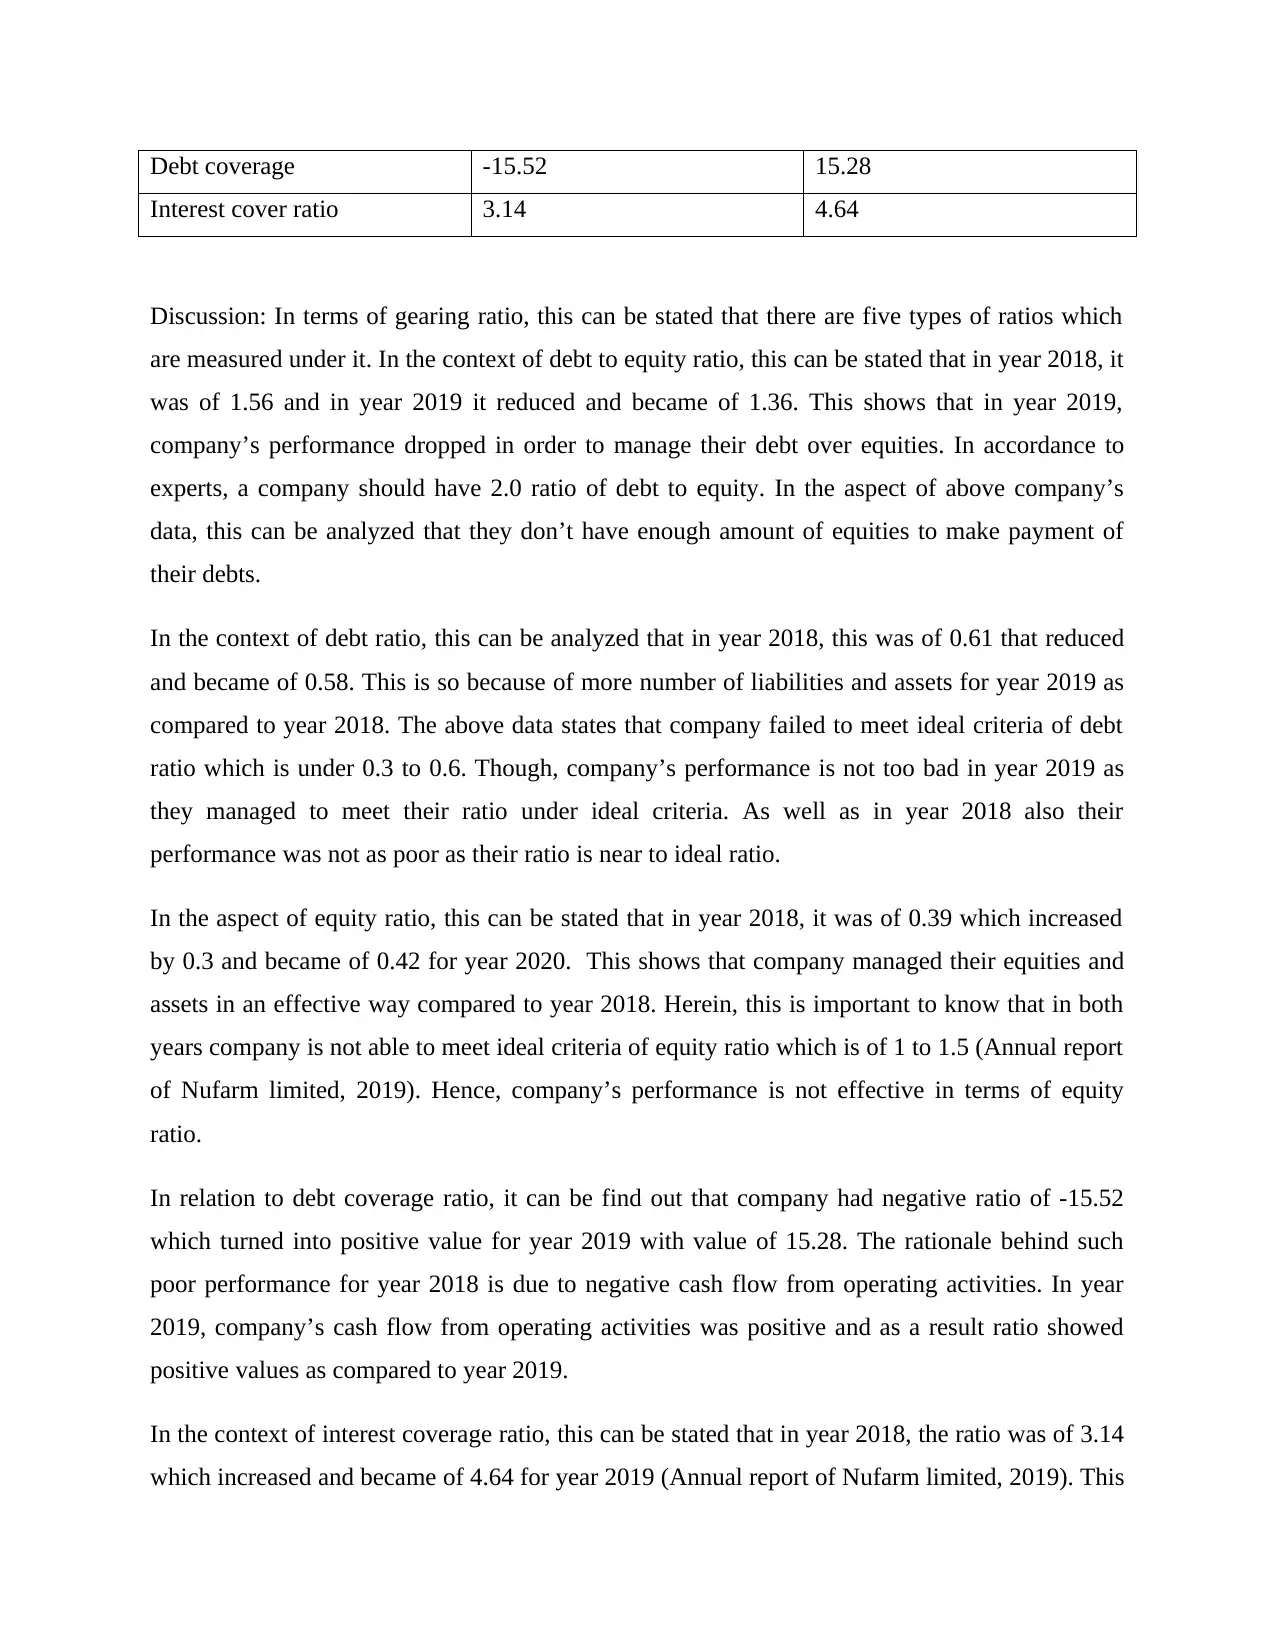
Debt coverage -15.52 15.28
Interest cover ratio 3.14 4.64
Discussion: In terms of gearing ratio, this can be stated that there are five types of ratios which
are measured under it. In the context of debt to equity ratio, this can be stated that in year 2018, it
was of 1.56 and in year 2019 it reduced and became of 1.36. This shows that in year 2019,
company’s performance dropped in order to manage their debt over equities. In accordance to
experts, a company should have 2.0 ratio of debt to equity. In the aspect of above company’s
data, this can be analyzed that they don’t have enough amount of equities to make payment of
their debts.
In the context of debt ratio, this can be analyzed that in year 2018, this was of 0.61 that reduced
and became of 0.58. This is so because of more number of liabilities and assets for year 2019 as
compared to year 2018. The above data states that company failed to meet ideal criteria of debt
ratio which is under 0.3 to 0.6. Though, company’s performance is not too bad in year 2019 as
they managed to meet their ratio under ideal criteria. As well as in year 2018 also their
performance was not as poor as their ratio is near to ideal ratio.
In the aspect of equity ratio, this can be stated that in year 2018, it was of 0.39 which increased
by 0.3 and became of 0.42 for year 2020. This shows that company managed their equities and
assets in an effective way compared to year 2018. Herein, this is important to know that in both
years company is not able to meet ideal criteria of equity ratio which is of 1 to 1.5 (Annual report
of Nufarm limited, 2019). Hence, company’s performance is not effective in terms of equity
ratio.
In relation to debt coverage ratio, it can be find out that company had negative ratio of -15.52
which turned into positive value for year 2019 with value of 15.28. The rationale behind such
poor performance for year 2018 is due to negative cash flow from operating activities. In year
2019, company’s cash flow from operating activities was positive and as a result ratio showed
positive values as compared to year 2019.
In the context of interest coverage ratio, this can be stated that in year 2018, the ratio was of 3.14
which increased and became of 4.64 for year 2019 (Annual report of Nufarm limited, 2019). This
Paraphrase This Document
Need a fresh take? Get an instant paraphrase of this document with our AI Paraphraser
is so because of less number of interest expenses and higher number of earnings before interest
and tax. So in conclusive manner, this can be stated that most of the ratios are showing that
company’s performance is better for year 2019 as compared to year 2018. Though, there are
some ratios which are indicating that company failed to meet ideal criteria of ratios.
RECOMMENDATIONS
Has the reporting year been better than the prior reporting year for the company?
Yes, reporting year has been better than the prior reporting year for the company. This is so
because each ratio including liquidity, profitability, gearing etc. are showing that company
performed better in year 2019 as compared to year 2018.
This is so because under liquidity ratio, it can be analyzed that some ratios like ROE and ROA
were negative for year 2018 which turned into positive for year 2019. As well as efficiency ratio
also improved in an effective manner in year 2019. In terms of liquidity ratio, it can be stated that
each ratio current and quick ratio is higher for year 2019.
Will the company succeed in the future?
In accordance of above analysis, this can be stated that company will succeed in future. It is so
because net profit ratio turned into positive way in 2019 as compared to 2018 and it shows that in
upcoming time period company will grow in upcoming time period.
As well as company’s earnings price per share and share price was also increased in year 2019
compared to year 2018 and it is an indication that in upcoming time company’s market share will
raise and will help in growth.
The likelihood of a merger or acquisition of the company?
On the basis of above data, it can be stated that company should not be acquired by any company
this is so because company’s performance is better in current year 2019 and it is expected that in
future performance will boost.
This is so because like dividend per share, payout ratio, earnings per share etc. are positive in
year 2019 and expected to grow. Hence, Nufarm limited should acquire any small company only
if they need to expand their business otherwise they do not need to be acquired or acquire any
company.
Suggest what should the company be doing help it succeed
There are some ratios which need to be improving by above company. In the aspect of gross
margin company should try to eliminate their cost of sales so that their performance can rise. As
well as company needs to focus on enhancing the way by which their efficiency to collect debt
can improve.
Apart from this, company should focus on liquidity ratios as their ratios are under ideal ratio in
both current and quick ratio.
The impact of the political competitive environment on the business
Nufarm Limited trades in Materials in more than a dozen countries and is subject to various
forms of political climate and threats to the political system (Akbar, Yang and Kanat, 2020). The
goal of achieving success in just such a competitive materials market across different countries is
to broaden the systemic threats of the political climate. Nufarm Limited may carefully examine
the following considerations before entering or participating in a specific market:
Political stability and the significance of the materials sector in the world's economy.
Judicial structure for the execution of contracts.
Defense of intellectual property.
⊘ This is a preview!⊘
Do you want full access?
Subscribe today to unlock all pages.
Trusted by 1+ million students worldwide
1 out of 19
Related Documents


Your All-in-One AI-Powered Toolkit for Academic Success.
+13062052269
info@desklib.com
Available 24*7 on WhatsApp / Email
![[object Object]](/_next/static/media/star-bottom.7253800d.svg)
Unlock your academic potential
Copyright © 2020–2026 A2Z Services. All Rights Reserved. Developed and managed by ZUCOL.