Performance Review: Newcastle United FC Advertisement Strategies
VerifiedAdded on 2022/11/13
|12
|2975
|188
Report
AI Summary
This report undertakes a performance review of the advertisement department of Newcastle United FC, utilizing business intelligence and data analytic systems. It critically appraises the club's advertisement strategies, focusing on the impact of various channels (Facebook, local advertisement, magazine/newspaper, and YouTube) on customer acquisition. The report highlights the development and application of a BI dashboard using MS Excel to visualize key performance indicators (KPIs) such as average customer increase rate and promotion percentage. Through data analysis, the report identifies that YouTube and Facebook are the most effective advertising channels, while local advertisement and magazine/newspaper are less effective. The report recommends that Newcastle United FC should shift its focus to YouTube and Facebook to maximize customer acquisition and advertising ROI, emphasizing the need to move away from less effective channels. The developed dashboard has helped identify the problem in the advertising using local advertisement and magazine/newspaper which only generate less customers as opposed to YouTube and Facebook that have greater potential to increase customers. It is recommended that the Club should focus its advertisement on YouTube and Facebook.
Running head: NEWCASTLE UNITED FOOTBALL CLUB (FC) PERFORMANCE REVIEW 1
Newcastle United Football Club (FC) performance review
Name
Institutional Affiliation
Newcastle United Football Club (FC) performance review
Name
Institutional Affiliation
Paraphrase This Document
Need a fresh take? Get an instant paraphrase of this document with our AI Paraphraser
NEWCASTLE UNITED FOOTBALL CLUB (FC) PERFORMANCE REVIEW 2
NEWCASTLE UNITED FOOTBALL CLUB (FC) PERFORMANCE REVIEW
Executive Summary
The report has shown that Newcastle United FC has the great opportunity to enhance its
advertisement by using the business intelligence dashboard. The dashboard has helped identify
the problem in the advertising using local advertisement and magazine/newspaper which only
generate less customers as opposed to YouTube and Facebook that have greater potential to
increase customers. It is recommended that the Club should focus its advertisement on YouTube
and Facebook.
NEWCASTLE UNITED FOOTBALL CLUB (FC) PERFORMANCE REVIEW 3
Table of Contents
Executive Summary.........................................................................................................................2
Introduction......................................................................................................................................3
Theory Linking Problem/Opportunity Statement............................................................................4
Knowledge of Key BI/DA Systems.................................................................................................5
Figure 1: Developed MS Dashboard............................................................................................5
Critical Analysis and Justification of Developed Dashboard..........................................................7
Conclusion and Recommendation...................................................................................................9
References......................................................................................................................................11
Introduction
⊘ This is a preview!⊘
Do you want full access?
Subscribe today to unlock all pages.
Trusted by 1+ million students worldwide
NEWCASTLE UNITED FOOTBALL CLUB (FC) PERFORMANCE REVIEW 4
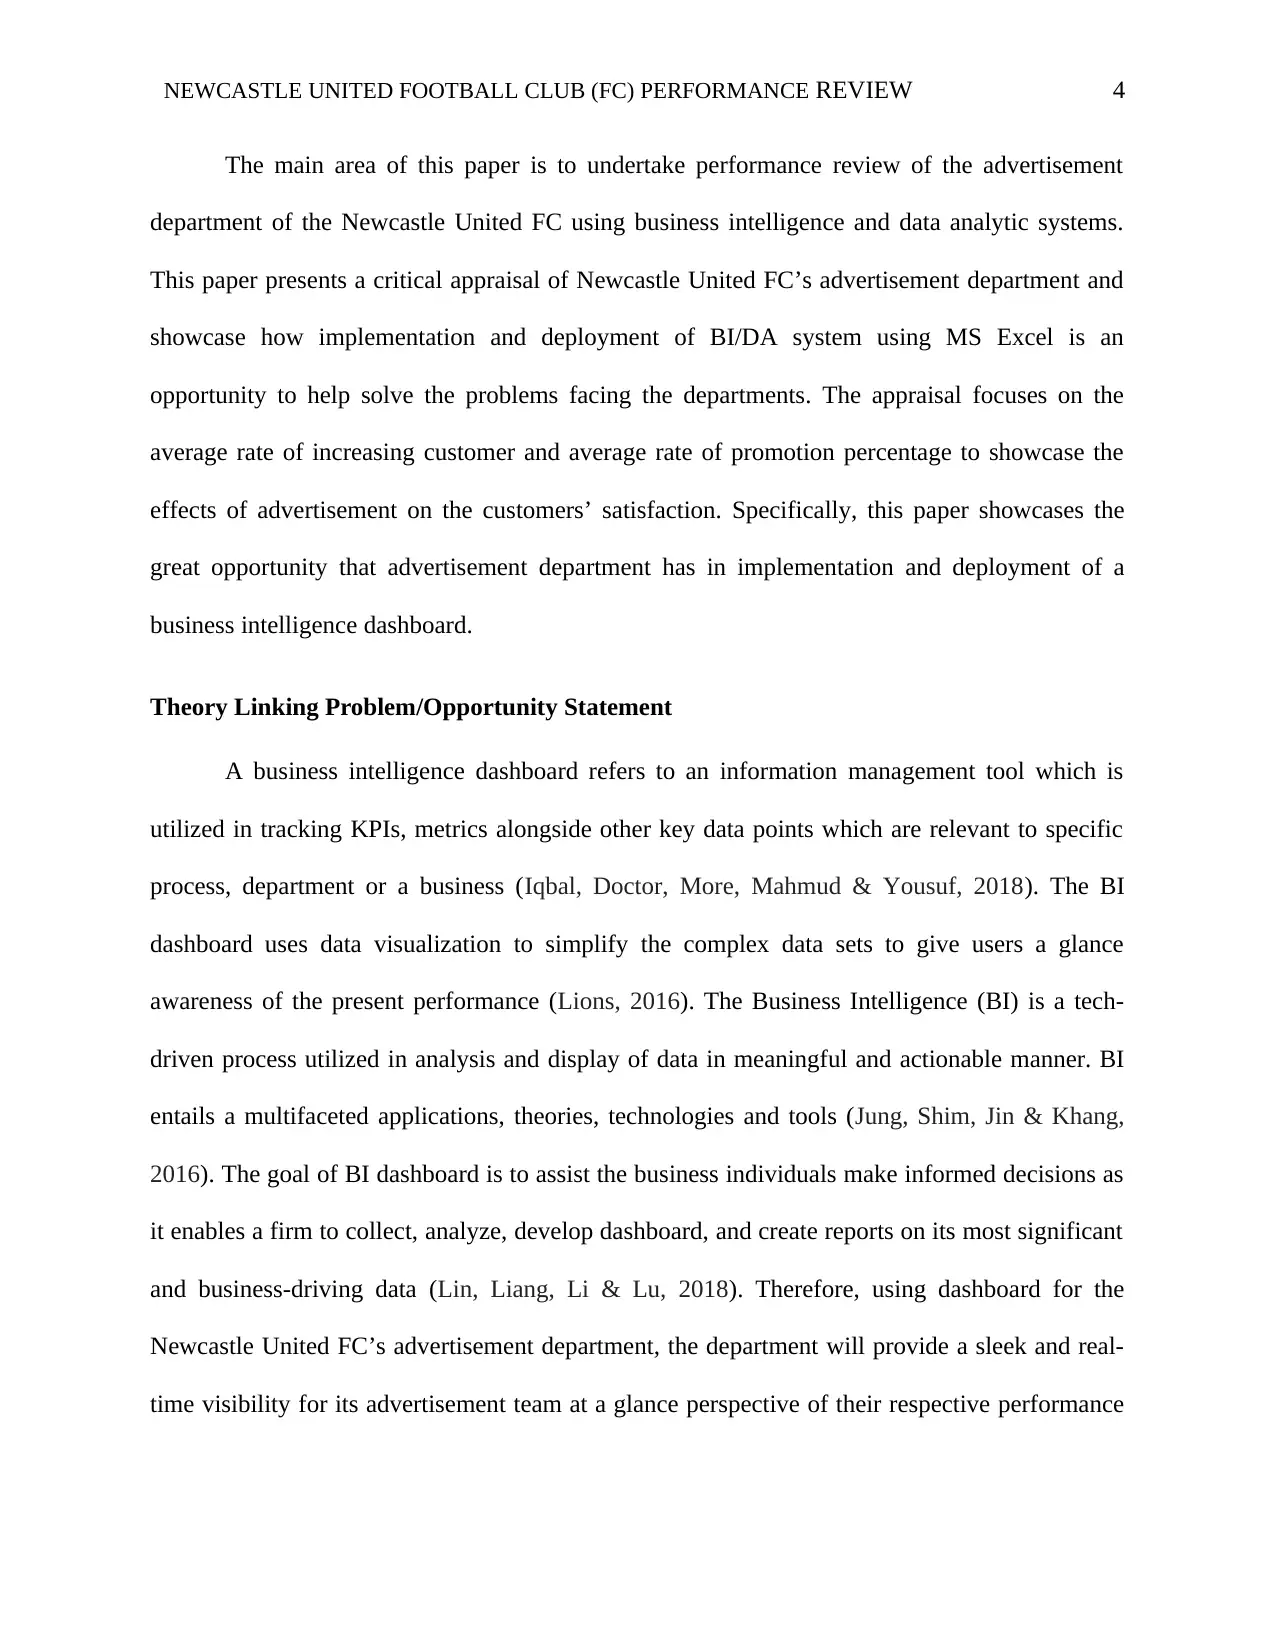
The main area of this paper is to undertake performance review of the advertisement
department of the Newcastle United FC using business intelligence and data analytic systems.
This paper presents a critical appraisal of Newcastle United FC’s advertisement department and
showcase how implementation and deployment of BI/DA system using MS Excel is an
opportunity to help solve the problems facing the departments. The appraisal focuses on the
average rate of increasing customer and average rate of promotion percentage to showcase the
effects of advertisement on the customers’ satisfaction. Specifically, this paper showcases the
great opportunity that advertisement department has in implementation and deployment of a
business intelligence dashboard.
Theory Linking Problem/Opportunity Statement
A business intelligence dashboard refers to an information management tool which is
utilized in tracking KPIs, metrics alongside other key data points which are relevant to specific
process, department or a business (Iqbal, Doctor, More, Mahmud & Yousuf, 2018). The BI
dashboard uses data visualization to simplify the complex data sets to give users a glance
awareness of the present performance (Lions, 2016). The Business Intelligence (BI) is a tech-
driven process utilized in analysis and display of data in meaningful and actionable manner. BI
entails a multifaceted applications, theories, technologies and tools (Jung, Shim, Jin & Khang,
2016). The goal of BI dashboard is to assist the business individuals make informed decisions as
it enables a firm to collect, analyze, develop dashboard, and create reports on its most significant
and business-driving data (Lin, Liang, Li & Lu, 2018). Therefore, using dashboard for the
Newcastle United FC’s advertisement department, the department will provide a sleek and real-
time visibility for its advertisement team at a glance perspective of their respective performance
Paraphrase This Document
Need a fresh take? Get an instant paraphrase of this document with our AI Paraphraser
NEWCASTLE UNITED FOOTBALL CLUB (FC) PERFORMANCE REVIEW 5
that need to seamlessly run (Listiyoko, Ardi & Maksum, 2018). This demonstrates the need for
BI dashboard in the Newcastle United FC.
Knowledge of Key BI/DA Systems
The BI system that has been in this critical appraisal is the BI dashboard as seen in figure
1 below.
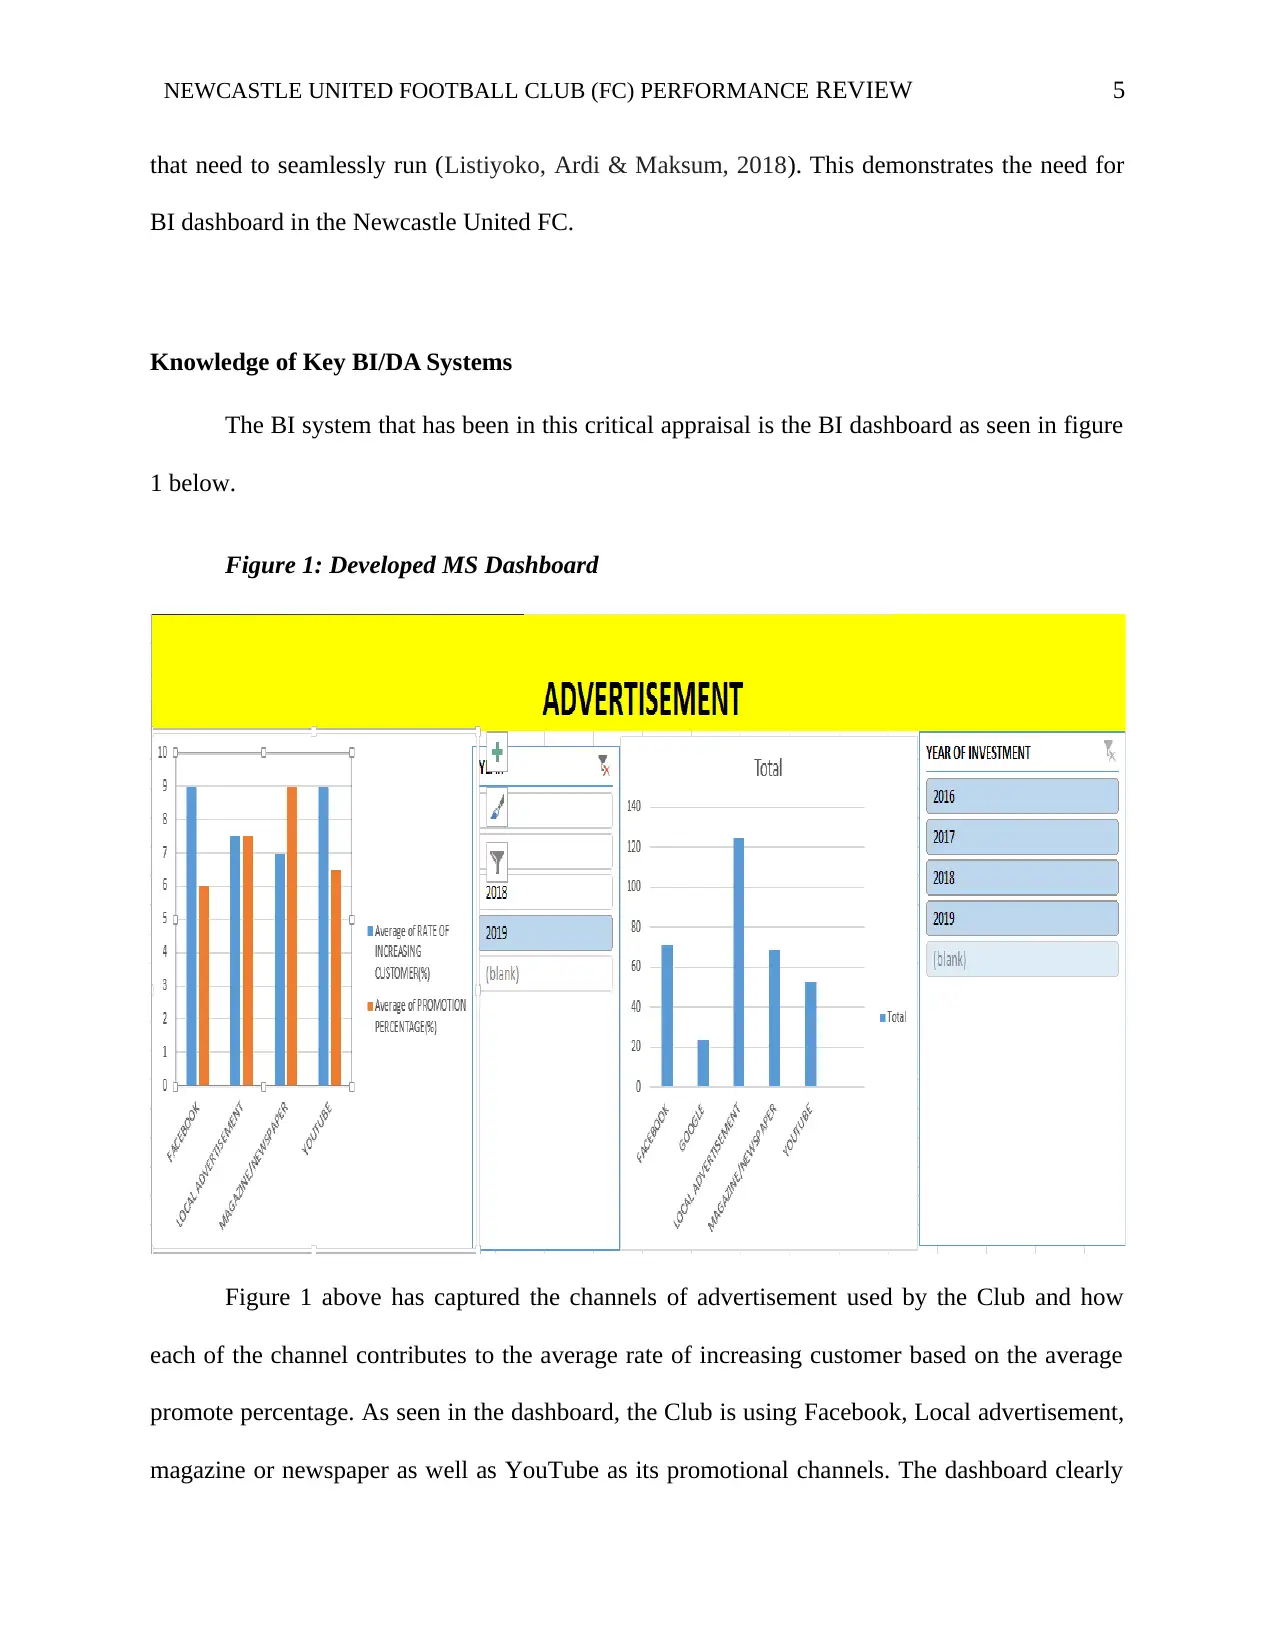
Figure 1: Developed MS Dashboard
Figure 1 above has captured the channels of advertisement used by the Club and how
each of the channel contributes to the average rate of increasing customer based on the average
promote percentage. As seen in the dashboard, the Club is using Facebook, Local advertisement,
magazine or newspaper as well as YouTube as its promotional channels. The dashboard clearly
that need to seamlessly run (Listiyoko, Ardi & Maksum, 2018). This demonstrates the need for
BI dashboard in the Newcastle United FC.
Knowledge of Key BI/DA Systems
The BI system that has been in this critical appraisal is the BI dashboard as seen in figure
1 below.
Figure 1: Developed MS Dashboard
Figure 1 above has captured the channels of advertisement used by the Club and how
each of the channel contributes to the average rate of increasing customer based on the average
promote percentage. As seen in the dashboard, the Club is using Facebook, Local advertisement,
magazine or newspaper as well as YouTube as its promotional channels. The dashboard clearly
NEWCASTLE UNITED FOOTBALL CLUB (FC) PERFORMANCE REVIEW 6
gives the overview at a glance of how each of the channels contributes to customer increase and
the percentage of promotion. The dashboard also shows the total number of advertisements that
were run in each channel. In this respect, we can clearly show that the local advertisement had
the highest number across the years and Google being the least. The number or total of the
advertisement are Facebook (71), Google (24), Local Advertisement (125),
Magazine/Newspaper (69) and YouTube (53). This information is useful in determining the
contribution of each media on the ability to increase the customers for the Club.
In respect of Facebook, it leads to more average customers with only less average
promotion investment. For example, Facebook has brought 9% rate of increasing customers
when only 6% average promotion is used. This implies that the dashboard helps the team see
how Facebook performed in a visualize manner by comparing its contribution to the customer
influx and the amount of promotional investment injected (Spruit & Lammertink 2018). From
the figure above, it can be concluded that Facebook advertisement is profitable to the Club.
In regards to Local Advertisement, we can use the dashboard to observe at a glance the
impact of this channel on rate of increasing customer and the average rate of promotion. It can be
seen that as both rates were at one level (around 7.5%). This means that local advertisement is
never as effective as Facebook as it will require as much investment as its rate of increasing
customer (Gounder, Iyer & Al Mazyad, 2016).
In regards to magazine or newspaper advertisement, we need more average rate of
promotion (9%) to realize only a few increase in customer average rate (7%). This means that it
is an ineffective promotional channel (Thamir & Poulis, 2015).
⊘ This is a preview!⊘
Do you want full access?
Subscribe today to unlock all pages.
Trusted by 1+ million students worldwide
NEWCASTLE UNITED FOOTBALL CLUB (FC) PERFORMANCE REVIEW 7
In terms of YouTube, the average rate of promotion (6.5%) is much less than the average
rate of increasing customer (9%). This means that YouTube is effective channel of promotion
since it only requires less investment to yield much desired results.
We can thus rank the effectiveness of these channels of promotion best on their
performance based on the two metrics or KPIs. The best strategy to be implemented in the Club
is YouTube, followed by Facebook, Local advertisement and then lastly Magazine or
Newspapers. We can clearly see that the dashboard visualizes this information and makes it easy
for the team to see the performance of each of the channels of promotion. It is clear that the Club
should its advertisement using the digital technologies presented in this case by the two virtual
communities (YouTube and Facebook) to ensure more customers yet at low costs.
Critical Analysis and Justification of Developed Dashboard
The developed dashboard was effective in this case. The choice to analyze the
contribution of each of the promotional channels used by the Club to market its services and
products was effective. This is because it was the basis upon which they could come up with the
best channels of promotion that will lead to increased sales and hence profitability.
By showing the average rate of increasing customers against the average rate of
promotion, it helps us known the effectiveness of each promotional strategy or channels. This
informs the Club on how it can maximize on its advertisement which still proves cost-effective.
For instance, it has been demonstrated in the dashboard that we require to undertake more
frequent promotions or advertisement in the magazines and newspapers, yet the customers still
do not influx commensurate to the efforts. Such a realization is useful in this case since will help
in decision making. Specifically, it will help the team know that such a strategy should be
abandoned as it is cost-ineffective and does not help the Club.
Paraphrase This Document
Need a fresh take? Get an instant paraphrase of this document with our AI Paraphraser
NEWCASTLE UNITED FOOTBALL CLUB (FC) PERFORMANCE REVIEW 8
Similarly, the developed dashboard helps shows clearly that for the local advertisement to
draw in customers, it must be frequently done, but the result stay minute since we have to run it
as much as we require the benefits. Simply put, it appears that the cost of advertising via this
local advertisement is equal to the revenue generated and this means that there would be no
profit. Such information is then used by the team to reject the advertisement via the local
advertisement channel. This is another area that demonstrates the benefits of using the
dashboard. This is because the dashboard has helped us show that it would be expensive for the
Club to continue running frequent local advertisement when indeed the outcomes are not
promising. From the dashboard, it is clear that more local advertisement were done than any
other channel to promote that product and yet, the average rate of increasing customers stood
lower than YouTube and Facebook. This justifies the need for the Club to use the dashboard to
inform the performance of its strategies of advertising.
Further, we can determine from the dashboard that Club stands to benefit more by
focusing on the YouTube and Facebook channels to promote its products and services. By
visualizing the average rate of promotion and average rate of increasing customers, the
dashboard makes it easy to see at a glance that Facebook and YouTube are the preferred
channels of promotion. These are digital technologies that have been used to help gather big data
about what the customers need and hence help tailor the products to the clients. Moreover,
customers like it when the club uses these media in advertising as they are interactive in nature
and can help customers communicate with the Club advertise team in real-time basis to have
their issues with the services and products addressed instantly (Dwivedi, Kapoor & Chen, 2015).
The developed dashboard reveals that it can help simplify the complex issues which can
then be easily interpreted by comparing the bars. By showing the totals of the advertisement ran
NEWCASTLE UNITED FOOTBALL CLUB (FC) PERFORMANCE REVIEW 9
per each media across the years, we can easily determine the investment put into each media and
then compared it against the outcome which is the average rate of increasing customer. While
this can be complex in absence of the visualized dashboard, it increasingly becomes simple when
the dashboard has been developed. This has helped us demonstrate that despite being the least in
terms of the number of advertisement, YouTube still proved to be the highest contributor of the
customers’ influx into the Club. This then helps us deduce that it is the best promotional channel
that should be used by the Club to advertise its products and services.
From the developed dashboard, we can demonstrate that the Club has been putting more
emphasis on ineffective advertising strategies or media. This is demonstrated from the totals
which show that local advertisement and magazine/newspapers have been the preferred media of
advertisement despite their trivial outcomes in terms of ability to bring in many customers.
Therefore, dashboard can be said to simplify the complex issues which can then easily be
understood by the advertisement team to change their advertisement strategies for more benefits
(Chmiel, Hiltz-Laforge, Pourshahid & Watts, 2016).
Conclusion and Recommendation
From the preceding sections, it has been demonstrated that dashboard is a useful tool that
will greatly benefit the Club in improving its advertisement outcomes. A justification has been
shown in the previous section for the need of dashboard in the Club’s advertisement team. The
current challenges in advertising and the opportunities available to address the problem have
been highlighted. First, the appraisal has shown that the Club is currently using ineffective media
to advertise and hence the need for change.
It has been revealed that significant emphasis has been placed on advertising through
local advertisement and magazines/newspapers and yet they contribute less in terms of attracting
⊘ This is a preview!⊘
Do you want full access?
Subscribe today to unlock all pages.
Trusted by 1+ million students worldwide
NEWCASTLE UNITED FOOTBALL CLUB (FC) PERFORMANCE REVIEW 10
more customers to the Club. The analysis has since established that advertising through YouTube
is the most-effective followed by Facebook. This has been demonstrated from their greatest
potential to drawn in many customers to the Club in terms of average rate of increasing
customers and average rate of promotion given in percentages.
It is, therefore, recommended that the Newcastle United Football Club should shift its
attention to advertise more using YouTube and Facebook and move away from the ineffective
magazine/newspaper and local advertisement that have been use across the years. In terms of
Facebook and YouTube, much emphasis should be on YouTube since it has been the best
promotional media (Dedić & Stanier, 2016). This is because many brands are increasingly
spending their advertising on YouTube ads. YouTube allows conversations that consistently
outstrips those of other social media sites like Facebook. This is due to high rate of conversation
on YouTube (Chiang & Hsiao, 2015). Moreover, YouTube video ads remain unbelievably cost-
effective in regards to traffic-generation (Hayes, King & Ramirez Jr, 2016).
The Club should also use Facebook but ensure it is a good fit by always testing novel
marketing channels, specifically prior to demand driving up the prices. The Club need to focus
on making the ads more like display as opposed to search ads. The aim is to generate demand
rather than fulfil the demand (Breedvelt-Schouten, 2016). The Club should use low-friction
conversation which acts users to sign up rather than buying. This is because Facebook users stay
fickle and probably to click back to Facebook when as for huge commitment (buying) up front.
Thus, the advertisement team should stick to simple conversations including signing up for the
service, filling out at the short-lead form, and submitting the email address (Balakrishnan &
Manickavasagam, 2017).
Paraphrase This Document
Need a fresh take? Get an instant paraphrase of this document with our AI Paraphraser
NEWCASTLE UNITED FOOTBALL CLUB (FC) PERFORMANCE REVIEW 11
References
Balakrishnan, J., & Manickavasagam, J. (2017). User Disposition and Attitude towards
Advertisements Placed in Facebook, LinkedIn, Twitter and YouTube: A Decision Tree
and MANOVA Approach. In Advertising and Branding: Concepts, Methodologies,
Tools, and Applications (pp. 1512-1532). IGI Global.
Breedvelt-Schouten, I. M. (2016). U.S. Patent No. 9,240,061. Washington, DC: U.S. Patent and
Trademark Office.
Chiang, H. S., & Hsiao, K. L. (2015). YouTube stickiness: the needs, personal, and
environmental perspective. Internet Research, 25(1), 85-106.
Chmiel, M. S., Hiltz-Laforge, J., Pourshahid, A., & Watts, G. A. (2016). U.S. Patent No.
9,285,960. Washington, DC: U.S. Patent and Trademark Office.
Dedić, N., & Stanier, C. (2016, December). Measuring the success of changes to existing
business intelligence solutions to improve business intelligence reporting.
In International Conference on Research and Practical Issues of Enterprise Information
Systems (pp. 225-236). Springer, Cham.
Dwivedi, Y. K., Kapoor, K. K., & Chen, H. (2015). Social media marketing and advertising. The
Marketing Review, 15(3), 289-309.
Gounder, M. S., Iyer, V. V., & Al Mazyad, A. (2016, March). A survey on business intelligence
tools for university dashboard development. In 2016 3rd MEC International Conference
on Big Data and Smart City (ICBDSC) (pp. 1-7). IEEE.
Hayes, J. L., King, K. W., & Ramirez Jr, A. (2016). Brands, friends, & viral advertising: a social
exchange perspective on the ad referral processes. Journal of Interactive Marketing, 36,
31-45.
NEWCASTLE UNITED FOOTBALL CLUB (FC) PERFORMANCE REVIEW 12
Iqbal, R., Doctor, F., More, B., Mahmud, S., & Yousuf, U. (2018). Big data analytics:
Computational intelligence techniques and application areas. Technological Forecasting
and Social Change.
Jung, J., Shim, S. W., Jin, H. S., & Khang, H. (2016). Factors affecting attitudes and behavioural
intention towards social networking advertising: a case of Facebook users in South
Korea. International journal of Advertising, 35(2), 248-265.
Lin, C. Y., Liang, F. W., Li, S. T., & Lu, T. H. (2018). 5S Dashboard Design Principles For Self-
service Business Intelligence Tool Users. Journal of Big Data Research, 1(1), 5.
Lions, P. (2016). U.S. Patent No. 9,275,122. Washington, DC: U.S. Patent and Trademark
Office.
Listiyoko, L., Ardi, R. A., & Maksum, A. (2018). Implementasi Live Dashboard Dalam
Pengembangan Business Intelligence Pada E-Learning Stmik Muhammadiyah
Banten. SEMNASTEKNOMEDIA ONLINE, 6(1), 2-10.
Spruit, M., & Lammertink, M. (2018). Effective and efficient business intelligence dashboard
design: Gestalt theory in Dutch long-term and chronic healthcare. In Applying Big Data
Analytics in Bioinformatics and Medicine (pp. 243-271). IGI Global.
Thamir, A., & Poulis, E. (2015). Business intelligence capabilities and implementation
strategies. International Journal of Global Business, 8(1), 34.
⊘ This is a preview!⊘
Do you want full access?
Subscribe today to unlock all pages.
Trusted by 1+ million students worldwide
1 out of 12
Related Documents


Your All-in-One AI-Powered Toolkit for Academic Success.
+13062052269
info@desklib.com
Available 24*7 on WhatsApp / Email
![[object Object]](/_next/static/media/star-bottom.7253800d.svg)
Unlock your academic potential
Copyright © 2020–2026 A2Z Services. All Rights Reserved. Developed and managed by ZUCOL.