Data Analysis and Forecasting - Numeracy & Data Analysis, LSC
VerifiedAdded on 2023/06/10
|8
|696
|385
Homework Assignment
AI Summary
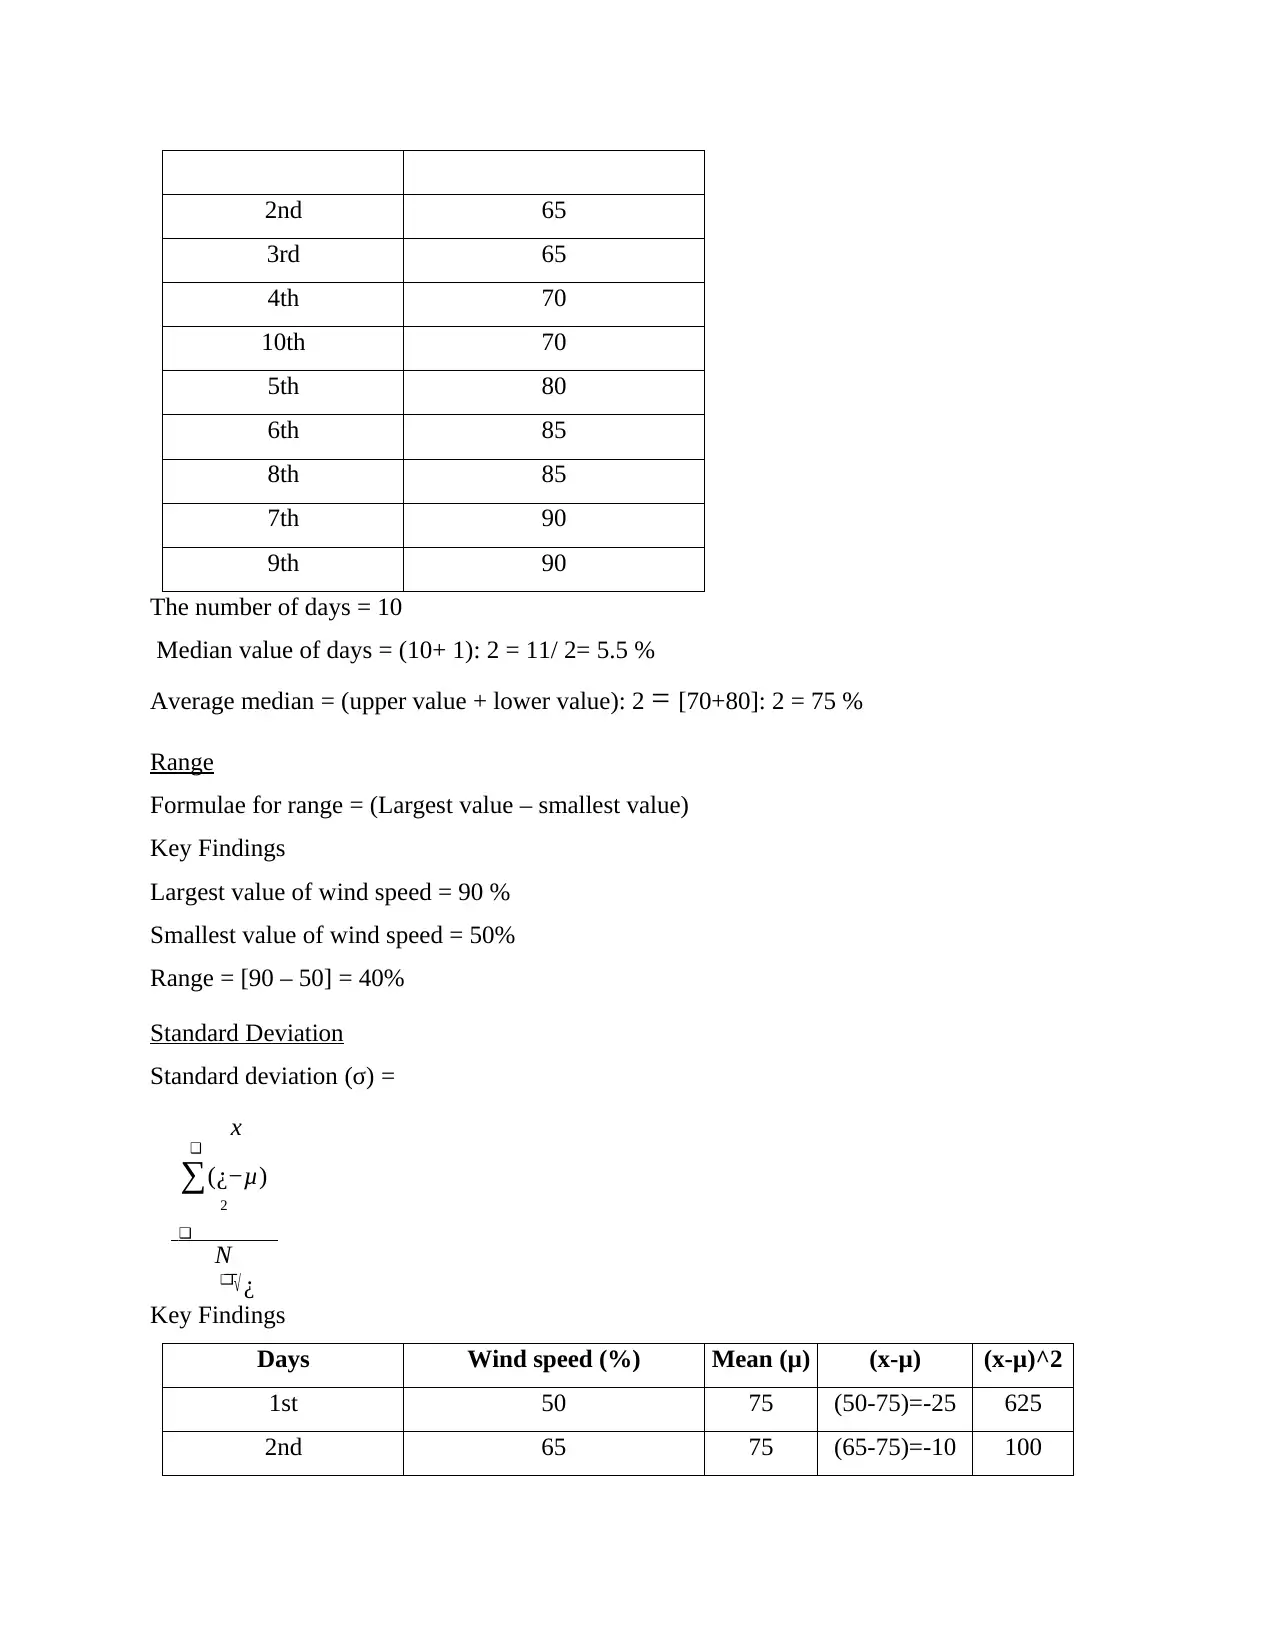
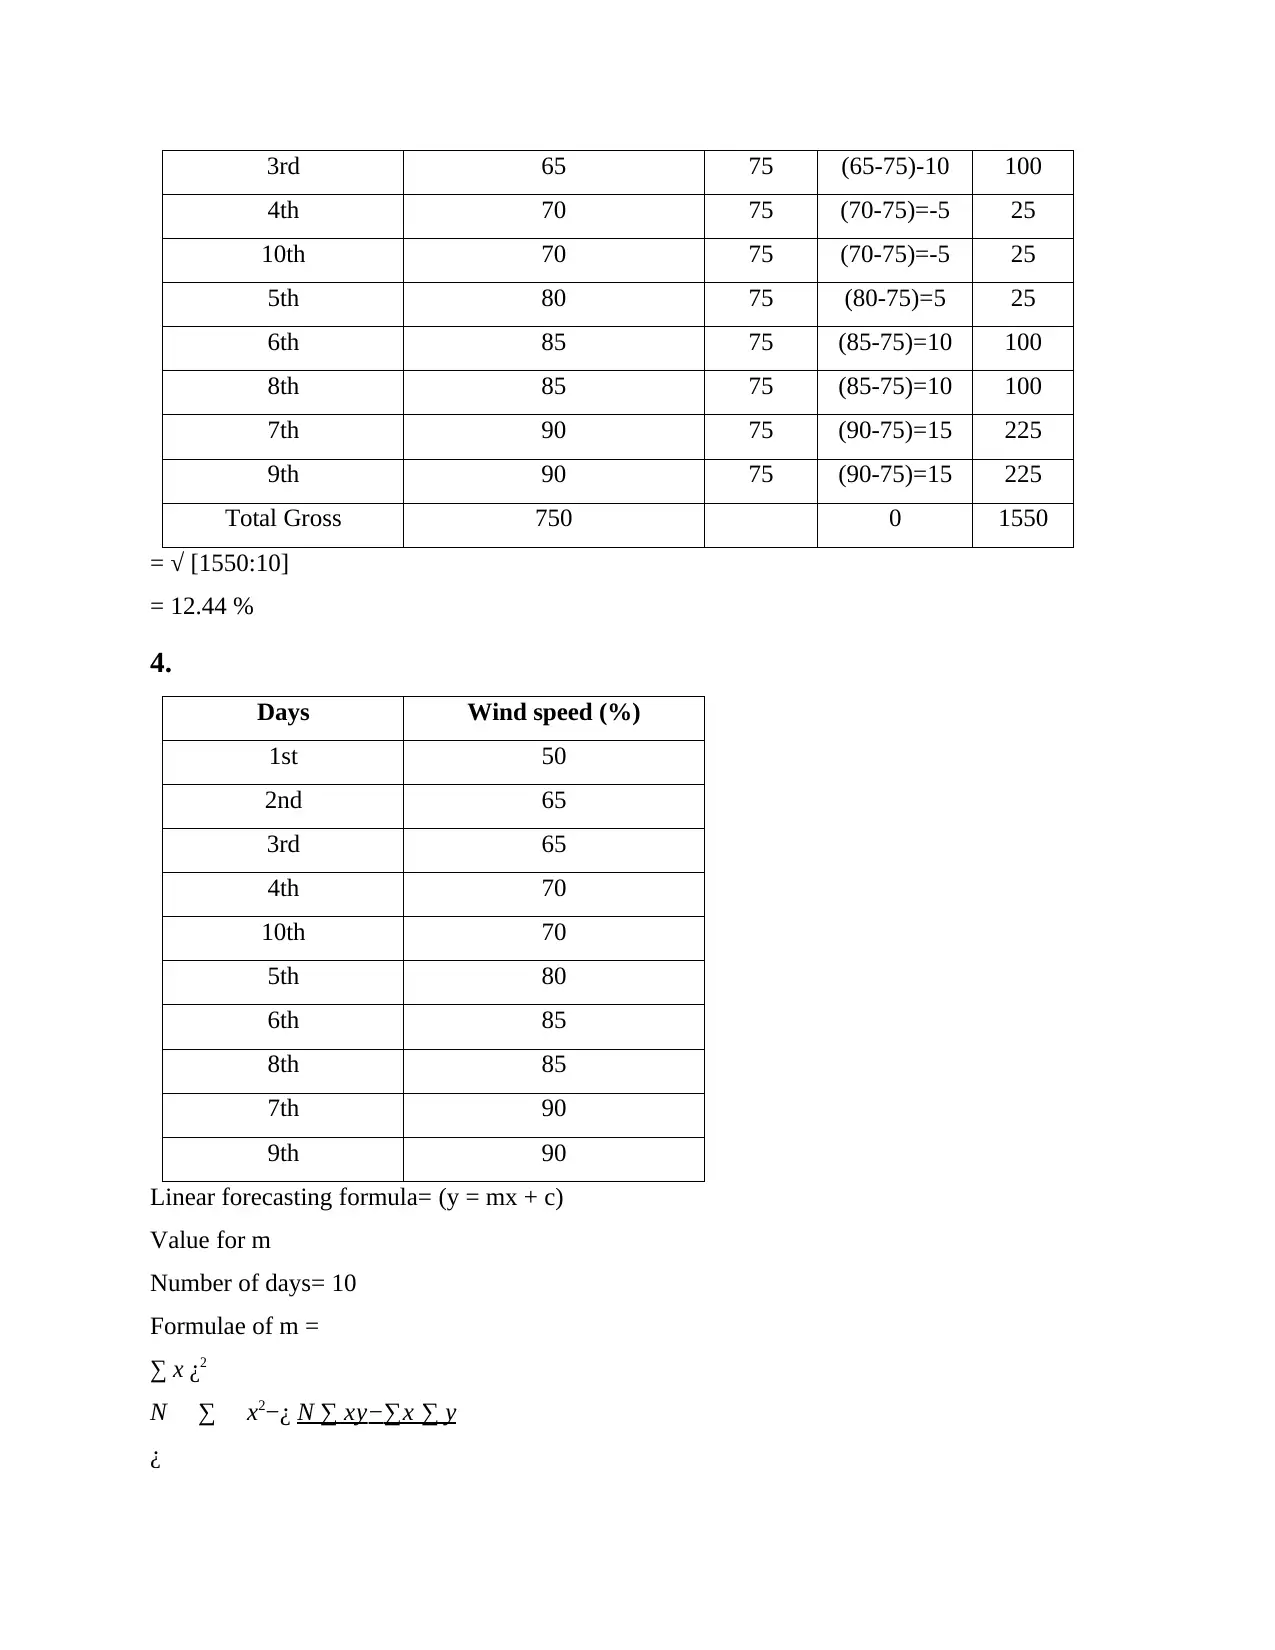
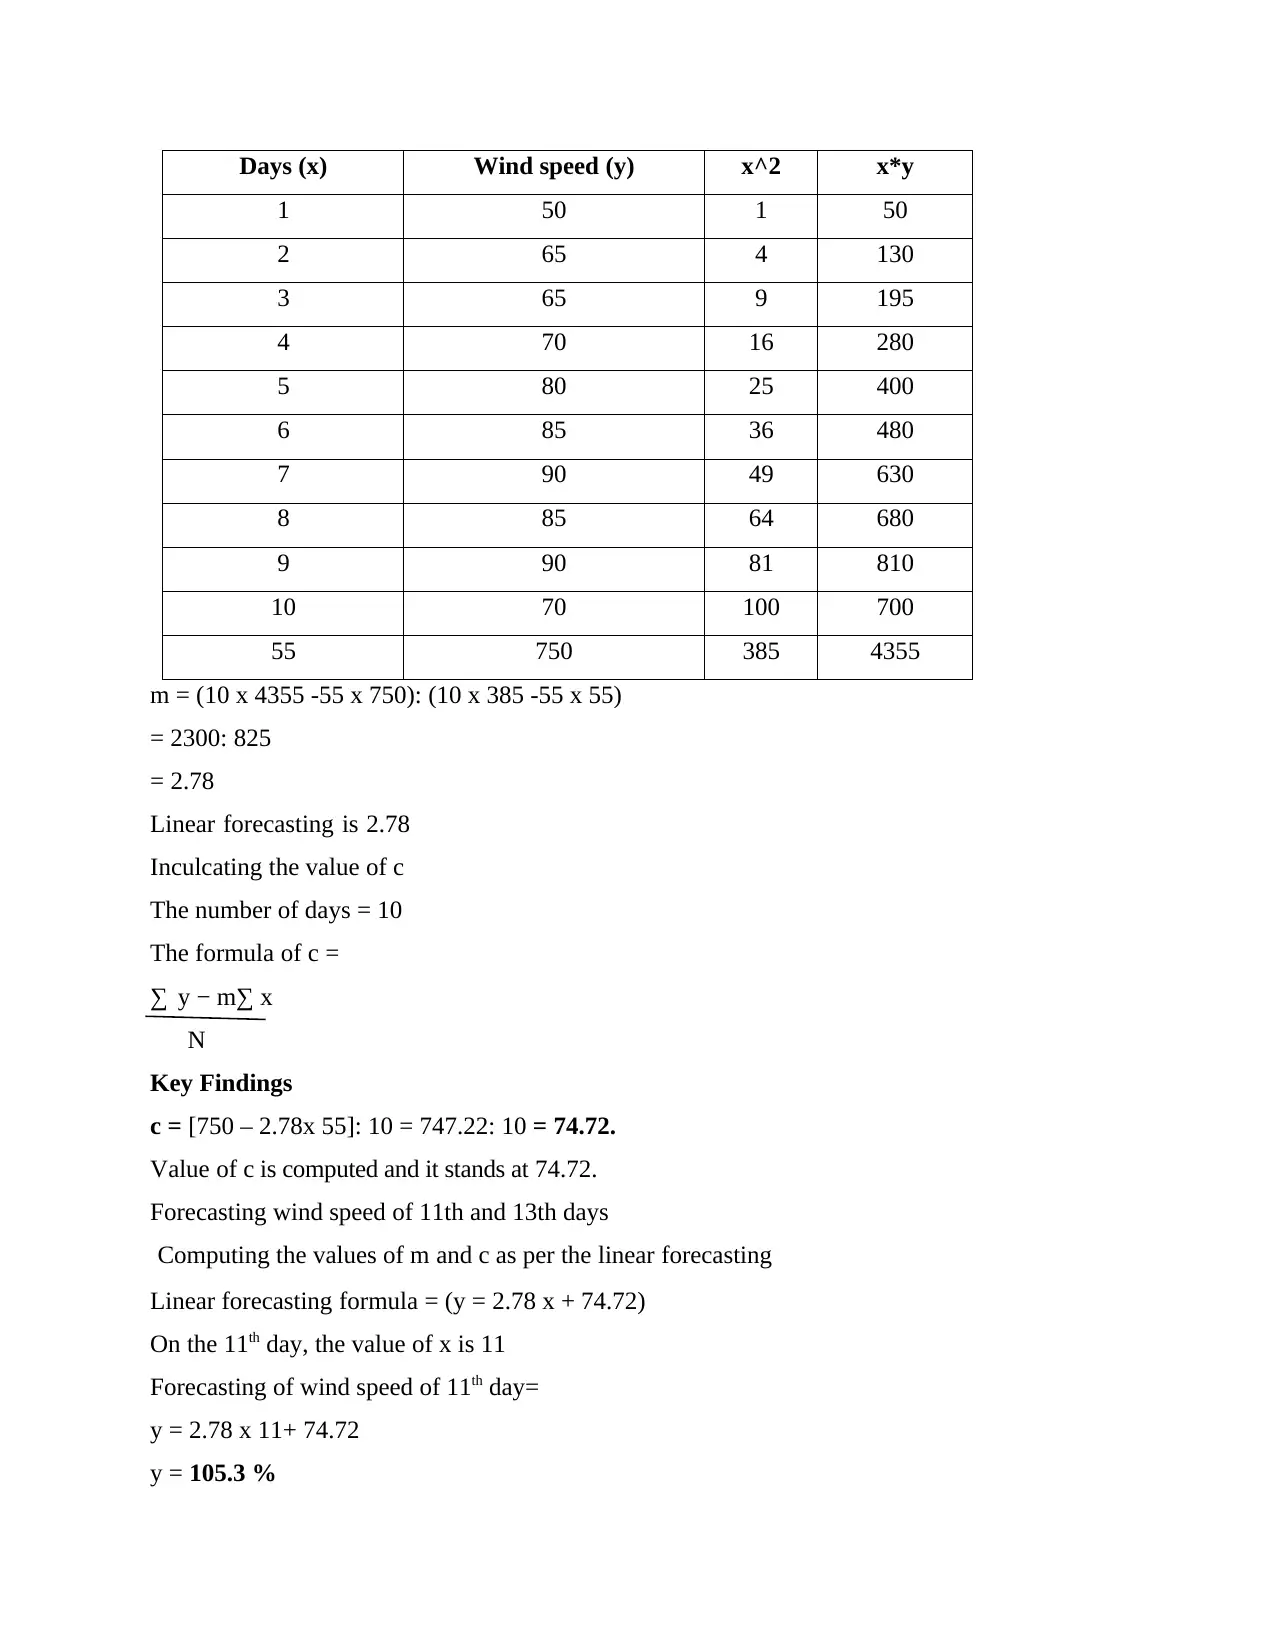
This assignment solution focuses on data analysis and forecasting, specifically addressing the concepts of mean, mode, median, range, and standard deviation. The solution includes calculations and interpretations based on a given dataset of wind speeds over ten days. Furthermore, it applies linear forecasting to predict wind speeds for the 11th and 13th days, demonstrating the application of statistical techniques to real-world scenarios. The assignment utilizes formulas for each statistical measure and presents the findings in a clear and organized manner. This document is available on Desklib, a platform offering a wide range of study resources including past papers and solved assignments.

Data Analysis and
Forecasting
Forecasting
Paraphrase This Document
Need a fresh take? Get an instant paraphrase of this document with our AI Paraphraser

Contents
Contents...........................................................................................................................................2
1.......................................................................................................................................................1
2.......................................................................................................................................................1
3.......................................................................................................................................................2
Mean............................................................................................................................................2
Mode............................................................................................................................................2
Median.........................................................................................................................................2
Range...........................................................................................................................................3
Standard Deviation......................................................................................................................3
4.......................................................................................................................................................4

1.
Days Wind speed
1st 50
2nd 65
3rd 65
4th 70
5th 80
6th 85
7th 90
8th 85
9th 90
10th 70
Total Gross 750
2.
3D column chart-
3D bar chart-
Days Wind speed
1st 50
2nd 65
3rd 65
4th 70
5th 80
6th 85
7th 90
8th 85
9th 90
10th 70
Total Gross 750
2.
3D column chart-
3D bar chart-
⊘ This is a preview!⊘
Do you want full access?
Subscribe today to unlock all pages.

Trusted by 1+ million students worldwide

3.
Mean
The formula of Mean: (μ) =
❑
∑ x
❑
N
Key Findings
Number of days: 10
Observing the wind speed: 750
Mean (μ): 750: 10 = 75 %
Mode
Key Findings
Number of days =10
Wind speed = 50, 65, 65, 70, 80, 85, 90, 85, 90, 70
Mode = 65%, 70%, 85% and 90%.
Median
Formula for median = number of terms +1 divided by 2
Key Findings
Days Wind speed (%)
1st 50
Paraphrase This Document
Need a fresh take? Get an instant paraphrase of this document with our AI Paraphraser

2nd 65
3rd 65
4th 70
10th 70
5th 80
6th 85
8th 85
7th 90
9th 90
The number of days = 10
Median value of days = (10+ 1): 2 = 11/ 2= 5.5 %
Average median = (upper value + lower value): 2 = [70+80]: 2 = 75 %
Range
Formulae for range = (Largest value – smallest value)
Key Findings
Largest value of wind speed = 90 %
Smallest value of wind speed = 50%
Range = [90 – 50] = 40%
Standard Deviation
Standard deviation (σ) =
x
❑
∑(¿−μ)
2
❑
N
❑
√ ¿
Key Findings
Days Wind speed (%) Mean (μ) (x-μ) (x-μ)^2
1st 50 75 (50-75)=-25 625
2nd 65 75 (65-75)=-10 100

3rd 65 75 (65-75)-10 100
4th 70 75 (70-75)=-5 25
10th 70 75 (70-75)=-5 25
5th 80 75 (80-75)=5 25
6th 85 75 (85-75)=10 100
8th 85 75 (85-75)=10 100
7th 90 75 (90-75)=15 225
9th 90 75 (90-75)=15 225
Total Gross 750 0 1550
= √ [1550:10]
= 12.44 %
4.
Days Wind speed (%)
1st 50
2nd 65
3rd 65
4th 70
10th 70
5th 80
6th 85
8th 85
7th 90
9th 90
Linear forecasting formula= (y = mx + c)
Value for m
Number of days= 10
Formulae of m =
∑ x ¿ 2
N ∑ x2−¿ N ∑ xy−∑x ∑ y
¿
⊘ This is a preview!⊘
Do you want full access?
Subscribe today to unlock all pages.

Trusted by 1+ million students worldwide

Days (x) Wind speed (y) x^2 x*y
1 50 1 50
2 65 4 130
3 65 9 195
4 70 16 280
5 80 25 400
6 85 36 480
7 90 49 630
8 85 64 680
9 90 81 810
10 70 100 700
55 750 385 4355
m = (10 x 4355 -55 x 750): (10 x 385 -55 x 55)
= 2300: 825
= 2.78
Linear forecasting is 2.78
Inculcating the value of c
The number of days = 10
The formula of c =
∑ y − m∑ x
N
Key Findings
c = [750 – 2.78x 55]: 10 = 747.22: 10 = 74.72.
Value of c is computed and it stands at 74.72.
Forecasting wind speed of 11th and 13th days
Computing the values of m and c as per the linear forecasting
Linear forecasting formula = (y = 2.78 x + 74.72)
On the 11th day, the value of x is 11
Forecasting of wind speed of 11th day=
y = 2.78 x 11+ 74.72
y = 105.3 %
Paraphrase This Document
Need a fresh take? Get an instant paraphrase of this document with our AI Paraphraser

13th day, the value of x is 13
Forecasting of wind speed of 13th day=
y = 2.78 x 13+ 74.72
y = 110.86 %
Forecasting of wind speed of 13th day=
y = 2.78 x 13+ 74.72
y = 110.86 %
1 out of 8
Related Documents

Your All-in-One AI-Powered Toolkit for Academic Success.
+13062052269
info@desklib.com
Available 24*7 on WhatsApp / Email
Unlock your academic potential
Copyright © 2020–2025 A2Z Services. All Rights Reserved. Developed and managed by ZUCOL.