Numeracy and Data Analysis 1: Calculations, Data, and Probability

Verified

Added on  2022/12/15

|8
|1420
|198
Homework Assignment
AI Summary
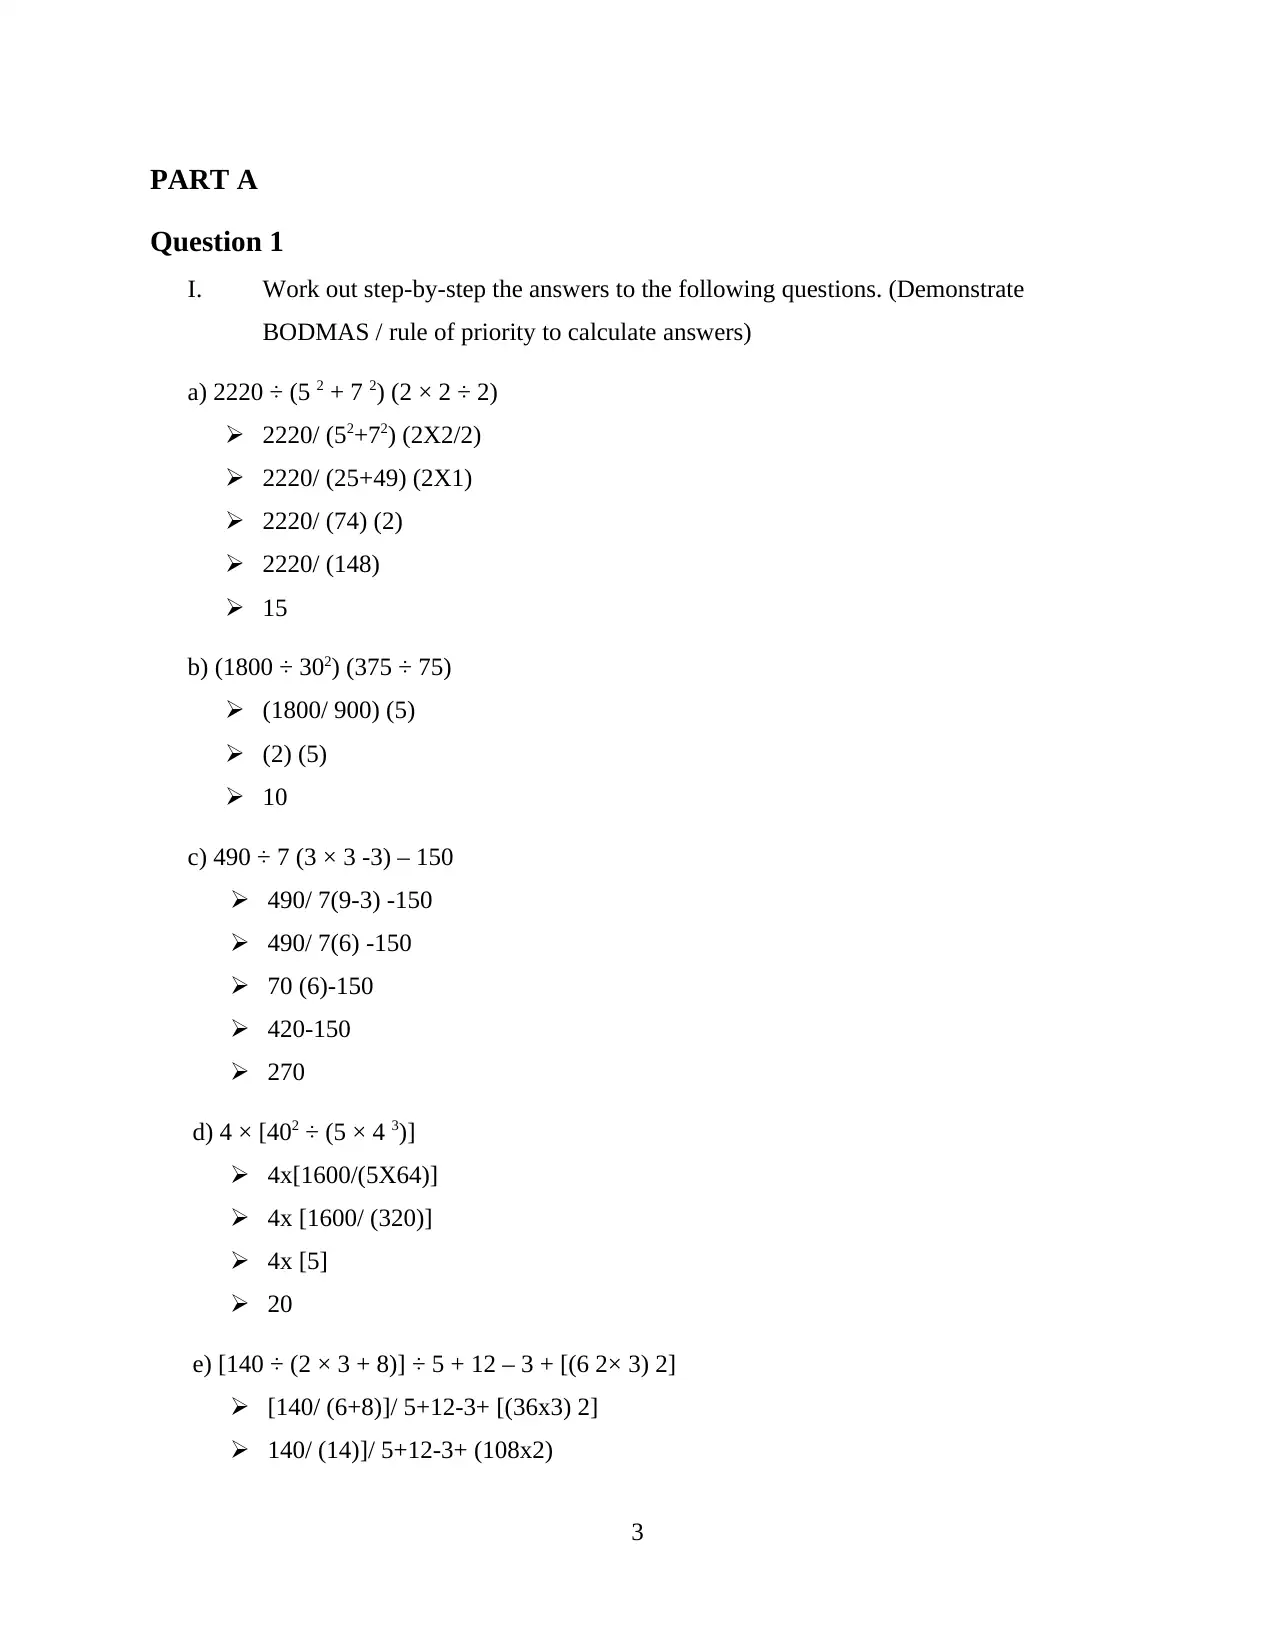
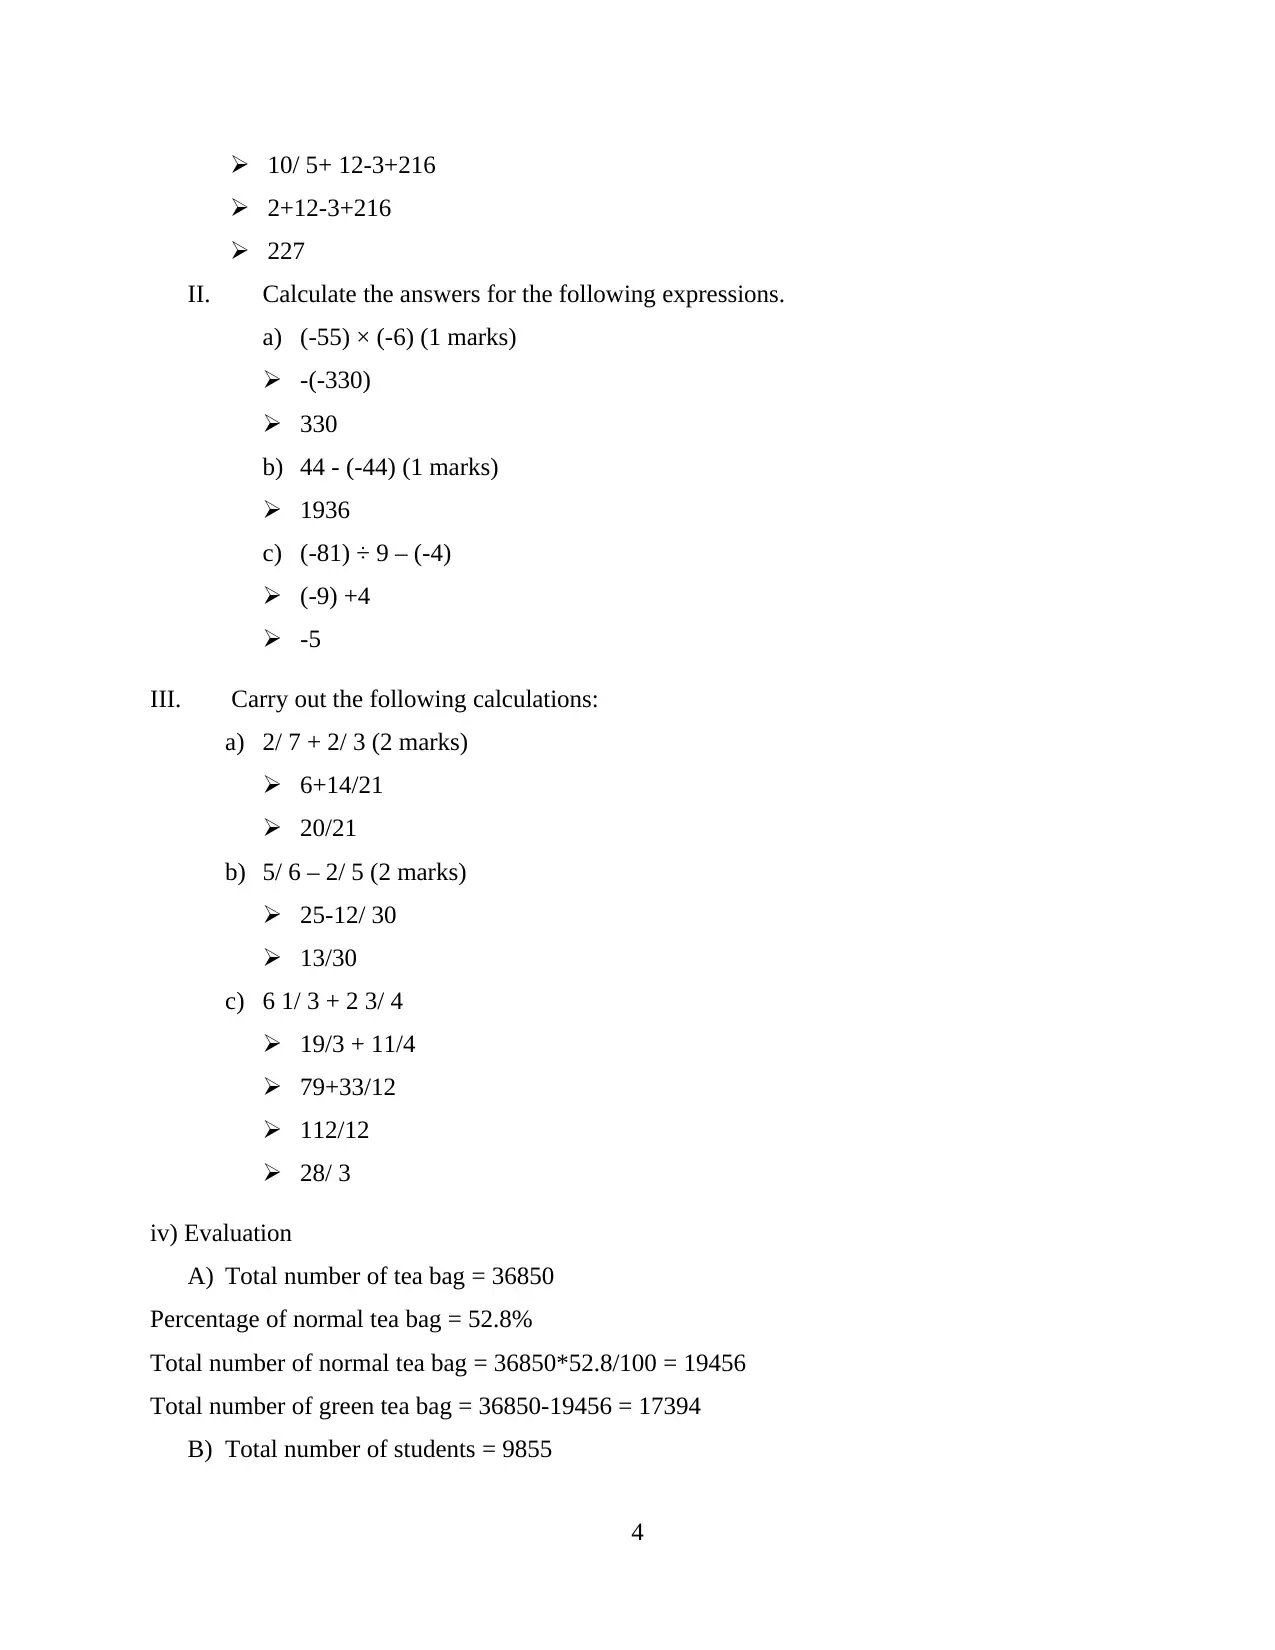
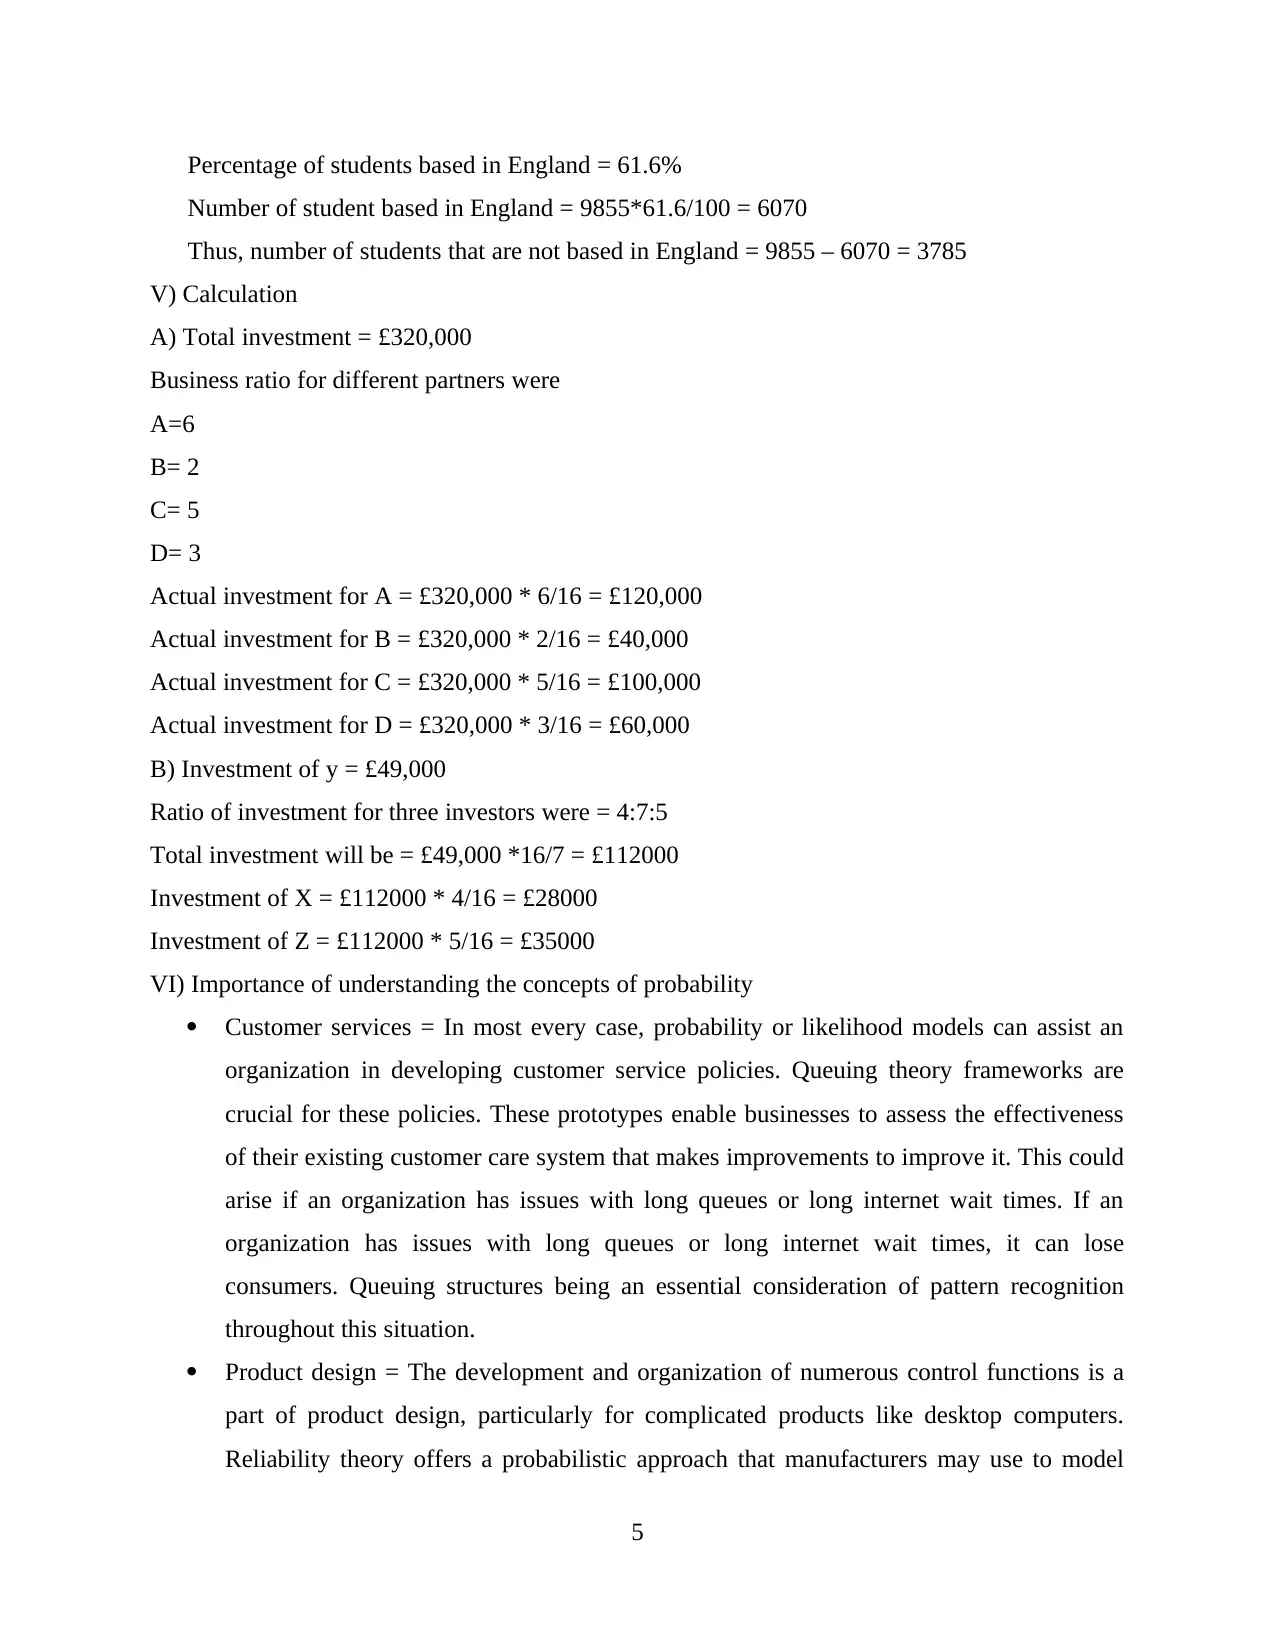
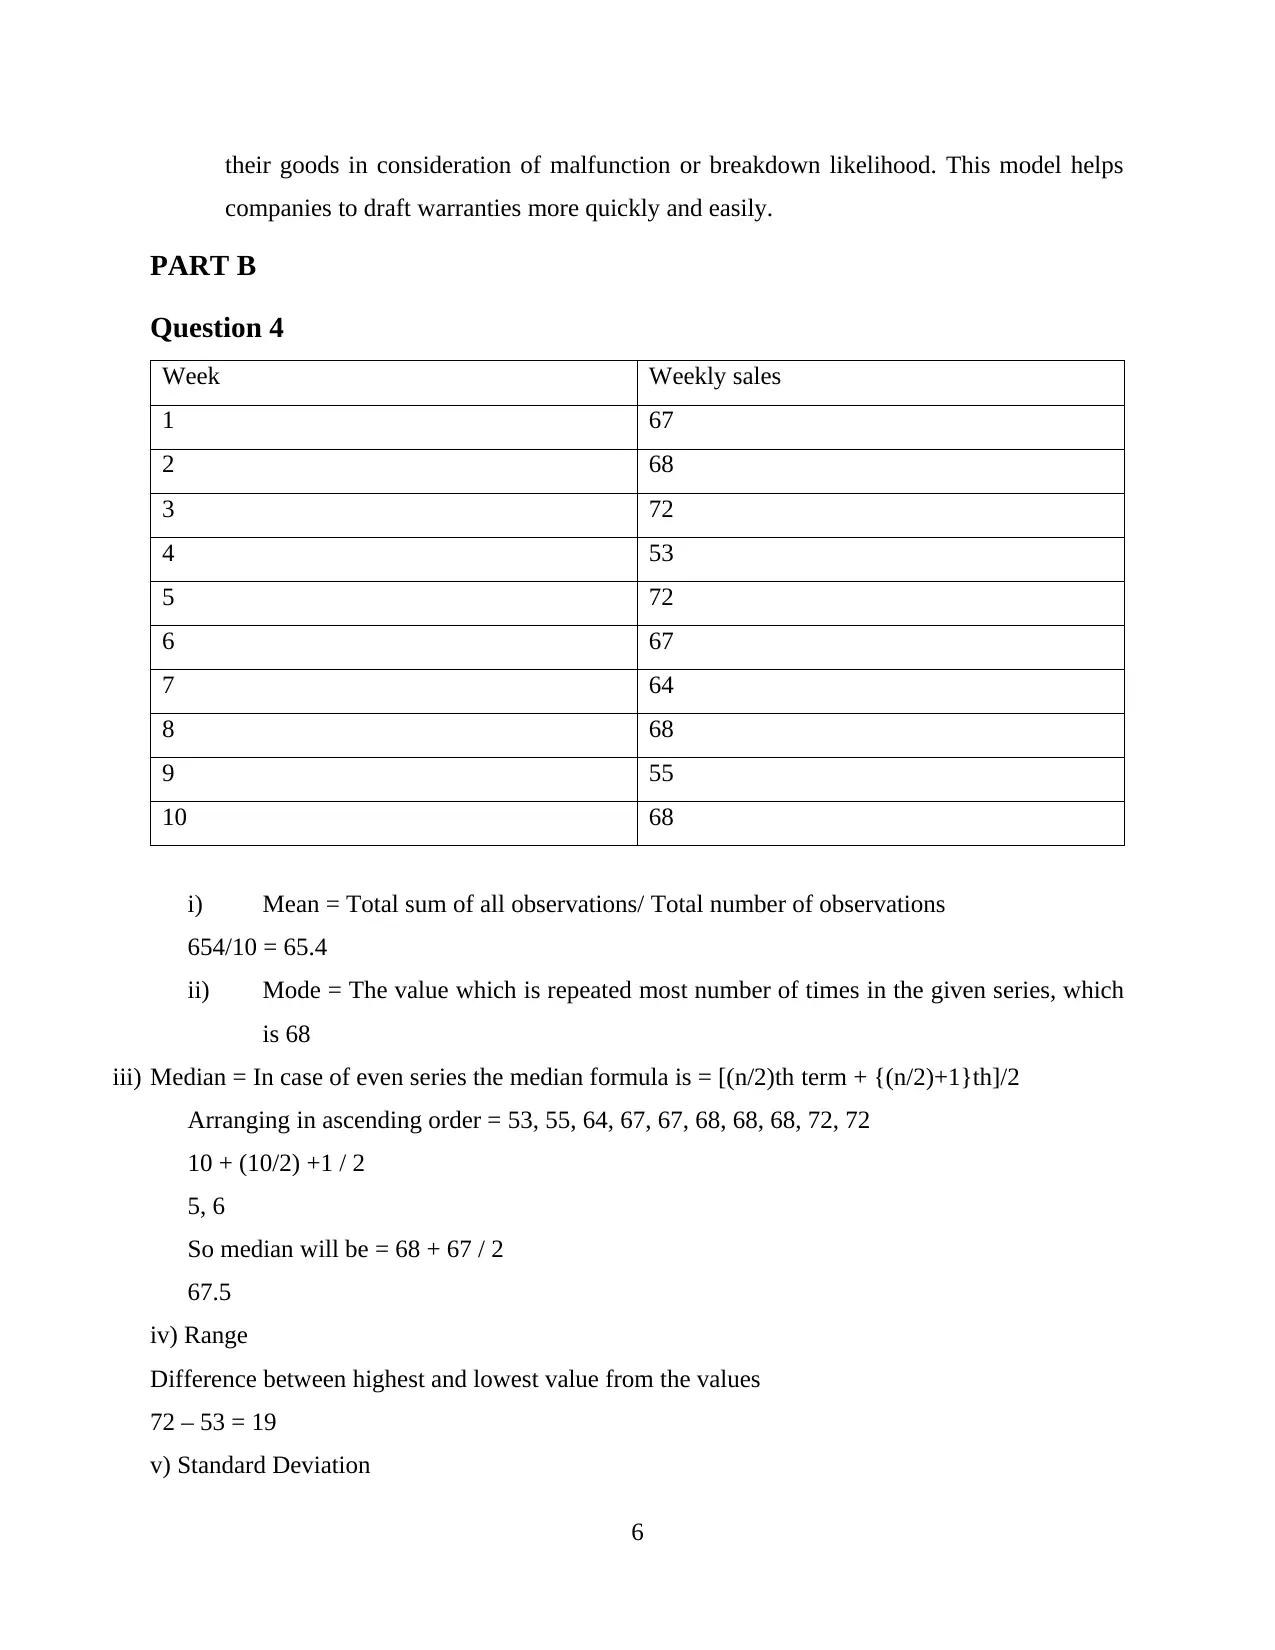
This assignment, titled Numeracy and Data Analysis 1, encompasses a range of mathematical and statistical concepts. Part A focuses on basic calculations using BODMAS, including operations with fractions, and evaluating expressions. Part B involves data analysis, calculating the mean, mode, median, range, and standard deviation from a given dataset. The assignment also explores the concepts of data and information, population and sample, and their importance in business contexts, providing practical examples. Furthermore, it details the characteristics of normal distribution and explains different types of skewed data, with an emphasis on their relevance in the business world. The student demonstrates proficiency in applying these concepts through step-by-step calculations and explanations.
Document Page
Numeracy and Data
Analysis
1
tabler-icon-diamond-filled.svg

Paraphrase This Document

Need a fresh take? Get an instant paraphrase of this document with our AI Paraphraser
Document Page
Contents
Contents...........................................................................................................................................2
PART A...........................................................................................................................................3
Question 1........................................................................................................................................3
PART B...........................................................................................................................................6
Question 4........................................................................................................................................6
Question - 5......................................................................................................................................7
2
Document Page
PART A
Question 1
I. Work out step-by-step the answers to the following questions. (Demonstrate
BODMAS / rule of priority to calculate answers)
a) 2220 ÷ (5 2 + 7 2) (2 × 2 ÷ 2)
2220/ (52+72) (2X2/2)
2220/ (25+49) (2X1)
2220/ (74) (2)
2220/ (148)
15
b) (1800 ÷ 302) (375 ÷ 75)
(1800/ 900) (5)
(2) (5)
10
c) 490 ÷ 7 (3 × 3 -3) – 150
490/ 7(9-3) -150
490/ 7(6) -150
70 (6)-150
420-150
270
d) 4 × [402 ÷ (5 × 4 3)]
4x[1600/(5X64)]
4x [1600/ (320)]
4x [5]
20
e) [140 ÷ (2 × 3 + 8)] ÷ 5 + 12 – 3 + [(6 2× 3) 2]
[140/ (6+8)]/ 5+12-3+ [(36x3) 2]
140/ (14)]/ 5+12-3+ (108x2)
3
Document Page
10/ 5+ 12-3+216
2+12-3+216
227
II. Calculate the answers for the following expressions.
a) (-55) × (-6) (1 marks)
-(-330)
330
b) 44 - (-44) (1 marks)
1936
c) (-81) ÷ 9 – (-4)
(-9) +4
-5
III. Carry out the following calculations:
a) 2/ 7 + 2/ 3 (2 marks)
6+14/21
20/21
b) 5/ 6 – 2/ 5 (2 marks)
25-12/ 30
13/30
c) 6 1/ 3 + 2 3/ 4
19/3 + 11/4
79+33/12
112/12
28/ 3
iv) Evaluation
A) Total number of tea bag = 36850
Percentage of normal tea bag = 52.8%
Total number of normal tea bag = 36850*52.8/100 = 19456
Total number of green tea bag = 36850-19456 = 17394
B) Total number of students = 9855
4
tabler-icon-diamond-filled.svg

Paraphrase This Document

Need a fresh take? Get an instant paraphrase of this document with our AI Paraphraser
Document Page
Percentage of students based in England = 61.6%
Number of student based in England = 9855*61.6/100 = 6070
Thus, number of students that are not based in England = 9855 – 6070 = 3785
V) Calculation
A) Total investment = £320,000
Business ratio for different partners were
A=6
B= 2
C= 5
D= 3
Actual investment for A = £320,000 * 6/16 = £120,000
Actual investment for B = £320,000 * 2/16 = £40,000
Actual investment for C = £320,000 * 5/16 = £100,000
Actual investment for D = £320,000 * 3/16 = £60,000
B) Investment of y = £49,000
Ratio of investment for three investors were = 4:7:5
Total investment will be = £49,000 *16/7 = £112000
Investment of X = £112000 * 4/16 = £28000
Investment of Z = £112000 * 5/16 = £35000
VI) Importance of understanding the concepts of probability
Customer services = In most every case, probability or likelihood models can assist an
organization in developing customer service policies. Queuing theory frameworks are
crucial for these policies. These prototypes enable businesses to assess the effectiveness
of their existing customer care system that makes improvements to improve it. This could
arise if an organization has issues with long queues or long internet wait times. If an
organization has issues with long queues or long internet wait times, it can lose
consumers. Queuing structures being an essential consideration of pattern recognition
throughout this situation.
Product design = The development and organization of numerous control functions is a
part of product design, particularly for complicated products like desktop computers.
Reliability theory offers a probabilistic approach that manufacturers may use to model
5
Document Page
their goods in consideration of malfunction or breakdown likelihood. This model helps
companies to draft warranties more quickly and easily.
PART B
Question 4
Week Weekly sales
1 67
2 68
3 72
4 53
5 72
6 67
7 64
8 68
9 55
10 68
i) Mean = Total sum of all observations/ Total number of observations
654/10 = 65.4
ii) Mode = The value which is repeated most number of times in the given series, which
is 68
iii) Median = In case of even series the median formula is = [(n/2)th term + {(n/2)+1}th]/2
Arranging in ascending order = 53, 55, 64, 67, 67, 68, 68, 68, 72, 72
10 + (10/2) +1 / 2
5, 6
So median will be = 68 + 67 / 2
67.5
iv) Range
Difference between highest and lowest value from the values
72 – 53 = 19
v) Standard Deviation
6
Document Page
mean = 64.5
n = 10
X = values for each point
formula 𝝈 = √ ∑(𝑿−μ)/ n = 6.47
Question - 5
I. Using appropriate examples, explain what data and information is.
Data and knowledge are two distinct words that are used interchangeably. Facts or
information through which information is obtained are referred to as data. It really is the
obligation collector to ensure that the findings are useful information that could be used to
perform any parts are produced or investigation.
Data
They are referred to as disorganized evidence that must be modified according to the prosecutor's
needs. It should be regarded as worthless unless it is fully organized in the relevant operational
environment. For example, data may be the outcome of a student's success on a research paper.
Information
It's really the phase at which data is organized well and to meet all of the requirements of a given
mission and is related to those as data. An important contributing factor is the average grade
received by students in the classroom.
II. Using appropriate examples, explain what population and sample is and the
importance of sampling in the business world.
The cumulative number of applications in a party or class is referred to as one of the
electorate. Sample size, on the other side, focuses on a particular category of people who are
designed to describe of performing an operation or for some other function.
Examples of population
Work advertisement in the United Kingdom
University graduates from all around the world are welcome in the United Kingdom.
Example of Sample
Top outcomes in a quest for a particular work advertising in the United Kingdom.
Nations including GDP as well as NDP data accessible 400 PG graduates from Harvard
University
7
tabler-icon-diamond-filled.svg

Paraphrase This Document

Need a fresh take? Get an instant paraphrase of this document with our AI Paraphraser
Document Page
III. Explain the characteristics of normal distribution and three types of skewed data can
be found in the business world.
The standard distribution, sometimes recognized as both the Gaussian distribution, is
indeed a convergent distribution function based mostly on mean, meaning that
information close to the mean appear more often than information far from being. The
regular distribution would appear as just a bell curve on even a chart.
Standard distribution characteristics
The mean, mode, as well as median all have the same value.
At its middle, the curve is linear.
Types of Skewed data
Data with a positive skew: A specific entity arrangement is one in which the tail
seems to be on the right hand side as well as the body is moved to the left.
Data that is negatively skew: A negatively biased distribution is one in which the tail is
now on the left hand side as well as the body is moved to the right.
8
chevron_up_icon
1 out of 8
circle_padding
hide_on_mobile
zoom_out_icon
[object Object]