Numeracy and Data Analysis: Dover Priory Station Usage Analysis Report

Verified

Added on  2020/10/05

|9
|1381
|201
Report
AI Summary
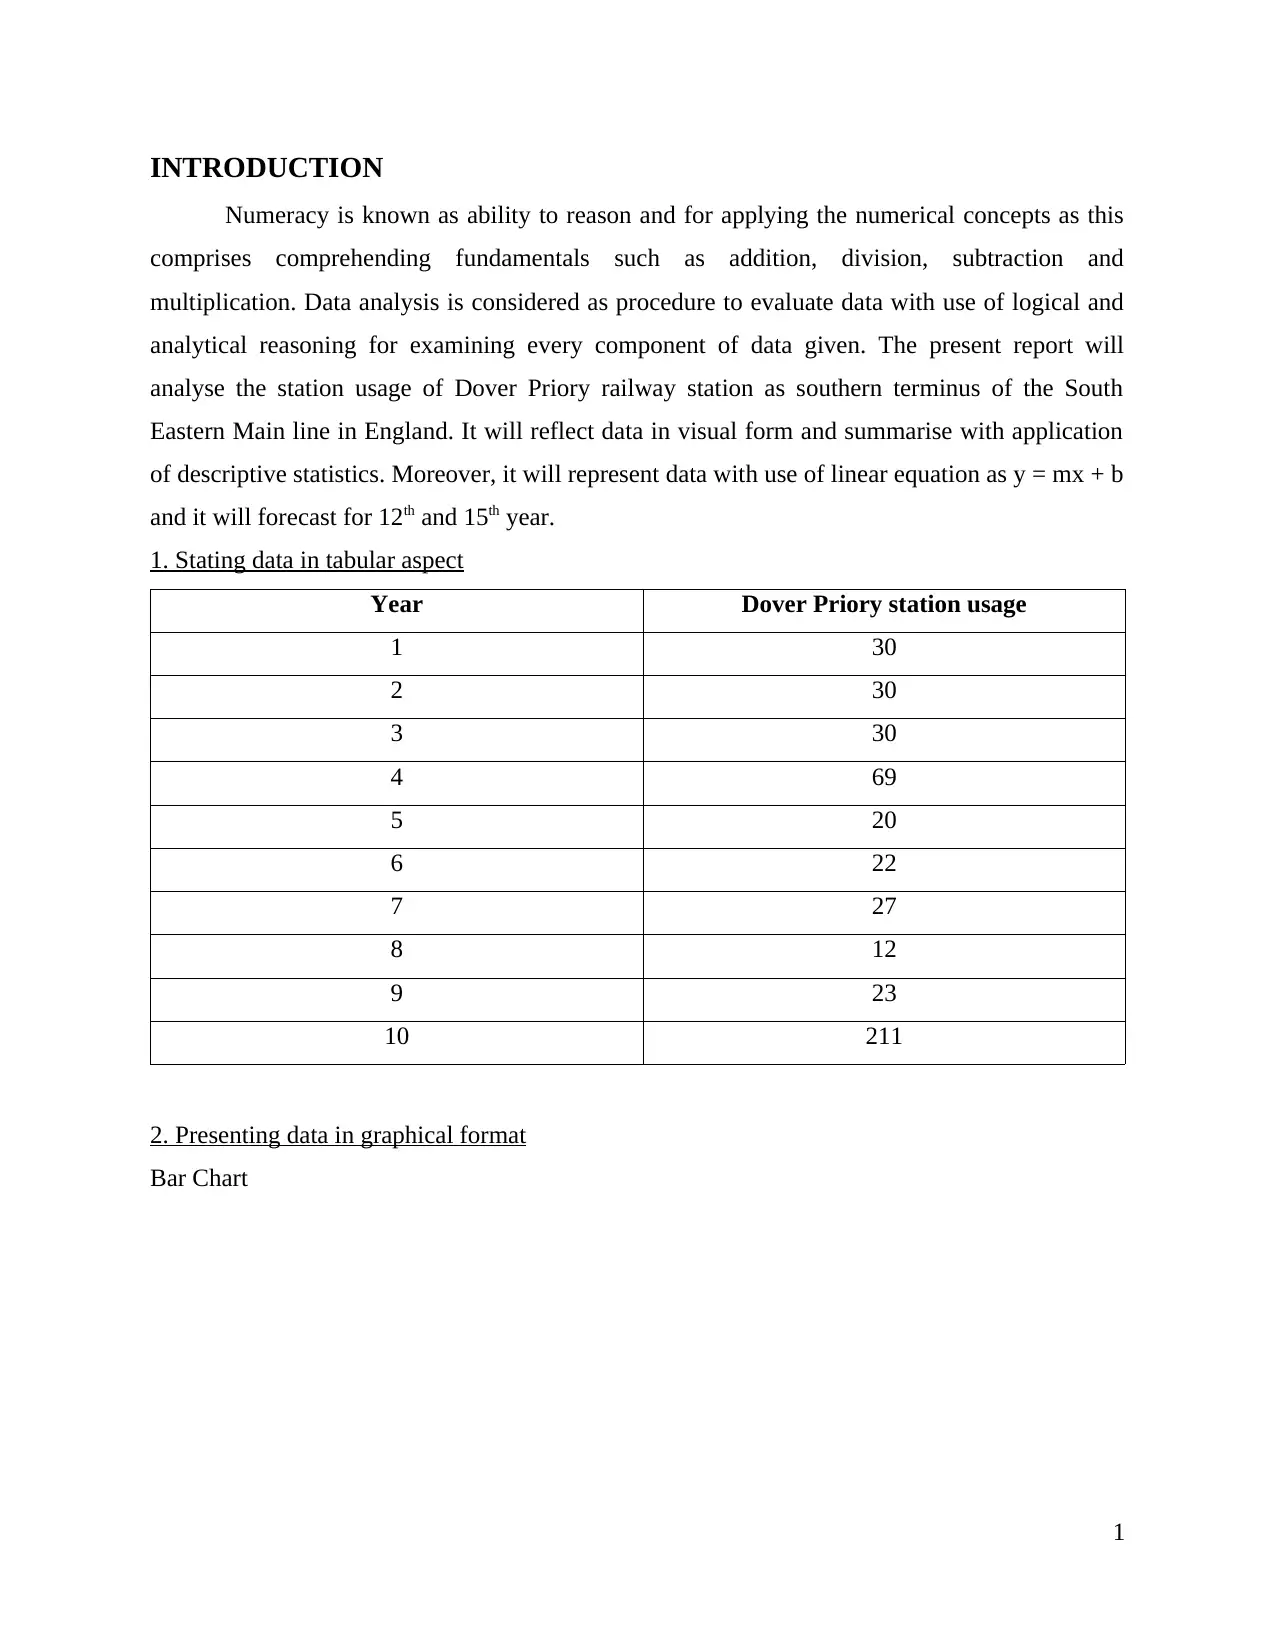
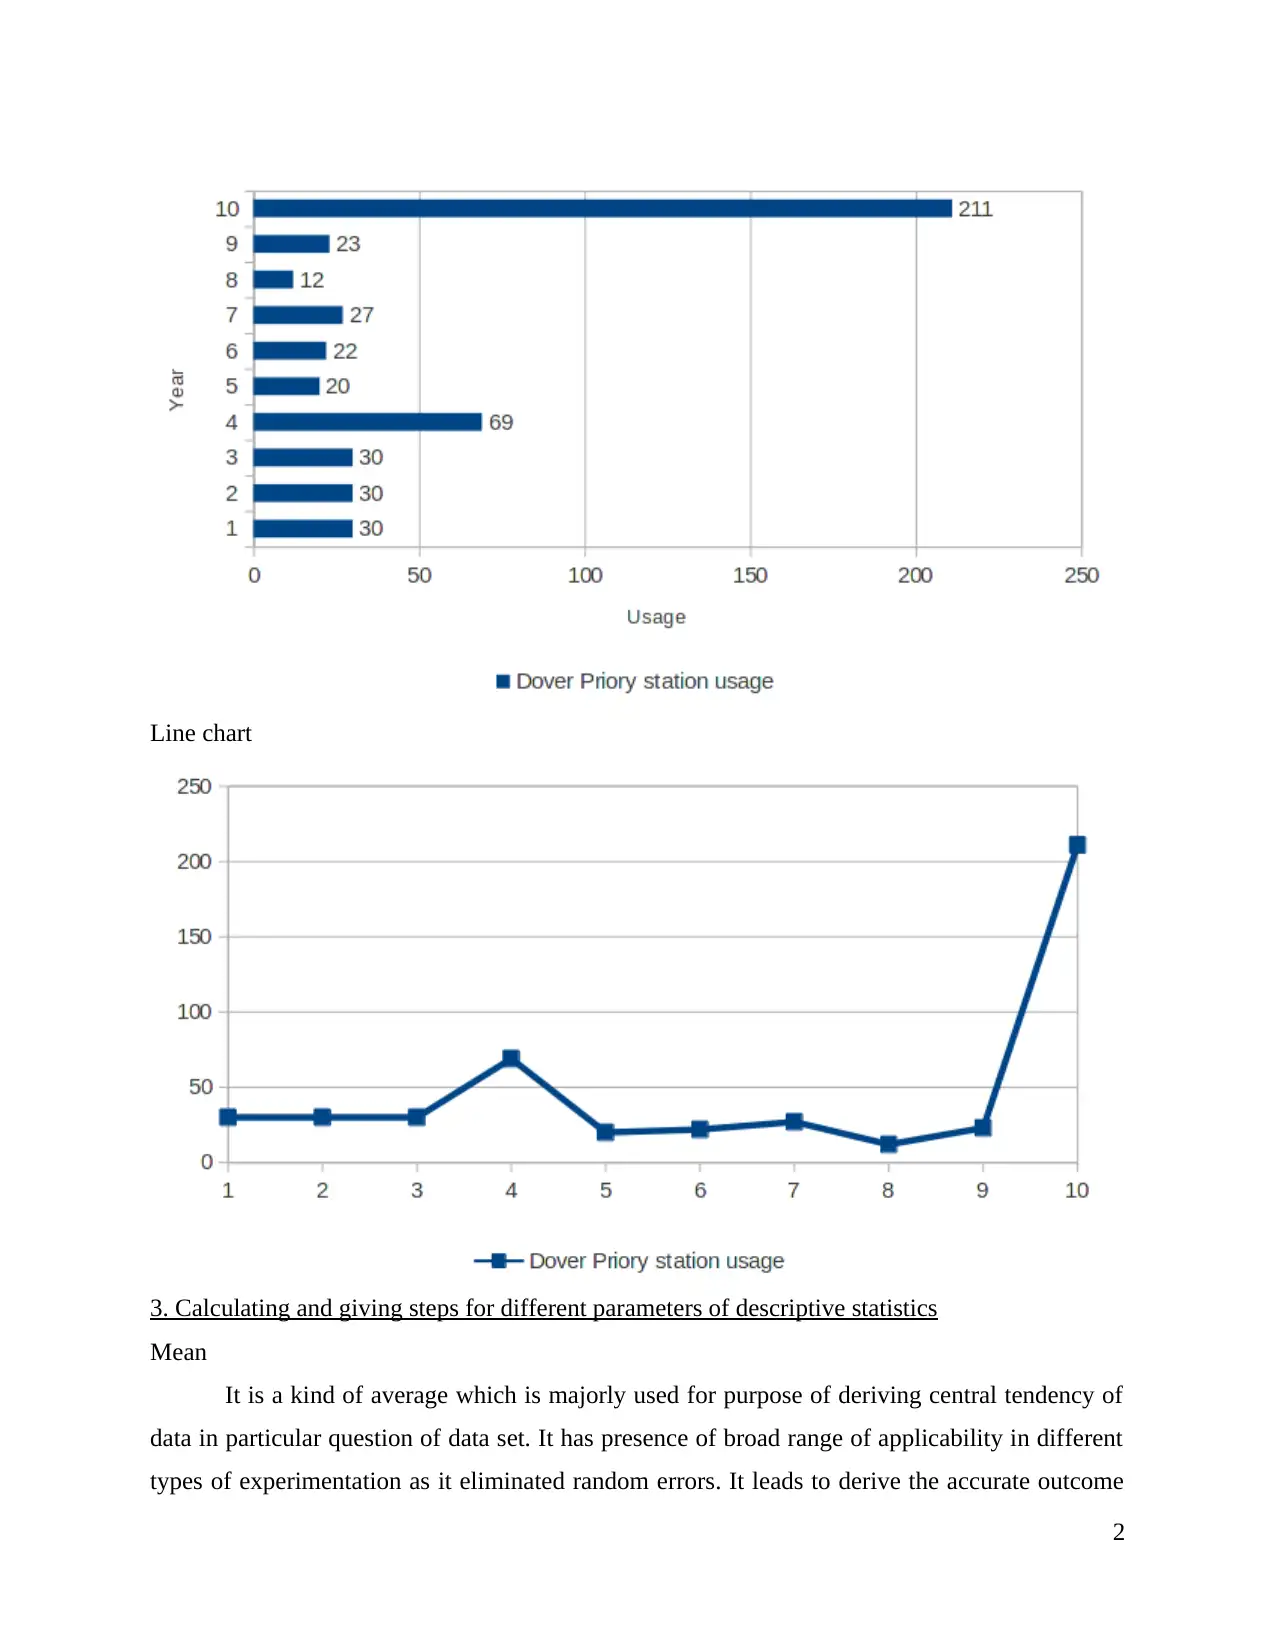
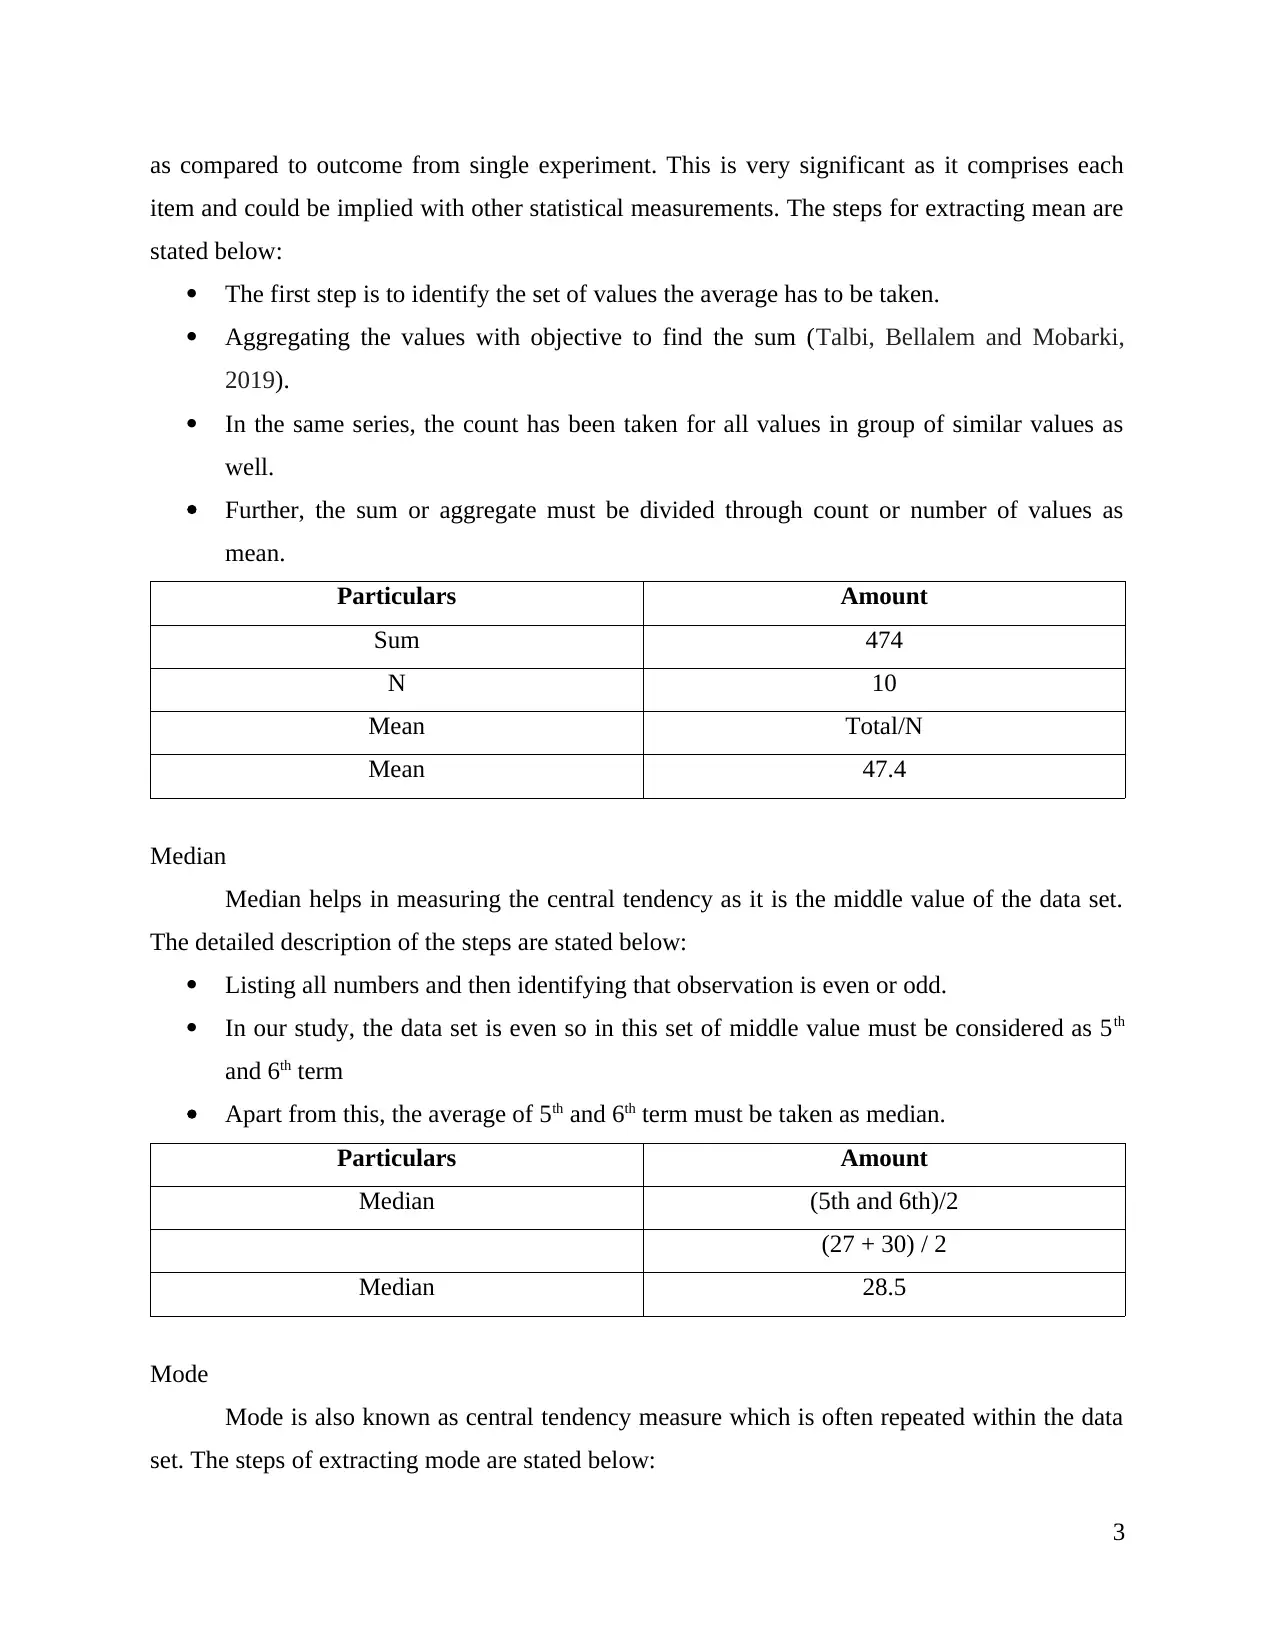
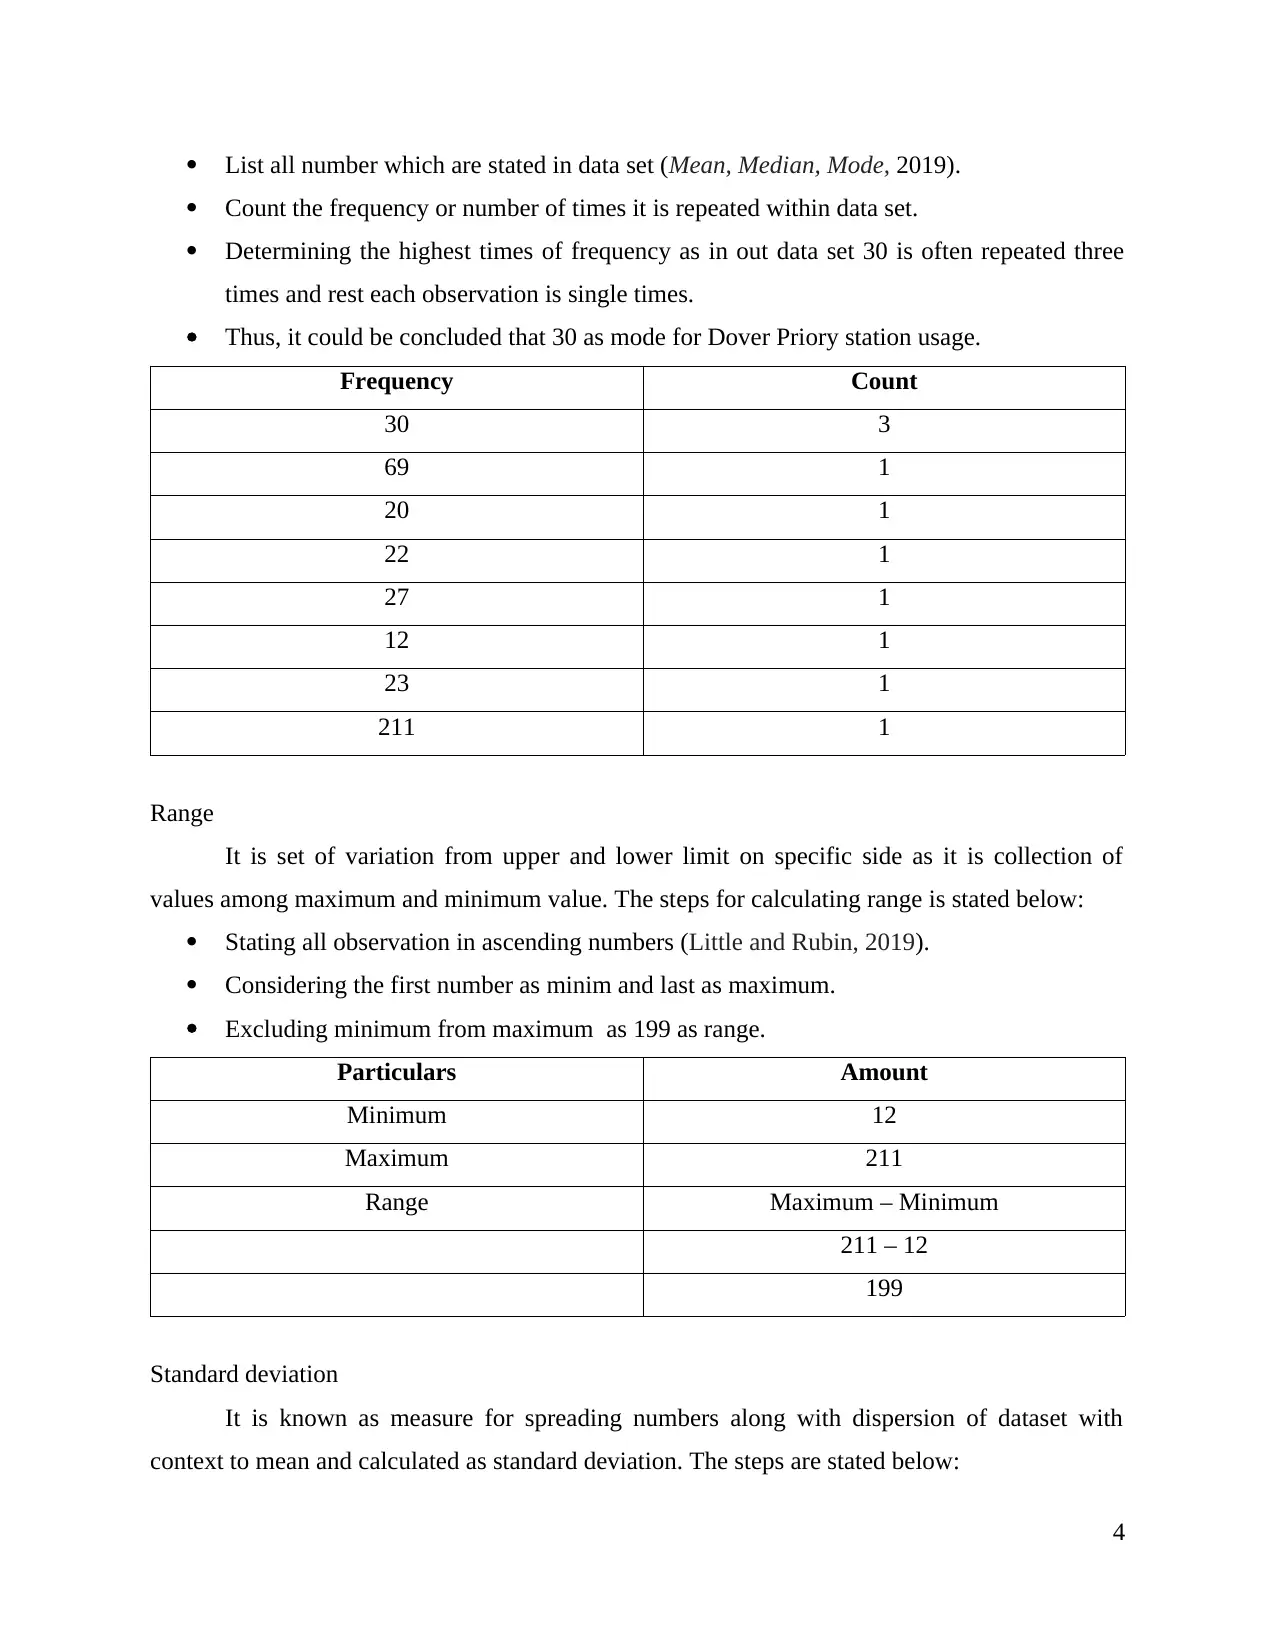
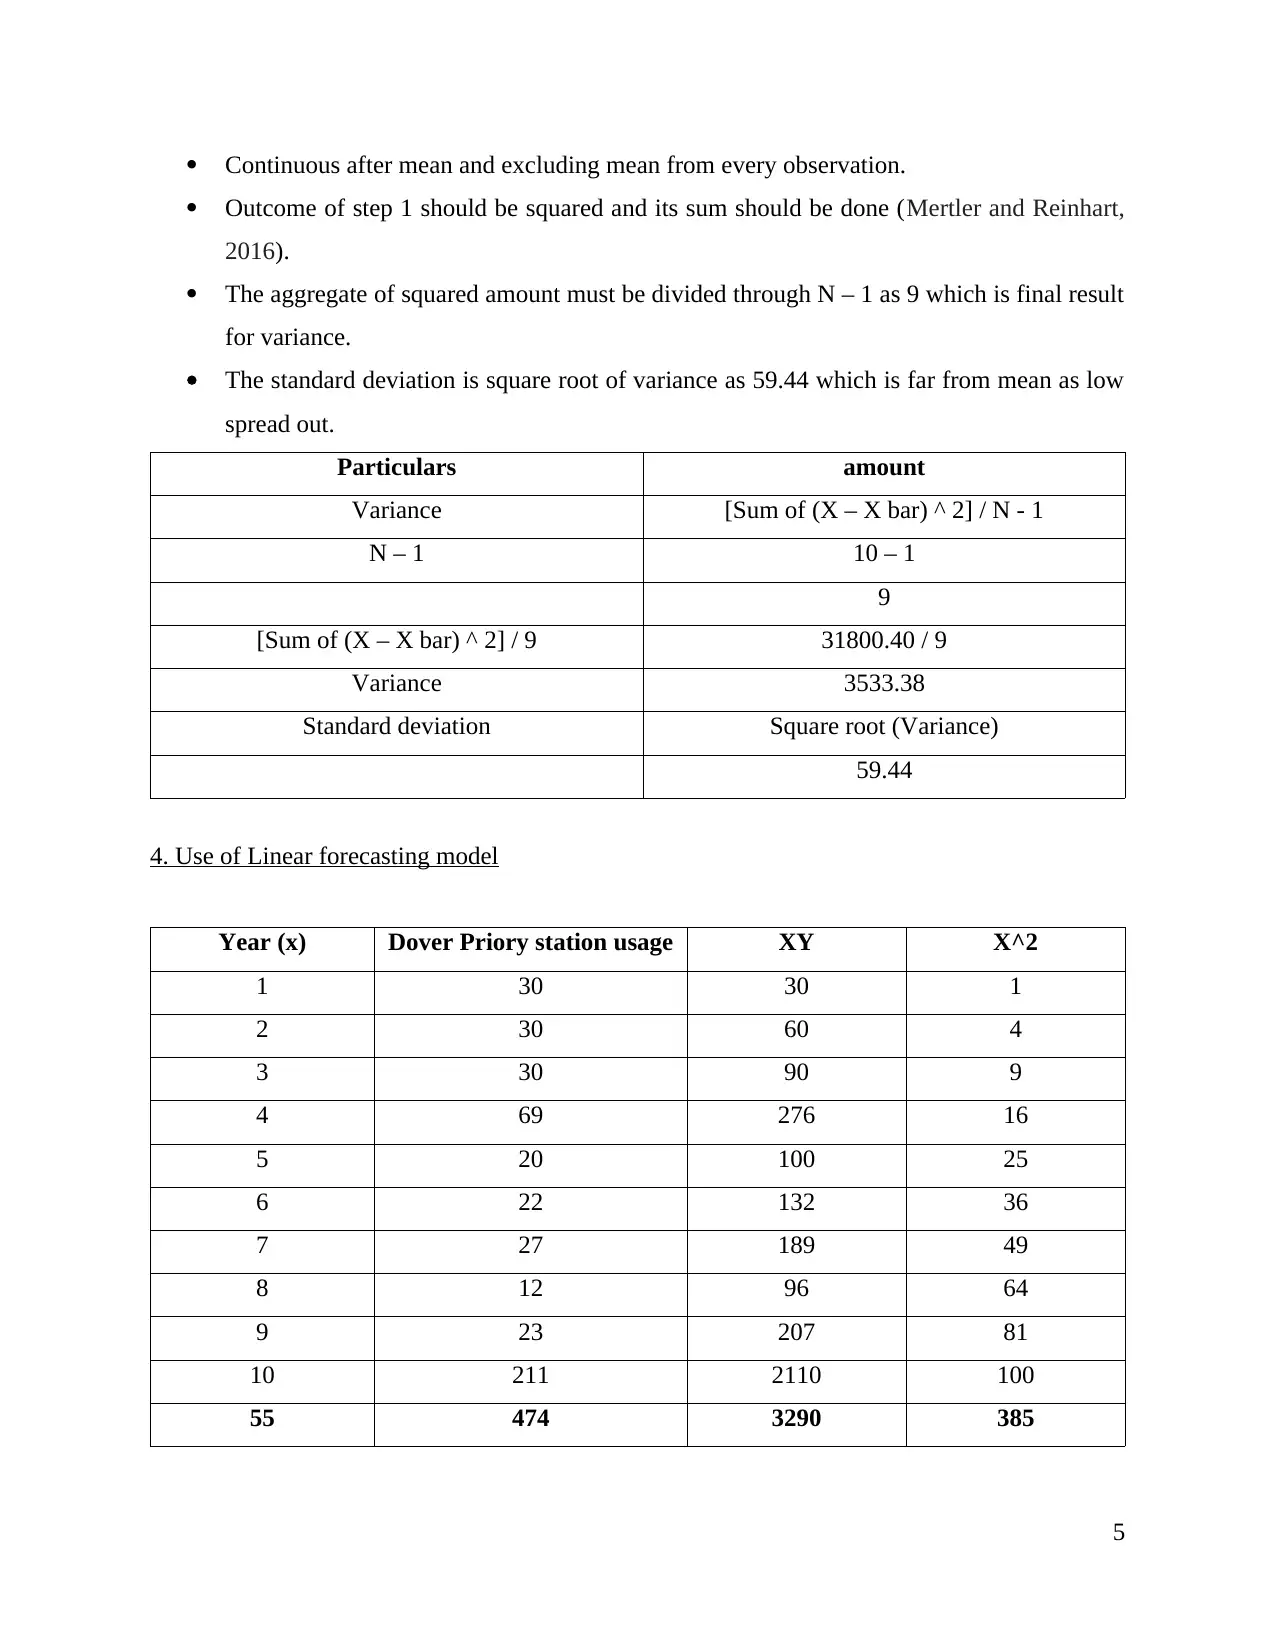
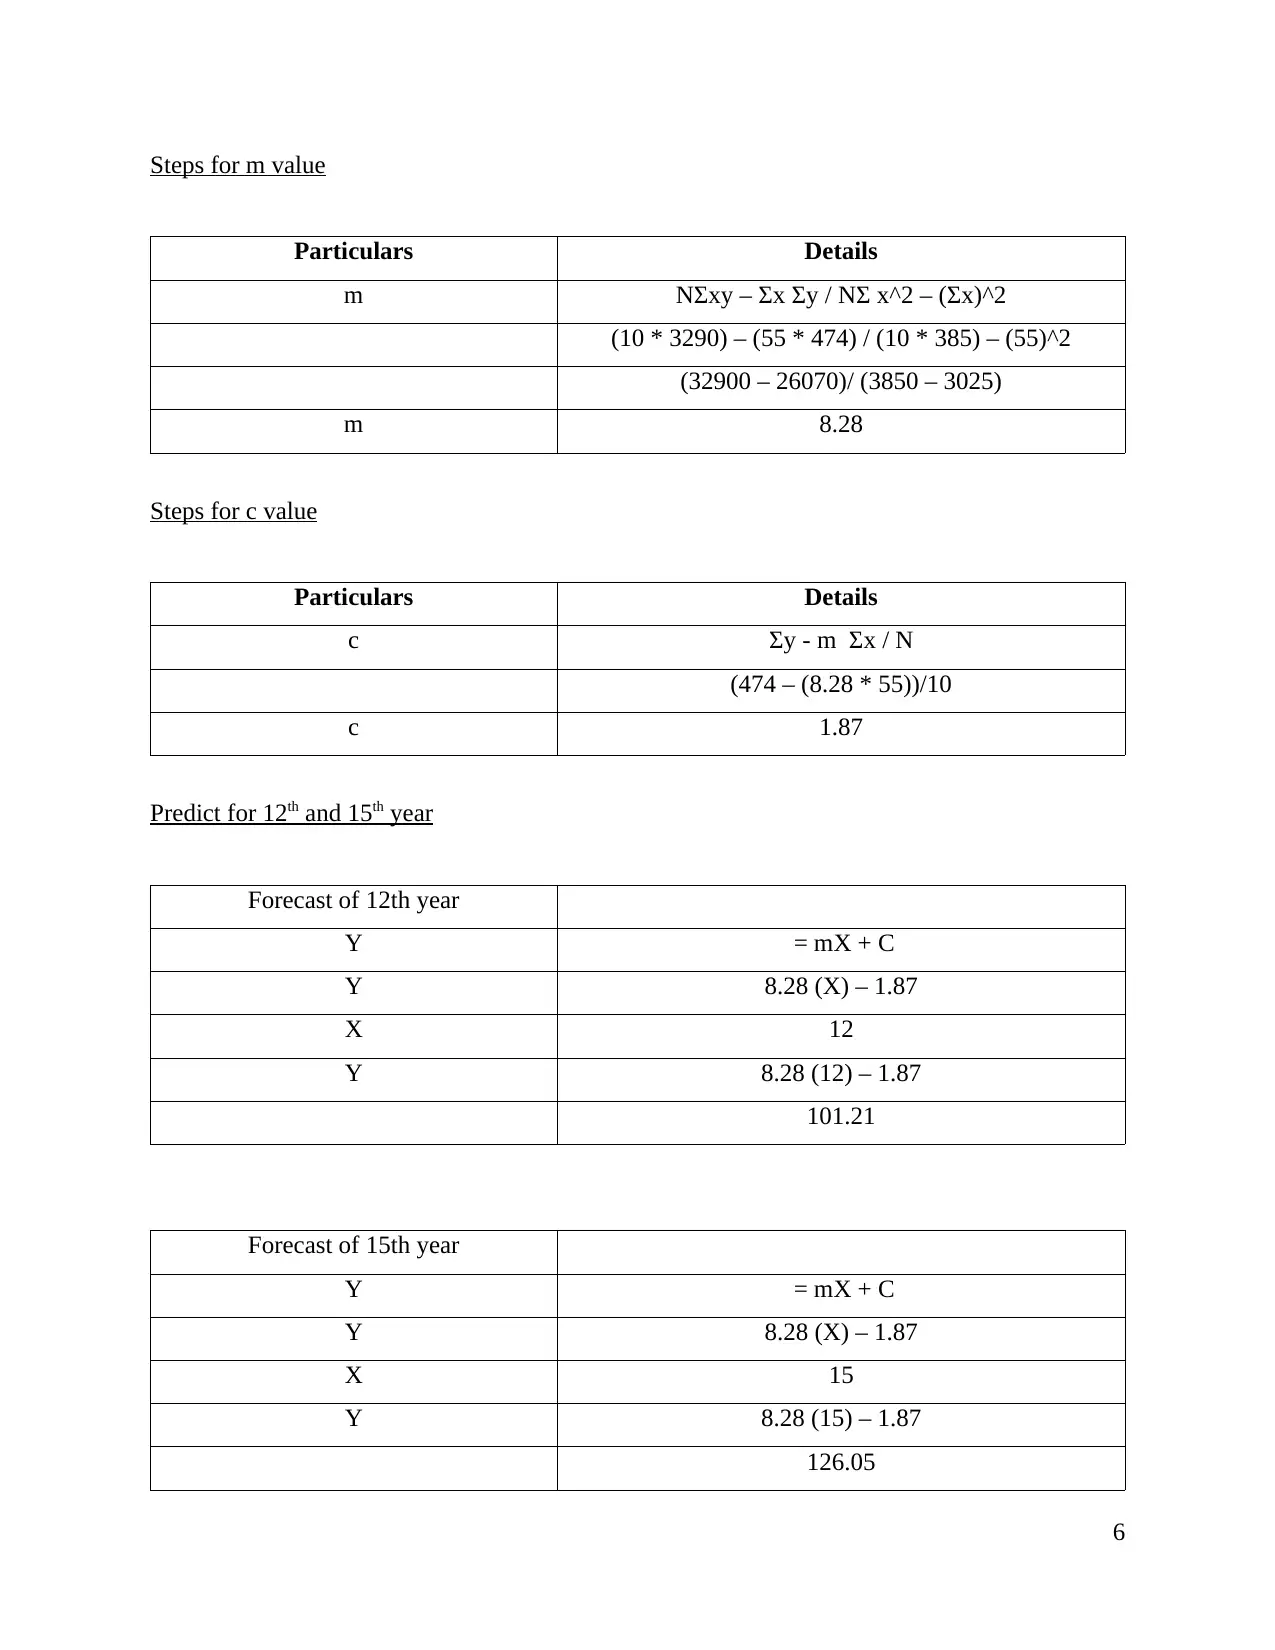
This report provides a comprehensive analysis of Dover Priory railway station usage, employing numeracy and data analysis techniques. The report begins by presenting station usage data in both tabular and graphical formats (bar and line charts). It then delves into descriptive statistics, calculating and explaining the mean, median, mode, range, and standard deviation. The report further utilizes a linear forecasting model (y = mx + c) to predict station usage for the 12th and 15th years, detailing the steps involved in calculating the 'm' and 'c' values. The conclusion summarizes the findings, highlighting the importance of numeracy and data analysis in the study, and the application of the linear forecasting model. The report includes a list of cited references, including books and online resources.
Document Page
NUMERACY AND DATA
ANALYSIS
tabler-icon-diamond-filled.svg

Secure Best Marks with AI Grader

Need help grading? Try our AI Grader for instant feedback on your assignments.
Document Page
TABLE OF CONTENTS
INTRODUCTION...........................................................................................................................1
1. Stating data in tabular aspect...................................................................................................1
2. Presenting data in graphical format.........................................................................................1
3. Calculating and giving steps for different parameters of descriptive statistics.......................2
4. Use of Linear forecasting model.............................................................................................5
Steps for m value.........................................................................................................................5
Steps for c value..........................................................................................................................5
Predict for 12th and 15th year.....................................................................................................6
CONCLUSION................................................................................................................................6
REFERENCES................................................................................................................................7
Document Page
INTRODUCTION
Numeracy is known as ability to reason and for applying the numerical concepts as this
comprises comprehending fundamentals such as addition, division, subtraction and
multiplication. Data analysis is considered as procedure to evaluate data with use of logical and
analytical reasoning for examining every component of data given. The present report will
analyse the station usage of Dover Priory railway station as southern terminus of the South
Eastern Main line in England. It will reflect data in visual form and summarise with application
of descriptive statistics. Moreover, it will represent data with use of linear equation as y = mx + b
and it will forecast for 12th and 15th year.
1. Stating data in tabular aspect
Year Dover Priory station usage
1 30
2 30
3 30
4 69
5 20
6 22
7 27
8 12
9 23
10 211
2. Presenting data in graphical format
Bar Chart
1
Document Page
Line chart
3. Calculating and giving steps for different parameters of descriptive statistics
Mean
It is a kind of average which is majorly used for purpose of deriving central tendency of
data in particular question of data set. It has presence of broad range of applicability in different
types of experimentation as it eliminated random errors. It leads to derive the accurate outcome
2
tabler-icon-diamond-filled.svg

Secure Best Marks with AI Grader

Need help grading? Try our AI Grader for instant feedback on your assignments.
Document Page
as compared to outcome from single experiment. This is very significant as it comprises each
item and could be implied with other statistical measurements. The steps for extracting mean are
stated below:
The first step is to identify the set of values the average has to be taken.
Aggregating the values with objective to find the sum (Talbi, Bellalem and Mobarki,
2019).
In the same series, the count has been taken for all values in group of similar values as
well.
Further, the sum or aggregate must be divided through count or number of values as
mean.
Particulars Amount
Sum 474
N 10
Mean Total/N
Mean 47.4
Median
Median helps in measuring the central tendency as it is the middle value of the data set.
The detailed description of the steps are stated below:
Listing all numbers and then identifying that observation is even or odd.
In our study, the data set is even so in this set of middle value must be considered as 5th
and 6th term
Apart from this, the average of 5th and 6th term must be taken as median.
Particulars Amount
Median (5th and 6th)/2
(27 + 30) / 2
Median 28.5
Mode
Mode is also known as central tendency measure which is often repeated within the data
set. The steps of extracting mode are stated below:
3
Document Page
List all number which are stated in data set (Mean, Median, Mode, 2019).
Count the frequency or number of times it is repeated within data set.
Determining the highest times of frequency as in out data set 30 is often repeated three
times and rest each observation is single times.
Thus, it could be concluded that 30 as mode for Dover Priory station usage.
Frequency Count
30 3
69 1
20 1
22 1
27 1
12 1
23 1
211 1
Range
It is set of variation from upper and lower limit on specific side as it is collection of
values among maximum and minimum value. The steps for calculating range is stated below:
Stating all observation in ascending numbers (Little and Rubin, 2019).
Considering the first number as minim and last as maximum.
Excluding minimum from maximum as 199 as range.
Particulars Amount
Minimum 12
Maximum 211
Range Maximum – Minimum
211 – 12
199
Standard deviation
It is known as measure for spreading numbers along with dispersion of dataset with
context to mean and calculated as standard deviation. The steps are stated below:
4
Document Page
Continuous after mean and excluding mean from every observation.
Outcome of step 1 should be squared and its sum should be done (Mertler and Reinhart,
2016).
The aggregate of squared amount must be divided through N – 1 as 9 which is final result
for variance.
The standard deviation is square root of variance as 59.44 which is far from mean as low
spread out.
Particulars amount
Variance [Sum of (X – X bar) ^ 2] / N - 1
N – 1 10 – 1
9
[Sum of (X – X bar) ^ 2] / 9 31800.40 / 9
Variance 3533.38
Standard deviation Square root (Variance)
59.44
4. Use of Linear forecasting model
Year (x) Dover Priory station usage XY X^2
1 30 30 1
2 30 60 4
3 30 90 9
4 69 276 16
5 20 100 25
6 22 132 36
7 27 189 49
8 12 96 64
9 23 207 81
10 211 2110 100
55 474 3290 385
5
tabler-icon-diamond-filled.svg

Paraphrase This Document

Need a fresh take? Get an instant paraphrase of this document with our AI Paraphraser
Document Page
Steps for m value
Particulars Details
m NΣxy – Σx Σy / NΣ x^2 – (Σx)^2
(10 * 3290) – (55 * 474) / (10 * 385) – (55)^2
(32900 – 26070)/ (3850 – 3025)
m 8.28
Steps for c value
Particulars Details
c Σy - m Σx / N
(474 – (8.28 * 55))/10
c 1.87
Predict for 12th and 15th year
Forecast of 12th year
Y = mX + C
Y 8.28 (X) – 1.87
X 12
Y 8.28 (12) – 1.87
101.21
Forecast of 15th year
Y = mX + C
Y 8.28 (X) – 1.87
X 15
Y 8.28 (15) – 1.87
126.05
6
Document Page
CONCLUSION
From the above report, it could be concluded that numeracy and data analysis had
contributed very important role in the entire study. It has shown proper analysis of Dover Priory
station usage with use of descriptive statistics as it has less spread because of high difference
among mean and standard deviation. However, it has articulated use of linear forecasting model
for 12th and 15th year as 101.2 and 126.05 respectively with equation y = mx + c.
7
chevron_up_icon
1 out of 9
circle_padding
hide_on_mobile
zoom_out_icon
logo.png

Your All-in-One AI-Powered Toolkit for Academic Success.

Available 24*7 on WhatsApp / Email

[object Object]