Data Analysis and Linear Forecasting of London Wind Speed Report

Verified

Added on  2021/02/20

|9
|1635
|84
Report
AI Summary
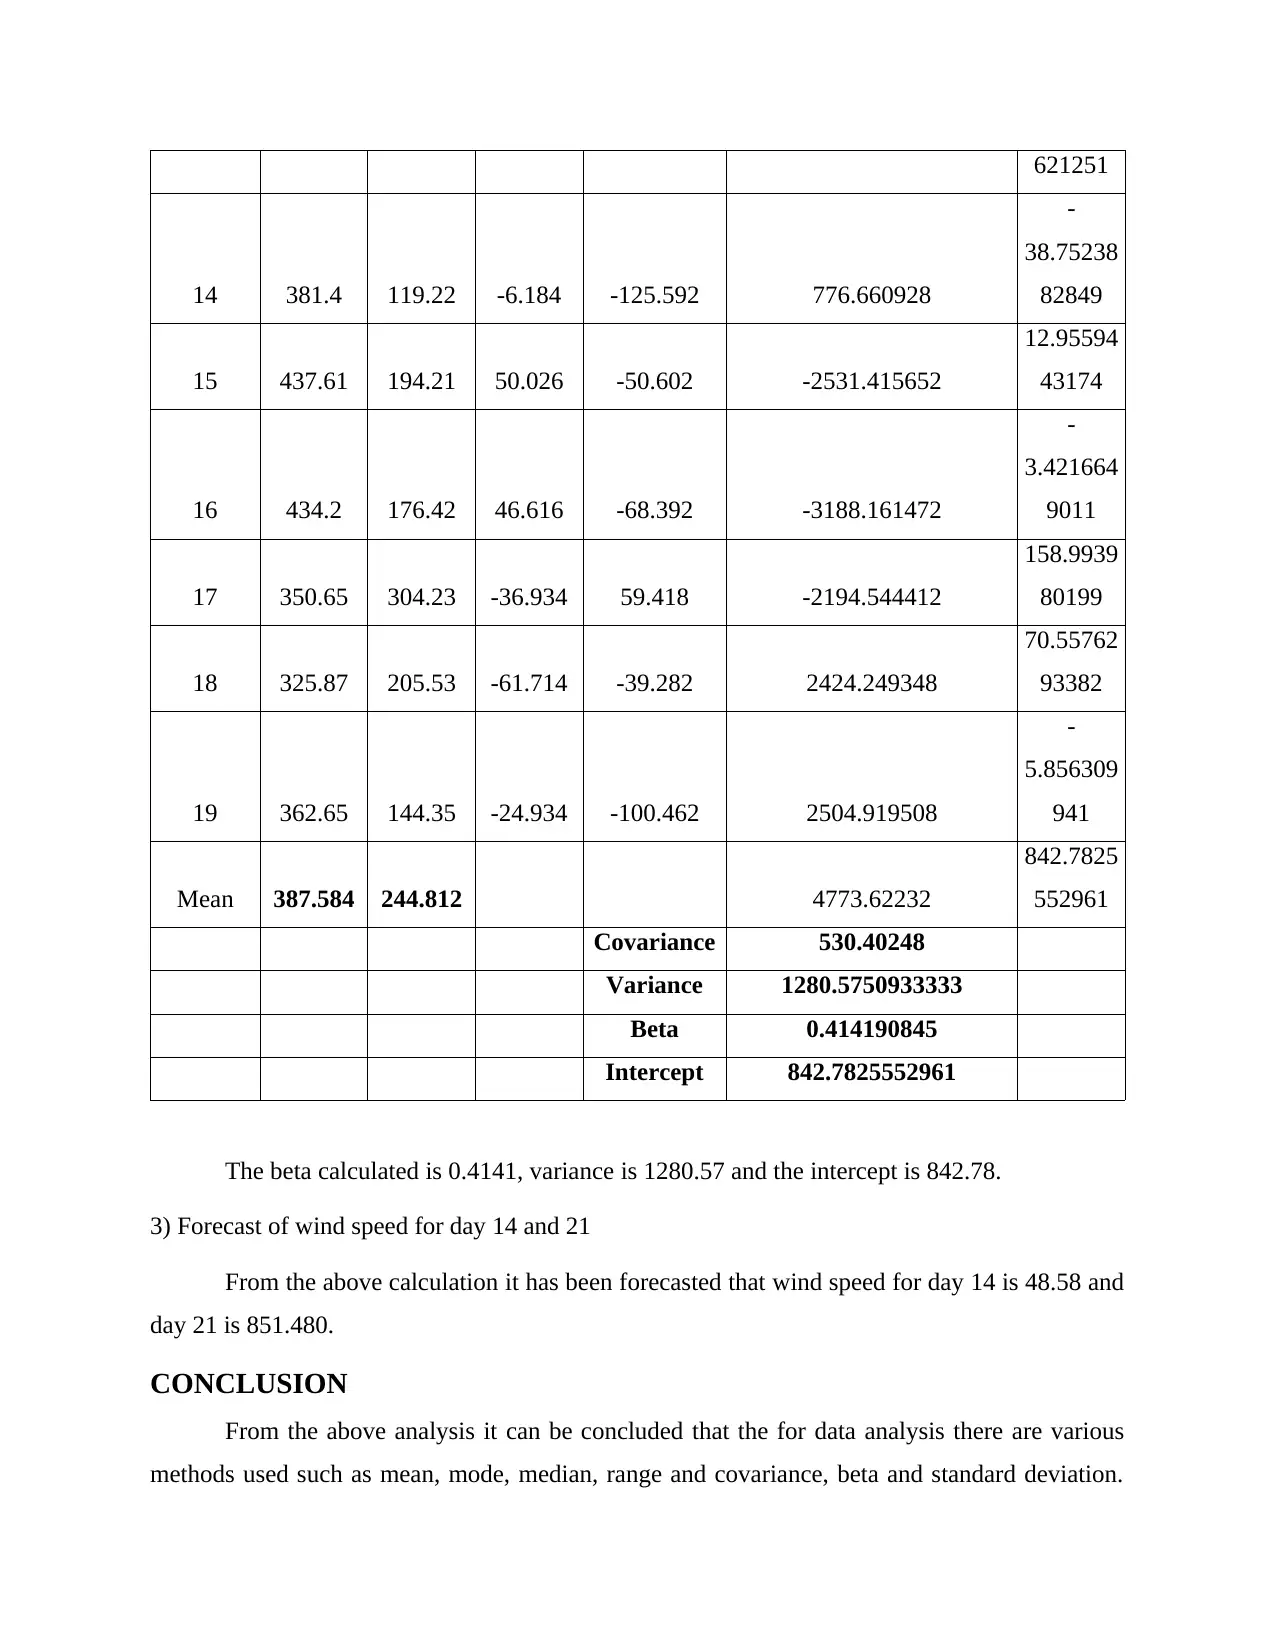
This report presents a comprehensive analysis of London wind speed data collected over ten days. The analysis begins with the presentation of data in tabular and graphical forms, including scattered and bar charts. It then proceeds to calculate key statistical measures such as mean, mode, median, range, and standard deviation to understand the central tendencies and dispersion of the data. Furthermore, the report delves into linear forecasting, providing a step-by-step calculation of the forecasting model, including the determination of covariance, beta, and intercept values. The report forecasts wind speeds for specific days, and concludes with a summary of the findings and their implications for data analysis. References to relevant books and journals are also included.
Document Page
NUMERACY AND DATA
ANALYSIS
tabler-icon-diamond-filled.svg

Secure Best Marks with AI Grader

Need help grading? Try our AI Grader for instant feedback on your assignments.
Document Page
Table of Contents
INTRODUCTION ..........................................................................................................................3
Data in tabular form....................................................................................................................3
Presentation of data in graphical form........................................................................................3
Calculation of the following values............................................................................................5
Calculation of linear forecasting model......................................................................................7
REFERENCES................................................................................................................................9
Document Page
INTRODUCTION
Numeracy and data analysis is a process of collecting, analysing and evaluating data with
the help of different statistical tools (Huck, 2015). It is useful for discovering useful information
which is used by management for decision making. There are different methods used for data
analysis such as data mining, data visualisation, text analytics and business intelligence. In the
present report, 10 days wind speed of London was collected and analysed. The data is presented
in the tabular form and graphical form. Further report also contain the the calculation of mean,
mode, median, range and standard deviation from the collected data. Lastly report also includes
the calculation of linear forecasting with the help of equation.
Data in tabular form
Wind speed for 10 days of London is collected and presented in the tabular form as
follows:
Serial no. Days Sum of Temperature Sum of Wind Speed
1 10 372.88 166.99
2 11 398.66 469.82
3 12 407.1 368.56
4 13 404.82 298.79
5 14 381.4 119.22
6 15 437.61 194.21
7 16 434.2 176.42
8 17 350.65 304.23
9 18 325.87 205.53
10 19 362.65 144.35
Grand Total 3875.84 2448.12
Presentation of data in graphical form
Scattered chart
This chart uses dots top represent the relation between the data. This type of chart is
generally used when there is 2 variables in the data. There can be 2 types of correlation between
the data i.e. positive and negative. Positive relation occurs when one variable of the data
Document Page
increases with the increase of another variable. Negative relation occurs when one variable
increases and the other variable decreases from the data set.
1 2 3 4 5 6 7 8 9 10
0
50
100
150
200
250
300
350
400
450
500
Sum of Temperature
Sum of Wind Speed
Bar graph
This type of graph represents the comparison between the data with respect to change in
time. The bars is plotted both vertically and horizontally. The height of the bar graph represents
the frequency of corresponding observations.
tabler-icon-diamond-filled.svg

Secure Best Marks with AI Grader

Need help grading? Try our AI Grader for instant feedback on your assignments.
Document Page
1 2 3 4 5 6 7 8 9 10 11
0
500
1000
1500
2000
2500
3000
3500
4000
Sum of Temperature
Sum of Wind Speed
Calculation of the following values
MEAN
Mean is a statistical distribution or arithmetic average of range, it is calculated by
dividing total of values by number of values. It is one of the most common and best measure to
calculate the mid-point. In simple words it is an average of total number of values. It is extracted
by the central tendency of data. Statistical mean main aim is to include every data and take out
the average of it. It is beneficial for statistical measurement and data interpretation
(Goshvarpour, Abbasi and Goshvarpour, 2015).
MODE
It is defined as the most repeated value in the data set, or it is most likely to appear. It is
calculated by arranging the data in order to count the frequency, the highest number of data
occurring will be the mode of that data set. Distribution of two modes id known as bimodal,
distribution of three modes is called trimodal (Luo, Wan, Liu and Tong, 2018).
MEDIAN
Median is defined as the middle number in the data set. It is one of the way to determine
the average of the data set. If the data set is odd then first arrange the data in smallest to largest
form, there will be median in between and equal numbers on both the sides of median. If the data
set is even then the middle number is median (Tubaiz, N., Shanableh, T. and Assaleh, 2015).
Document Page
RANGE
It is the the difference between the maximum and minimum value. Range is the variance
between 2 extreme points on distribution curve for a continuous random variable. It is calculated
by subtracting lower value from the higher value in the data set.
Range = Higher value – Lower value
STANDARD DEVIATION
It is defines as the dispersion of the data set and it is calculated by square root of the
variance. It is interpreted as higher the variability or dispersion greater is the standard deviation
and magnitude will also be greater (Huck, 2015).
Serial no. Days Sum of Temperature Sum of Wind Speed
1 10 372.88 166.99
2 11 398.66 469.82
3 12 407.1 368.56
4 13 404.82 298.79
5 14 381.4 119.22
6 15 437.61 194.21
7 16 434.2 176.42
8 17 350.65 304.23
9 18 325.87 205.53
10 19 362.65 144.35
Mean 387.58 244.81
Mode - -
Median 390.03 199.87
Document Page
Range 111.74 350.6
Standard
deviation 35.79 112.1
Interpretation: From the above table it is interpreted that mean of temperature shows
that the average temperature during 10 days was 387.58 and wind speed shows that the average
rate of speed was 244.81 in last 10 days. Moreover it is interpreted that there is no repeatation of
value in both the variables thus there is no mode. Median for temperature is 390.03 which states
that there is more or less evenly distributed and for wind speed it is 199.87 which states that the
data is not evenly distributed. Further from the table it is interpreted that range of temperature in
111.74 and for wind speed the range is 350.6 it is the interval between the variable. Standards
deviation of temperature is 35.79, it is interpreted that there is very high deviation and in case of
wind speed it is 112.1 which also shows a low deviation.
tabler-icon-diamond-filled.svg

Paraphrase This Document

Need a fresh take? Get an instant paraphrase of this document with our AI Paraphraser
Document Page
Calculation of linear forecasting model
1) Steps to calculate M value
Days
Sum of
Temperatu
re
Sum of Wind
Speed X-Average Y-Average X-Average*Y-Average
10 372.88 166.99 -14.704 -77.822 1144.294688
11 398.66 469.82 11.076 225.008 2492.188608
12 407.1 368.56 19.516 123.748 2415.065968
13 404.82 298.79 17.236 53.978 930.364808
14 381.4 119.22 -6.184 -125.592 776.660928
15 437.61 194.21 50.026 -50.602 -2531.415652
16 434.2 176.42 46.616 -68.392 -3188.161472
17 350.65 304.23 -36.934 59.418 -2194.544412
18 325.87 205.53 -61.714 -39.282 2424.249348
19 362.65 144.35 -24.934 -100.462 2504.919508
Mean 387.584 244.812 4773.62232
Covariance 530.4
The covariance calculated from the above table is 530.4.
2) Steps to calculate C
Days
Sum of
Tempera
ture
Sum of
Wind
Speed
X-
Average Y-Average X-Average*Y-Average Intercept
10 372.88 166.99 -14.704 -77.822 1144.294688
12.54651
77146
11 398.66 469.82 11.076 225.008 2492.188608
304.6986
777303
12 407.1 368.56 19.516 123.748 2415.065968
199.9429
069985
13 404.82 298.79 17.236 53.978 930.364808 131.1172
Document Page
621251
14 381.4 119.22 -6.184 -125.592 776.660928
-
38.75238
82849
15 437.61 194.21 50.026 -50.602 -2531.415652
12.95594
43174
16 434.2 176.42 46.616 -68.392 -3188.161472
-
3.421664
9011
17 350.65 304.23 -36.934 59.418 -2194.544412
158.9939
80199
18 325.87 205.53 -61.714 -39.282 2424.249348
70.55762
93382
19 362.65 144.35 -24.934 -100.462 2504.919508
-
5.856309
941
Mean 387.584 244.812 4773.62232
842.7825
552961
Covariance 530.40248
Variance 1280.5750933333
Beta 0.414190845
Intercept 842.7825552961
The beta calculated is 0.4141, variance is 1280.57 and the intercept is 842.78.
3) Forecast of wind speed for day 14 and 21
From the above calculation it has been forecasted that wind speed for day 14 is 48.58 and
day 21 is 851.480.
CONCLUSION
From the above analysis it can be concluded that the for data analysis there are various
methods used such as mean, mode, median, range and covariance, beta and standard deviation.
chevron_up_icon
1 out of 9
circle_padding
hide_on_mobile
zoom_out_icon
[object Object]