Numeracy and Data Analysis Report: Calculations and Data Visualization
VerifiedAdded on  2023/06/10
|11
|719
|488
Report
AI Summary
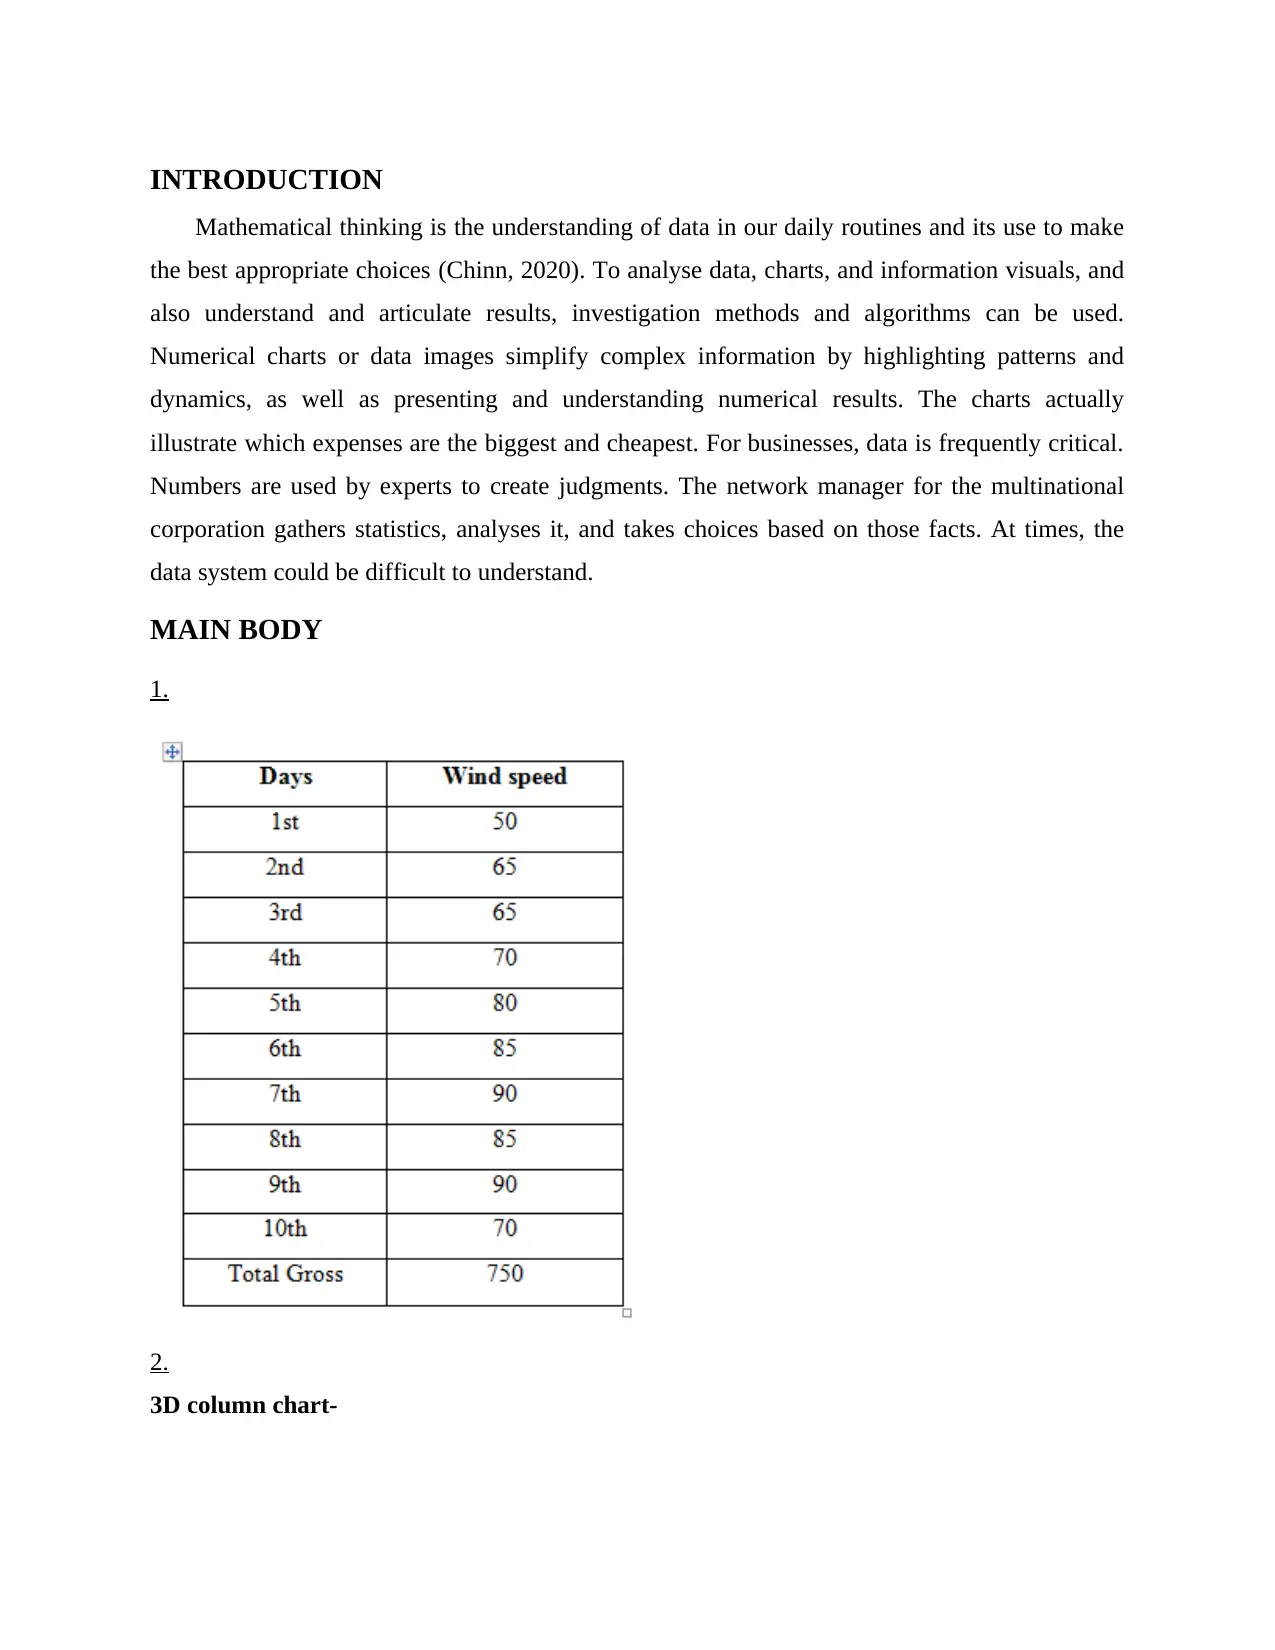
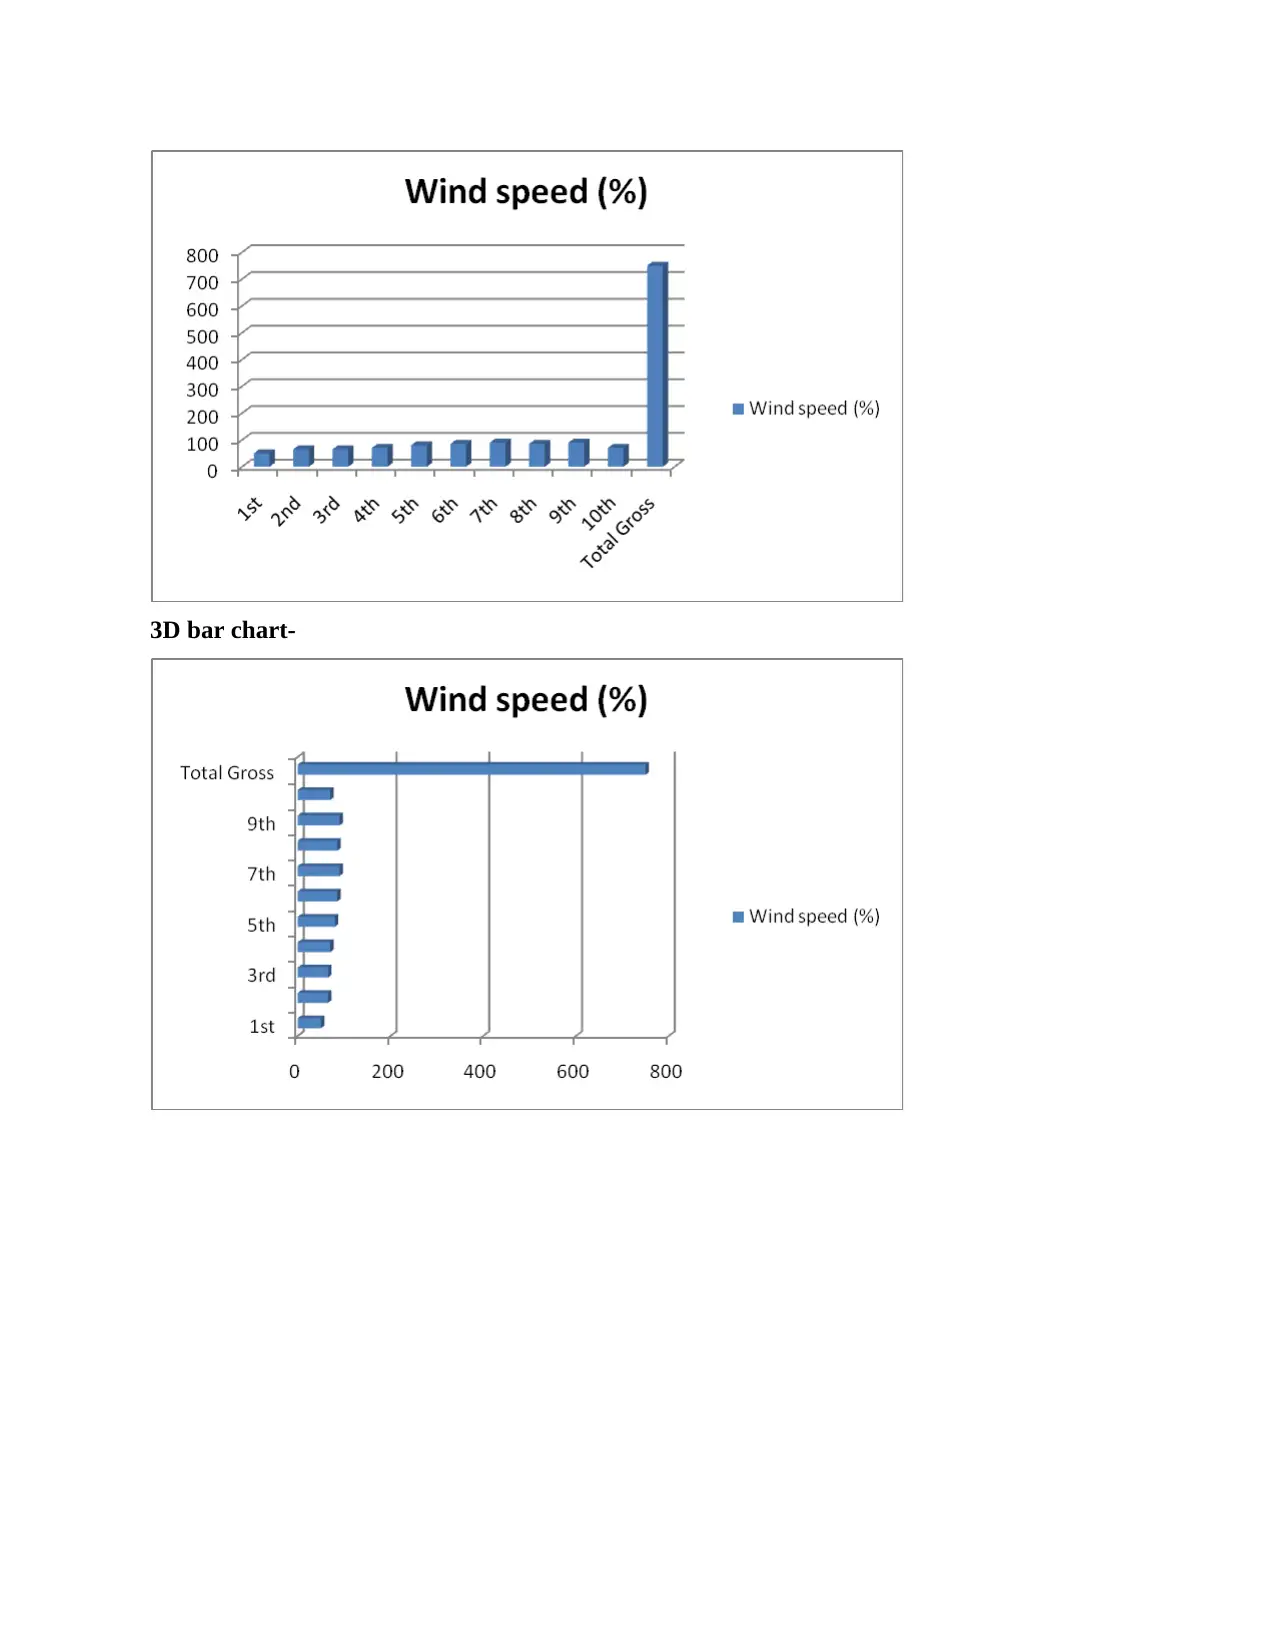
This report delves into the realm of data analysis, providing a comprehensive overview of various analytical methods. It commences with an introduction to mathematical thinking and its significance in making informed decisions using data. The main body of the report encompasses the application of statistical measures such as mean, mode, median, range, and standard deviation to a given dataset. The report also incorporates data visualization techniques, including 3D column and bar charts, to enhance understanding. The conclusion summarizes the findings, emphasizing the practical application of these methods. The report includes references to academic sources, underscoring the theoretical foundation of the analysis. The report highlights the importance of data analysis for businesses and decision-making processes, demonstrating how data can be used to create judgments and analyse information.

Numeracy and Data
Analysis
Analysis
Paraphrase This Document
Need a fresh take? Get an instant paraphrase of this document with our AI Paraphraser

Contents
Contents...........................................................................................................................................2
INTRODUCTION...........................................................................................................................1
MAIN BODY..................................................................................................................................1
1...................................................................................................................................................1
2...................................................................................................................................................1
3...................................................................................................................................................3
Mode............................................................................................................................................3
Median.........................................................................................................................................4
Range...........................................................................................................................................4
Standard Deviation......................................................................................................................5
4...................................................................................................................................................6
CONCLUSION................................................................................................................................8
REFERENCES................................................................................................................................9

INTRODUCTION
Mathematical thinking is the understanding of data in our daily routines and its use to make
the best appropriate choices (Chinn, 2020). To analyse data, charts, and information visuals, and
also understand and articulate results, investigation methods and algorithms can be used.
Numerical charts or data images simplify complex information by highlighting patterns and
dynamics, as well as presenting and understanding numerical results. The charts actually
illustrate which expenses are the biggest and cheapest. For businesses, data is frequently critical.
Numbers are used by experts to create judgments. The network manager for the multinational
corporation gathers statistics, analyses it, and takes choices based on those facts. At times, the
data system could be difficult to understand.
MAIN BODY
1.
2.
3D column chart-
⊘ This is a preview!⊘
Do you want full access?
Subscribe today to unlock all pages.

Trusted by 1+ million students worldwide

3D bar chart-
Paraphrase This Document
Need a fresh take? Get an instant paraphrase of this document with our AI Paraphraser

3.
As per the values in the preceding table, the mean is 75, as calculated by summing the
information and then dividing it by the total number of amounts available in the dataset
(Espinosa-Oviedo, 2020).
Mode
Given that there are already four modes, 65, 70, 85, and 90, it is acceptable to presume that
a data sequence could contain no mode or multiple modes depending on the data presented.

Median
The median among those statistics that are presented above in a sequential order, that
usually be regarded the data's midpoint, is 75, as per the calculations (Russo, 2019).
Range
Since it was derived by subtracting the lesser value from the greater amount, the data
sequence range after calculations came to be 40.
⊘ This is a preview!⊘
Do you want full access?
Subscribe today to unlock all pages.

Trusted by 1+ million students worldwide

Standard Deviation
Since standard deviation is one of the most important components of any trade or activity,
irrespective of the sector or location wherein the company works, it might be seen from the
accompanying measurements that the standard deviation is 12.44 percentages (Vargas-Solar,
Zechinelli-Martini and Espinosa-Oviedo, 2020).
Paraphrase This Document
Need a fresh take? Get an instant paraphrase of this document with our AI Paraphraser

4.

⊘ This is a preview!⊘
Do you want full access?
Subscribe today to unlock all pages.

Trusted by 1+ million students worldwide

CONCLUSION
As a result of the foregoing, it could be stated that this work demonstrates data analysis
through the use of numerous analytical methods. It also has a section that provides data from the
previous 10 months' wind speed. To explore the data from the database, 2 charts have also been
created. Considering the variables provided at the beginning of this study, the Mean, Median,
Mode, and Range were calculated. On the other side, standard deviation is calculated because it
is the only method of determining the degree of standard variability. This research will then
continue in the 11th and 13th month with the value and relevance of forecasting.
Paraphrase This Document
Need a fresh take? Get an instant paraphrase of this document with our AI Paraphraser

REFERENCES
Books and journals
Chinn, S., 2020. The trouble with maths: A practical guide to helping learners with numeracy
difficulties. Routledge.
Espinosa-Oviedo, J.A., 2020. Enacting Data Science Pipelines for Exploring Graphs: From
Libraries to Studios. In ADBIS, TPDL and EDA 2020 Common Workshops and
Doctoral Consortium: International Workshops: DOING, MADEISD, SKG, BBIGAP,
SIMPDA, AIMinScience 2020 and Doctoral Consortium, Lyon, France, August 25-27,
2020, Proceedings (Vol. 1260, p. 271). Springer Nature.
Russo, J.A., 2019. The Impact of a Short Test-Wiseness Intervention on Standardised Numeracy
Assessment Scores: A Cautionary Tale about Using NAPLAN Growth Data to Evaluate
Primary Schools. Networks: An Online Journal for Teacher Research, 21(2), p.5.
Vargas-Solar, G., Zechinelli-Martini, J.L. and Espinosa-Oviedo, J.A., 2020, August. Enacting
data science pipelines for exploring graphs: from libraries to studios. In ADBIS, TPDL
and EDA 2020 Common Workshops and Doctoral Consortium (pp. 271-280). Springer,
Cham.
1 out of 11
Related Documents

Your All-in-One AI-Powered Toolkit for Academic Success.
 +13062052269
info@desklib.com
Available 24*7 on WhatsApp / Email
Unlock your academic potential
Copyright © 2020–2025 A2Z Services. All Rights Reserved. Developed and managed by ZUCOL.