Numeracy and Data Analysis: Data Analysis and Forecasting Report
VerifiedAdded on 2023/01/07
|9
|1360
|70
Report
AI Summary
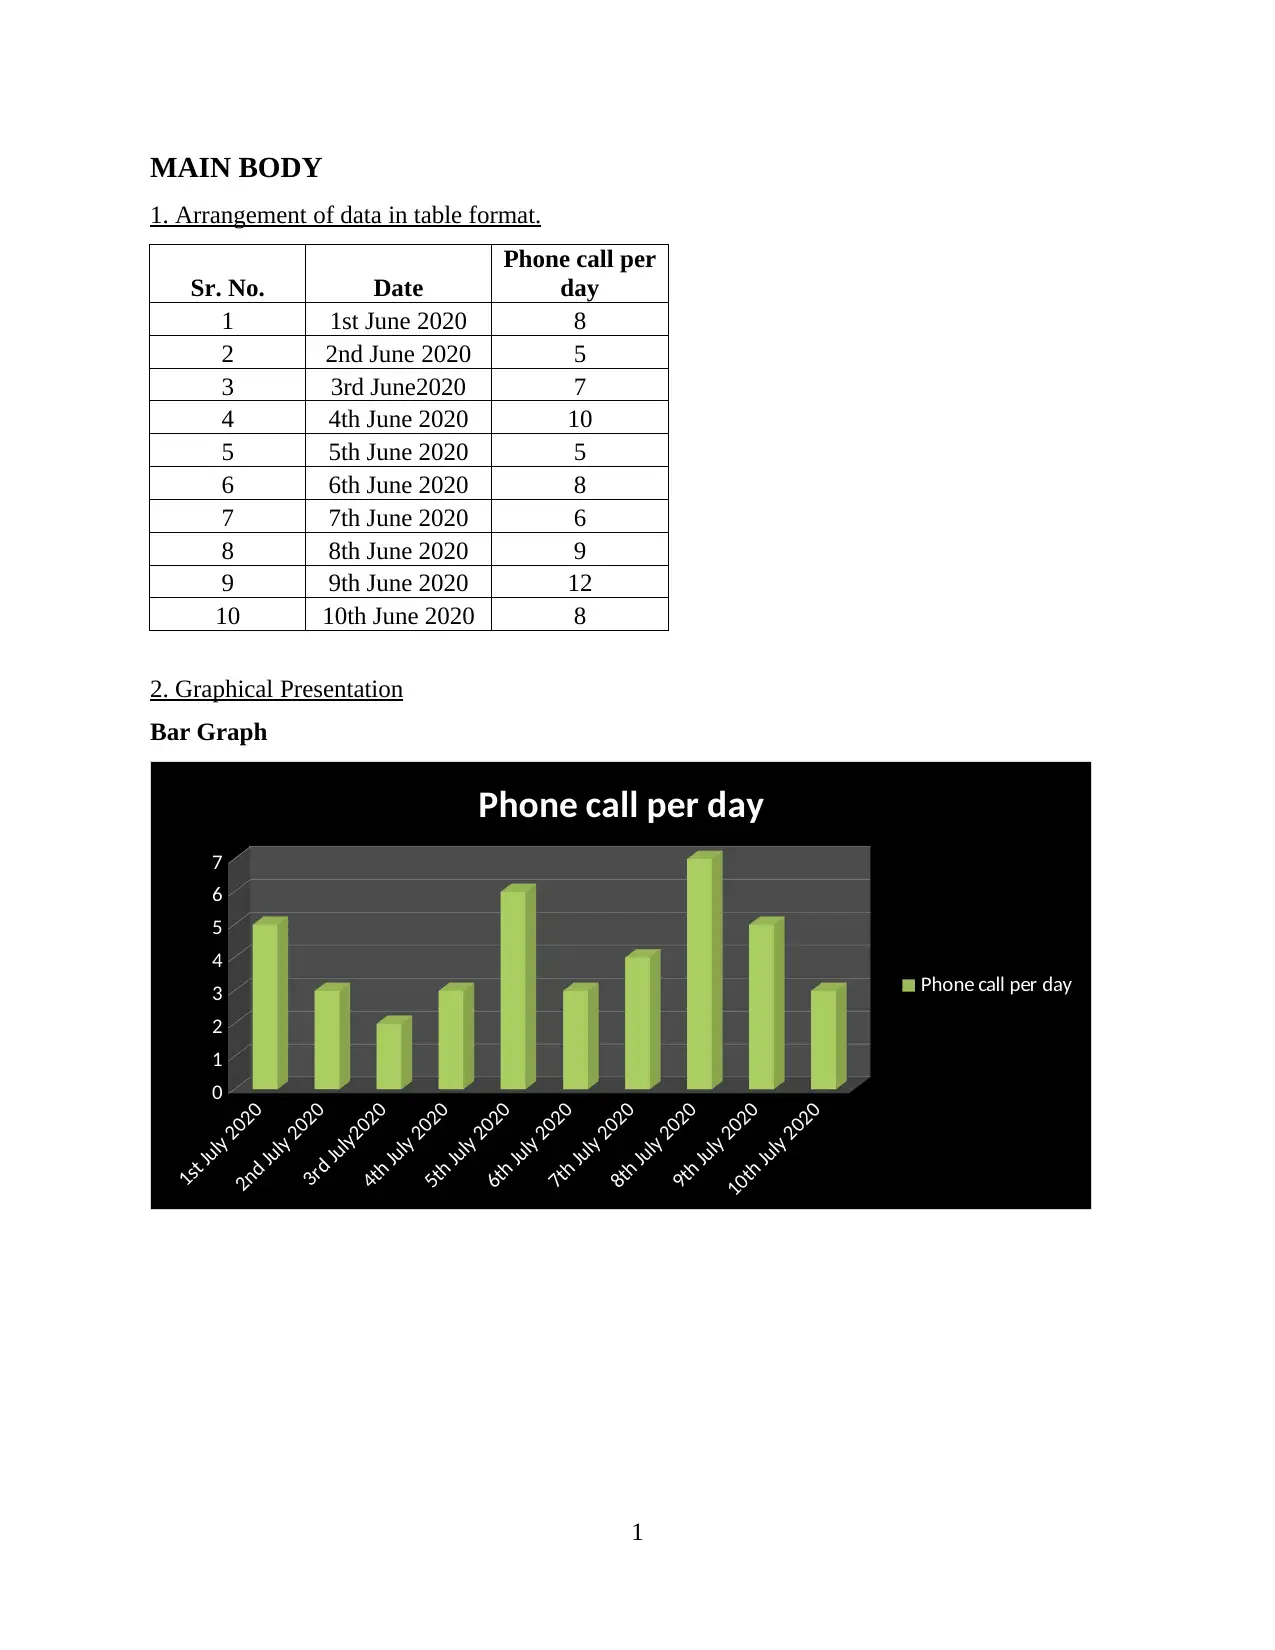
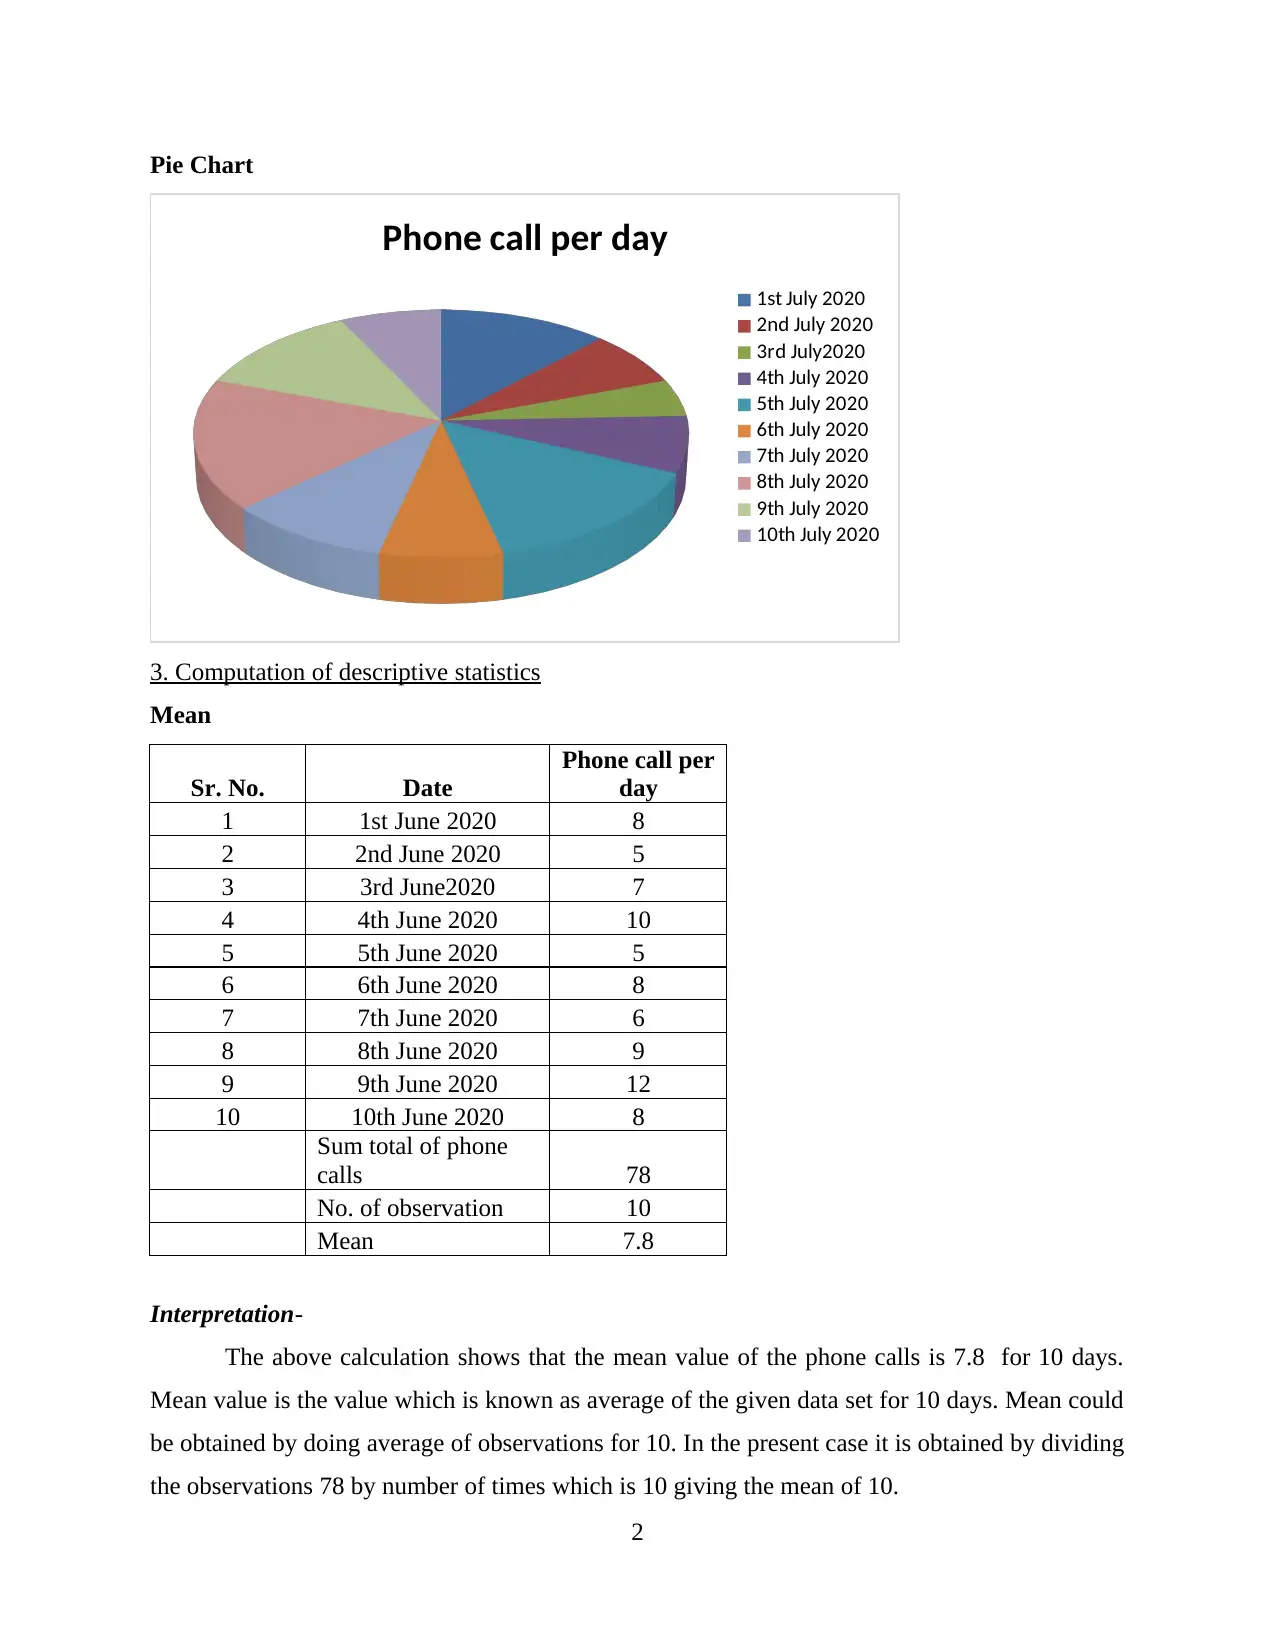
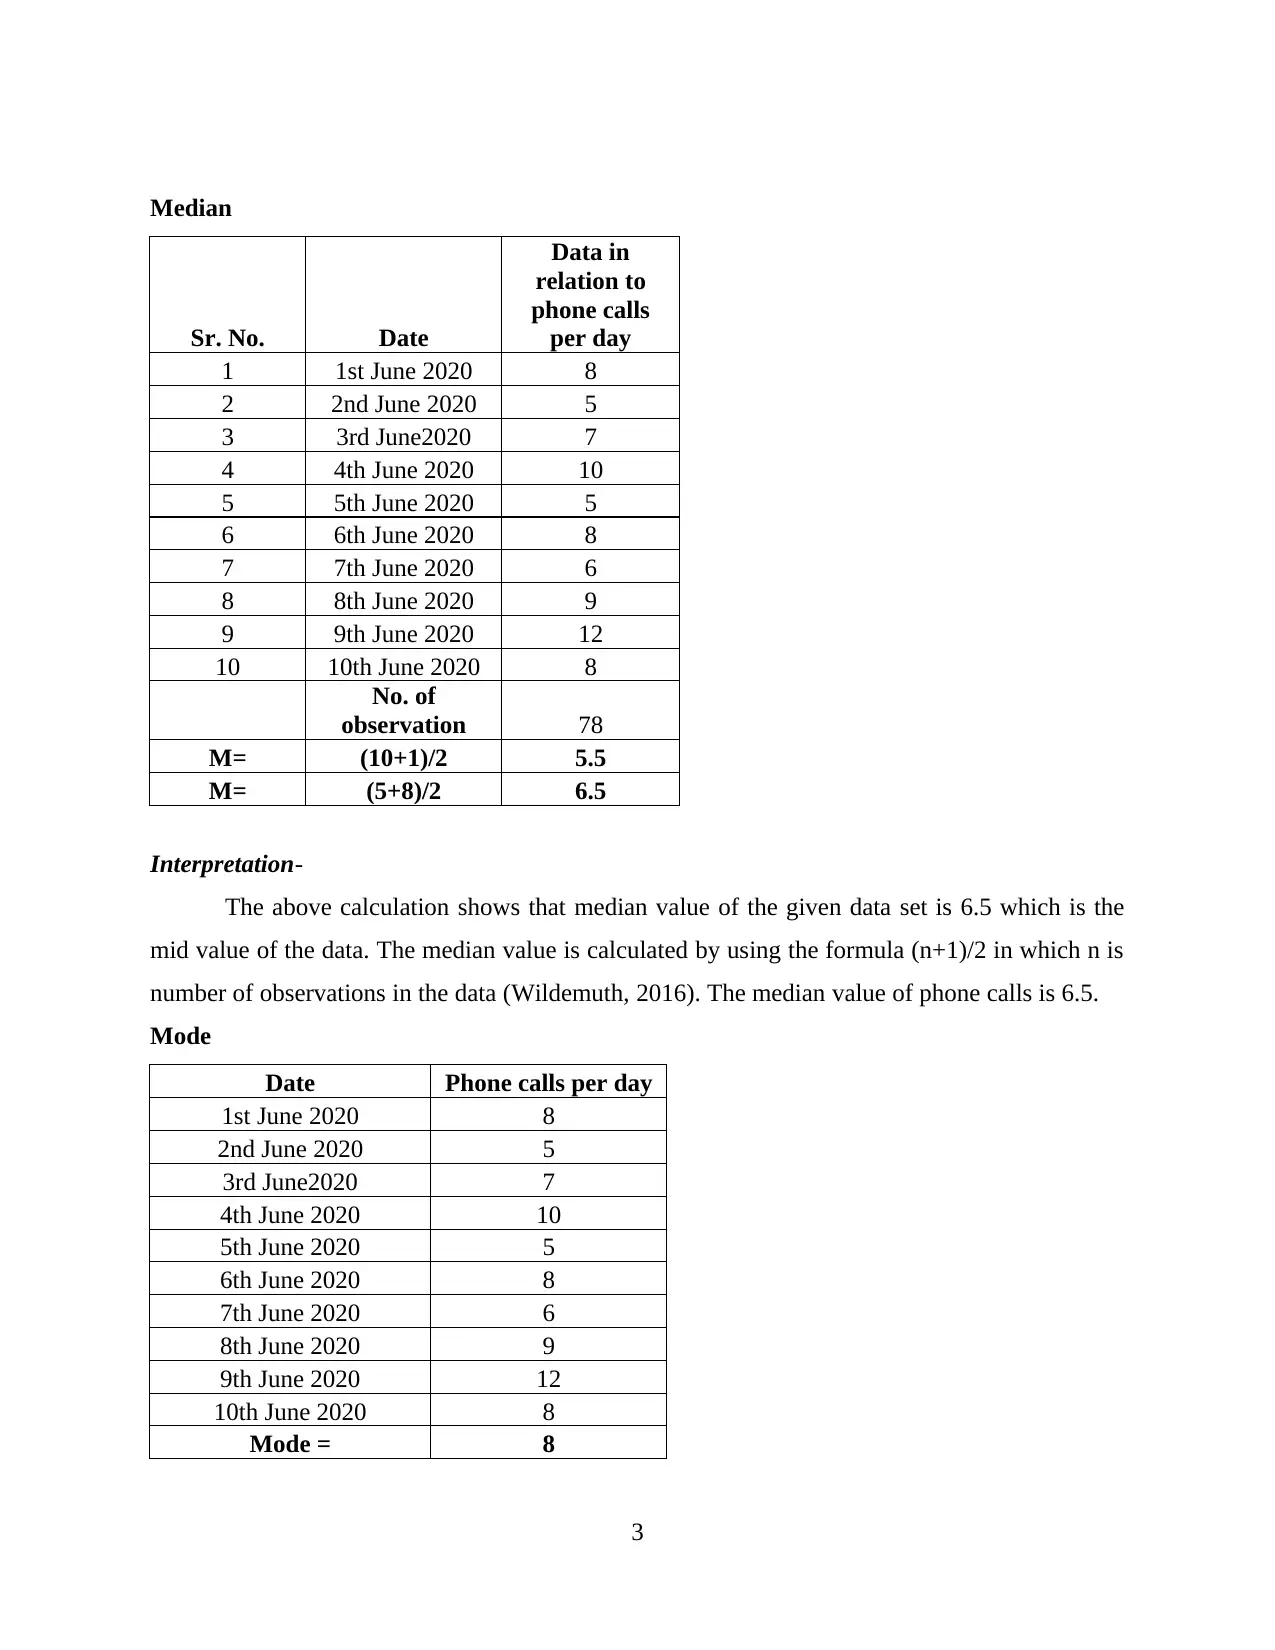
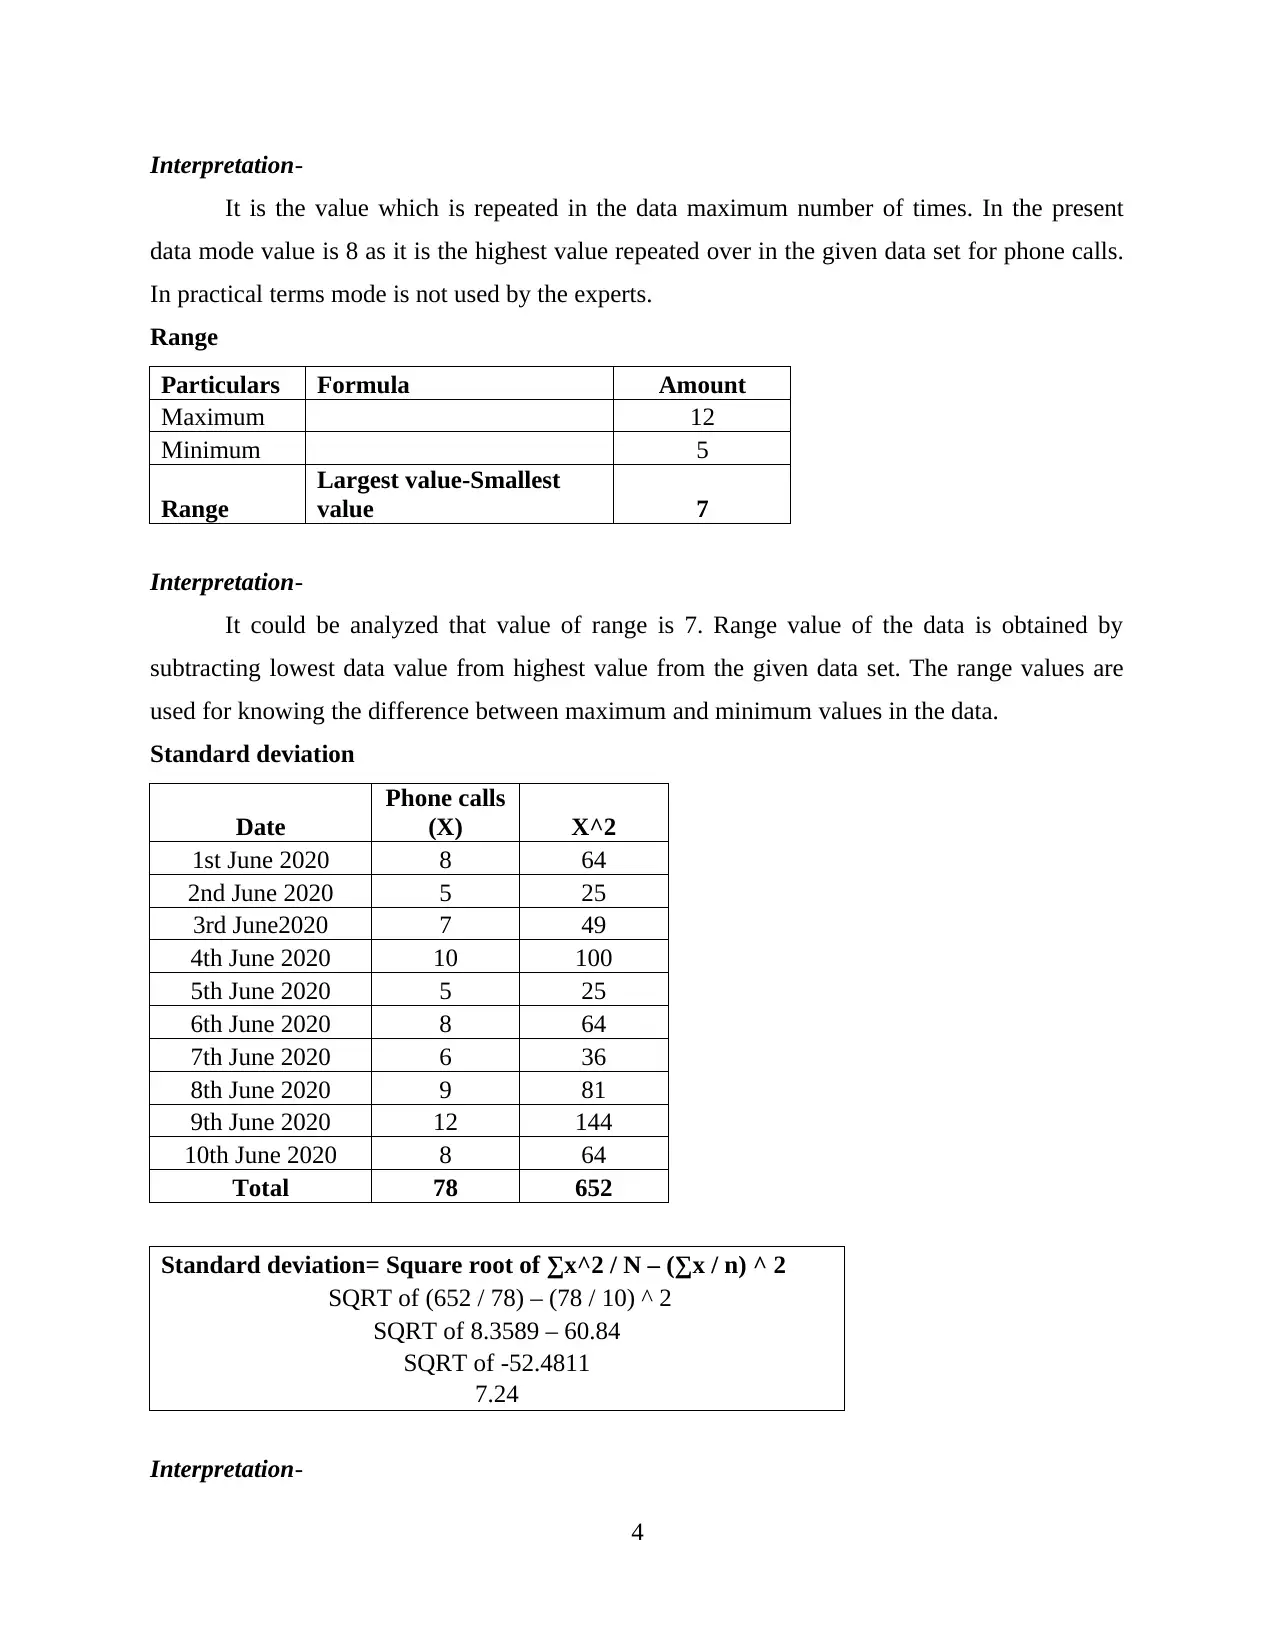
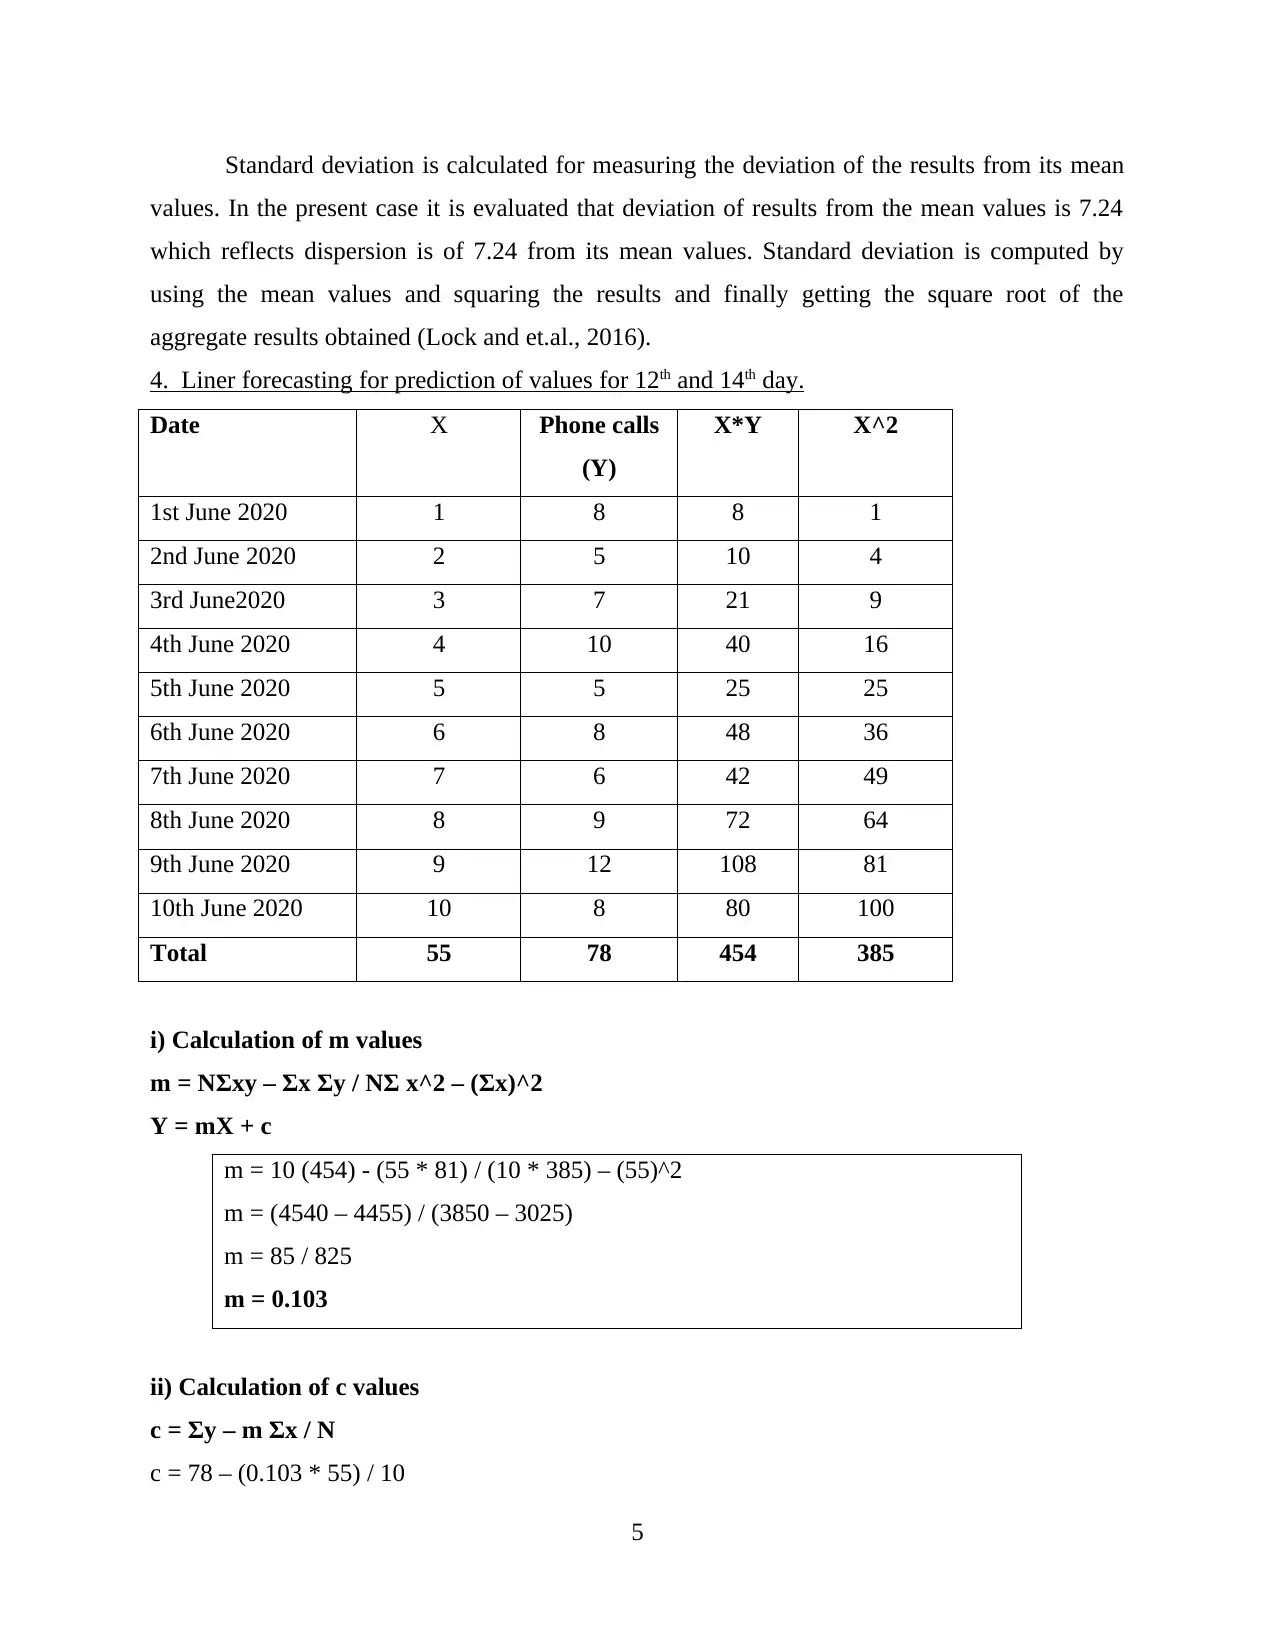
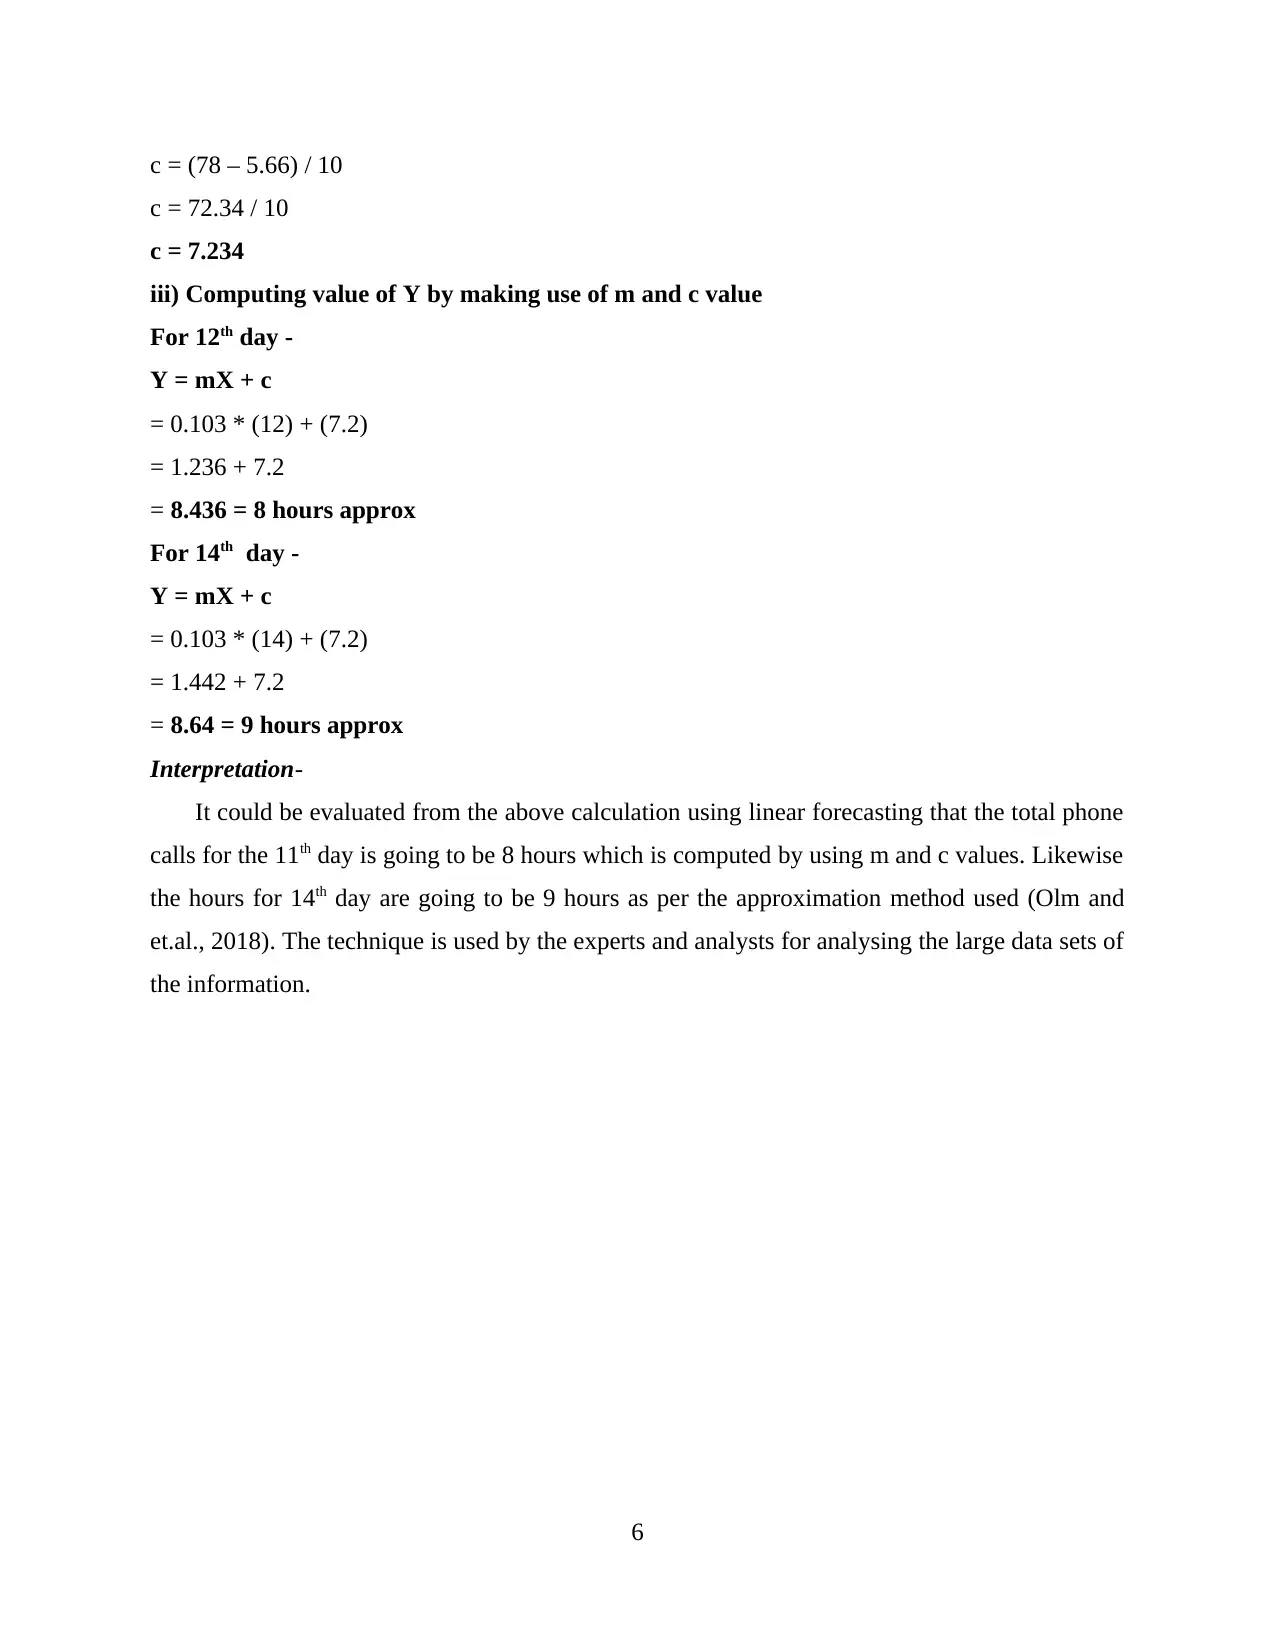
This report provides a detailed analysis of data related to phone calls per day over a ten-day period. The analysis begins with arranging the data in a table format and presenting it graphically using bar and pie charts. Descriptive statistics, including mean, median, mode, range, and standard deviatio...

NUMERACY AND DATA
ANALYSIS
ANALYSIS
Secure Best Marks with AI Grader
Need help grading? Try our AI Grader for instant feedback on your assignments.

TABLE OF CONTENTS
TABLE OF CONTENTS................................................................................................................2
MAIN BODY..................................................................................................................................1
1. Arrangement of data in table format........................................................................................1
2. Graphical Presentation.............................................................................................................1
3. Computation of descriptive statistics.......................................................................................2
4. Liner forecasting for prediction of values for 12th and 14th day..............................................5
REFERENCES................................................................................................................................7

MAIN BODY
1. Arrangement of data in table format.
Sr. No. Date
Phone call per
day
1 1st June 2020 8
2 2nd June 2020 5
3 3rd June2020 7
4 4th June 2020 10
5 5th June 2020 5
6 6th June 2020 8
7 7th June 2020 6
8 8th June 2020 9
9 9th June 2020 12
10 10th June 2020 8
2. Graphical Presentation
Bar Graph
1st July 2020
2nd July 2020
3rd July2020
4th July 2020
5th July 2020
6th July 2020
7th July 2020
8th July 2020
9th July 2020
10th July 2020
0
1
2
3
4
5
6
7
Phone call per day
Phone call per day
1

Pie Chart
Phone call per day
1st July 2020
2nd July 2020
3rd July2020
4th July 2020
5th July 2020
6th July 2020
7th July 2020
8th July 2020
9th July 2020
10th July 2020
3. Computation of descriptive statistics
Mean
Sr. No. Date
Phone call per
day
1 1st June 2020 8
2 2nd June 2020 5
3 3rd June2020 7
4 4th June 2020 10
5 5th June 2020 5
6 6th June 2020 8
7 7th June 2020 6
8 8th June 2020 9
9 9th June 2020 12
10 10th June 2020 8
Sum total of phone
calls 78
No. of observation 10
Mean 7.8
Interpretation-
The above calculation shows that the mean value of the phone calls is 7.8 for 10 days.
Mean value is the value which is known as average of the given data set for 10 days. Mean could
be obtained by doing average of observations for 10. In the present case it is obtained by dividing
the observations 78 by number of times which is 10 giving the mean of 10.
2
Secure Best Marks with AI Grader
Need help grading? Try our AI Grader for instant feedback on your assignments.

Median
Sr. No. Date
Data in
relation to
phone calls
per day
1 1st June 2020 8
2 2nd June 2020 5
3 3rd June2020 7
4 4th June 2020 10
5 5th June 2020 5
6 6th June 2020 8
7 7th June 2020 6
8 8th June 2020 9
9 9th June 2020 12
10 10th June 2020 8
No. of
observation 78
M= (10+1)/2 5.5
M= (5+8)/2 6.5
Interpretation-
The above calculation shows that median value of the given data set is 6.5 which is the
mid value of the data. The median value is calculated by using the formula (n+1)/2 in which n is
number of observations in the data (Wildemuth, 2016). The median value of phone calls is 6.5.
Mode
Date Phone calls per day
1st June 2020 8
2nd June 2020 5
3rd June2020 7
4th June 2020 10
5th June 2020 5
6th June 2020 8
7th June 2020 6
8th June 2020 9
9th June 2020 12
10th June 2020 8
Mode = 8
3

Interpretation-
It is the value which is repeated in the data maximum number of times. In the present
data mode value is 8 as it is the highest value repeated over in the given data set for phone calls.
In practical terms mode is not used by the experts.
Range
Particulars Formula Amount
Maximum 12
Minimum 5
Range
Largest value-Smallest
value 7
Interpretation-
It could be analyzed that value of range is 7. Range value of the data is obtained by
subtracting lowest data value from highest value from the given data set. The range values are
used for knowing the difference between maximum and minimum values in the data.
Standard deviation
Date
Phone calls
(X) X^2
1st June 2020 8 64
2nd June 2020 5 25
3rd June2020 7 49
4th June 2020 10 100
5th June 2020 5 25
6th June 2020 8 64
7th June 2020 6 36
8th June 2020 9 81
9th June 2020 12 144
10th June 2020 8 64
Total 78 652
Standard deviation= Square root of ∑x^2 / N – (∑x / n) ^ 2
SQRT of (652 / 78) – (78 / 10) ^ 2
SQRT of 8.3589 – 60.84
SQRT of -52.4811
7.24
Interpretation-
4

Standard deviation is calculated for measuring the deviation of the results from its mean
values. In the present case it is evaluated that deviation of results from the mean values is 7.24
which reflects dispersion is of 7.24 from its mean values. Standard deviation is computed by
using the mean values and squaring the results and finally getting the square root of the
aggregate results obtained (Lock and et.al., 2016).
4. Liner forecasting for prediction of values for 12th and 14th day.
Date X Phone calls
(Y)
X*Y X^2
1st June 2020 1 8 8 1
2nd June 2020 2 5 10 4
3rd June2020 3 7 21 9
4th June 2020 4 10 40 16
5th June 2020 5 5 25 25
6th June 2020 6 8 48 36
7th June 2020 7 6 42 49
8th June 2020 8 9 72 64
9th June 2020 9 12 108 81
10th June 2020 10 8 80 100
Total 55 78 454 385
i) Calculation of m values
m = NΣxy – Σx Σy / NΣ x^2 – (Σx)^2
Y = mX + c
m = 10 (454) - (55 * 81) / (10 * 385) – (55)^2
m = (4540 – 4455) / (3850 – 3025)
m = 85 / 825
m = 0.103
ii) Calculation of c values
c = Σy – m Σx / N
c = 78 – (0.103 * 55) / 10
5
Paraphrase This Document
Need a fresh take? Get an instant paraphrase of this document with our AI Paraphraser

c = (78 – 5.66) / 10
c = 72.34 / 10
c = 7.234
iii) Computing value of Y by making use of m and c value
For 12th day -
Y = mX + c
= 0.103 * (12) + (7.2)
= 1.236 + 7.2
= 8.436 = 8 hours approx
For 14th day -
Y = mX + c
= 0.103 * (14) + (7.2)
= 1.442 + 7.2
= 8.64 = 9 hours approx
Interpretation-
It could be evaluated from the above calculation using linear forecasting that the total phone
calls for the 11th day is going to be 8 hours which is computed by using m and c values. Likewise
the hours for 14th day are going to be 9 hours as per the approximation method used (Olm and
et.al., 2018). The technique is used by the experts and analysts for analysing the large data sets of
the information.
6

REFERENCES
Books and Journals
Wildemuth, B.M., 2016. Descriptive statistics. Applications of Social Research Methods to
Questions in Information and Library Science, pp.338-47.
Lock, R.H., and et.al., 2016. Statistics: Unlocking the power of data. John Wiley & Sons.
Olm, M., and et.al., 2018. Operative treatment of diabetics with vascular complications:
Secondary data analysis of diagnosis-related groups statistics from 2005 to 2014 in
Germany. Der Chirurg; Zeitschrift fur alle Gebiete der operativen Medizen. 89(7). p.545.
7
1 out of 9
Related Documents

Your All-in-One AI-Powered Toolkit for Academic Success.
+13062052269
info@desklib.com
Available 24*7 on WhatsApp / Email
Unlock your academic potential
© 2024 | Zucol Services PVT LTD | All rights reserved.