Numeracy and Data Analysis Project: Birmingham Humidity Forecasting

Verified

Added on  2023/01/16

|9
|1300
|85
Project
AI Summary
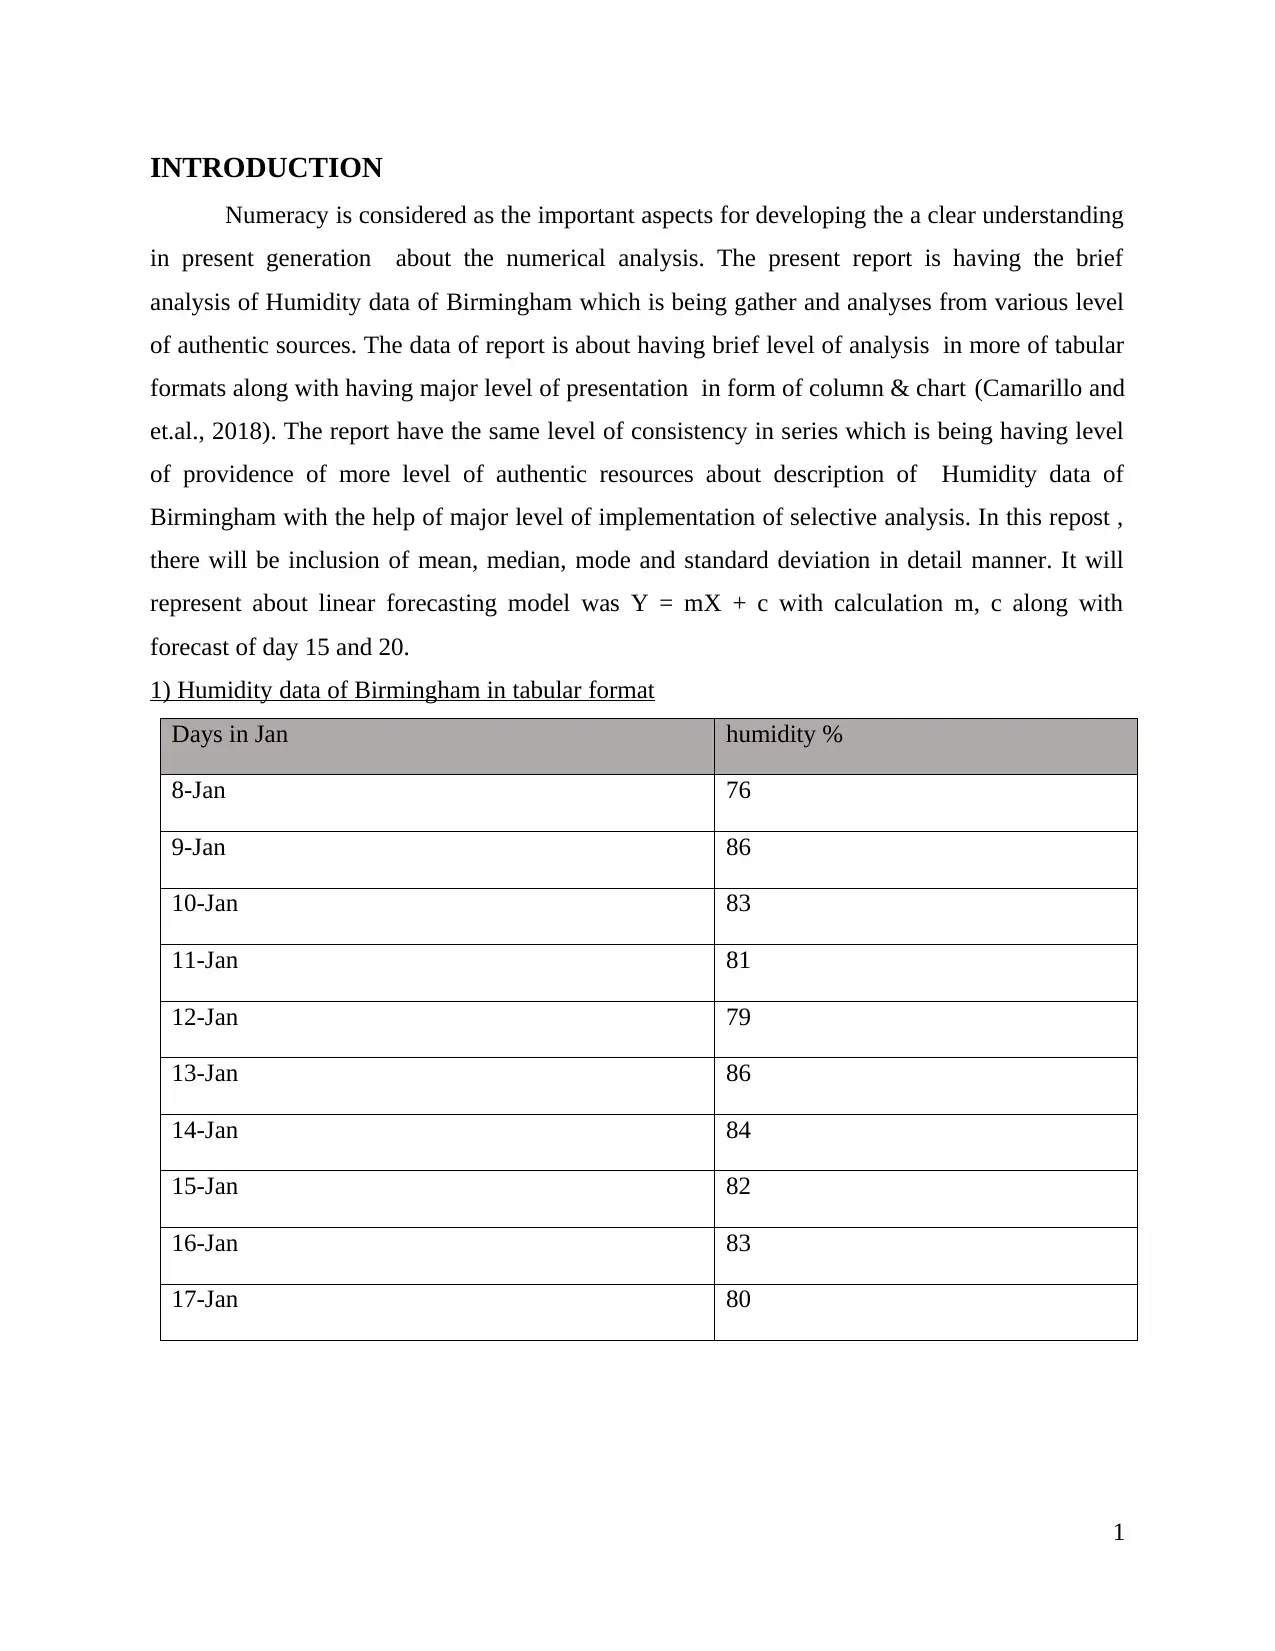
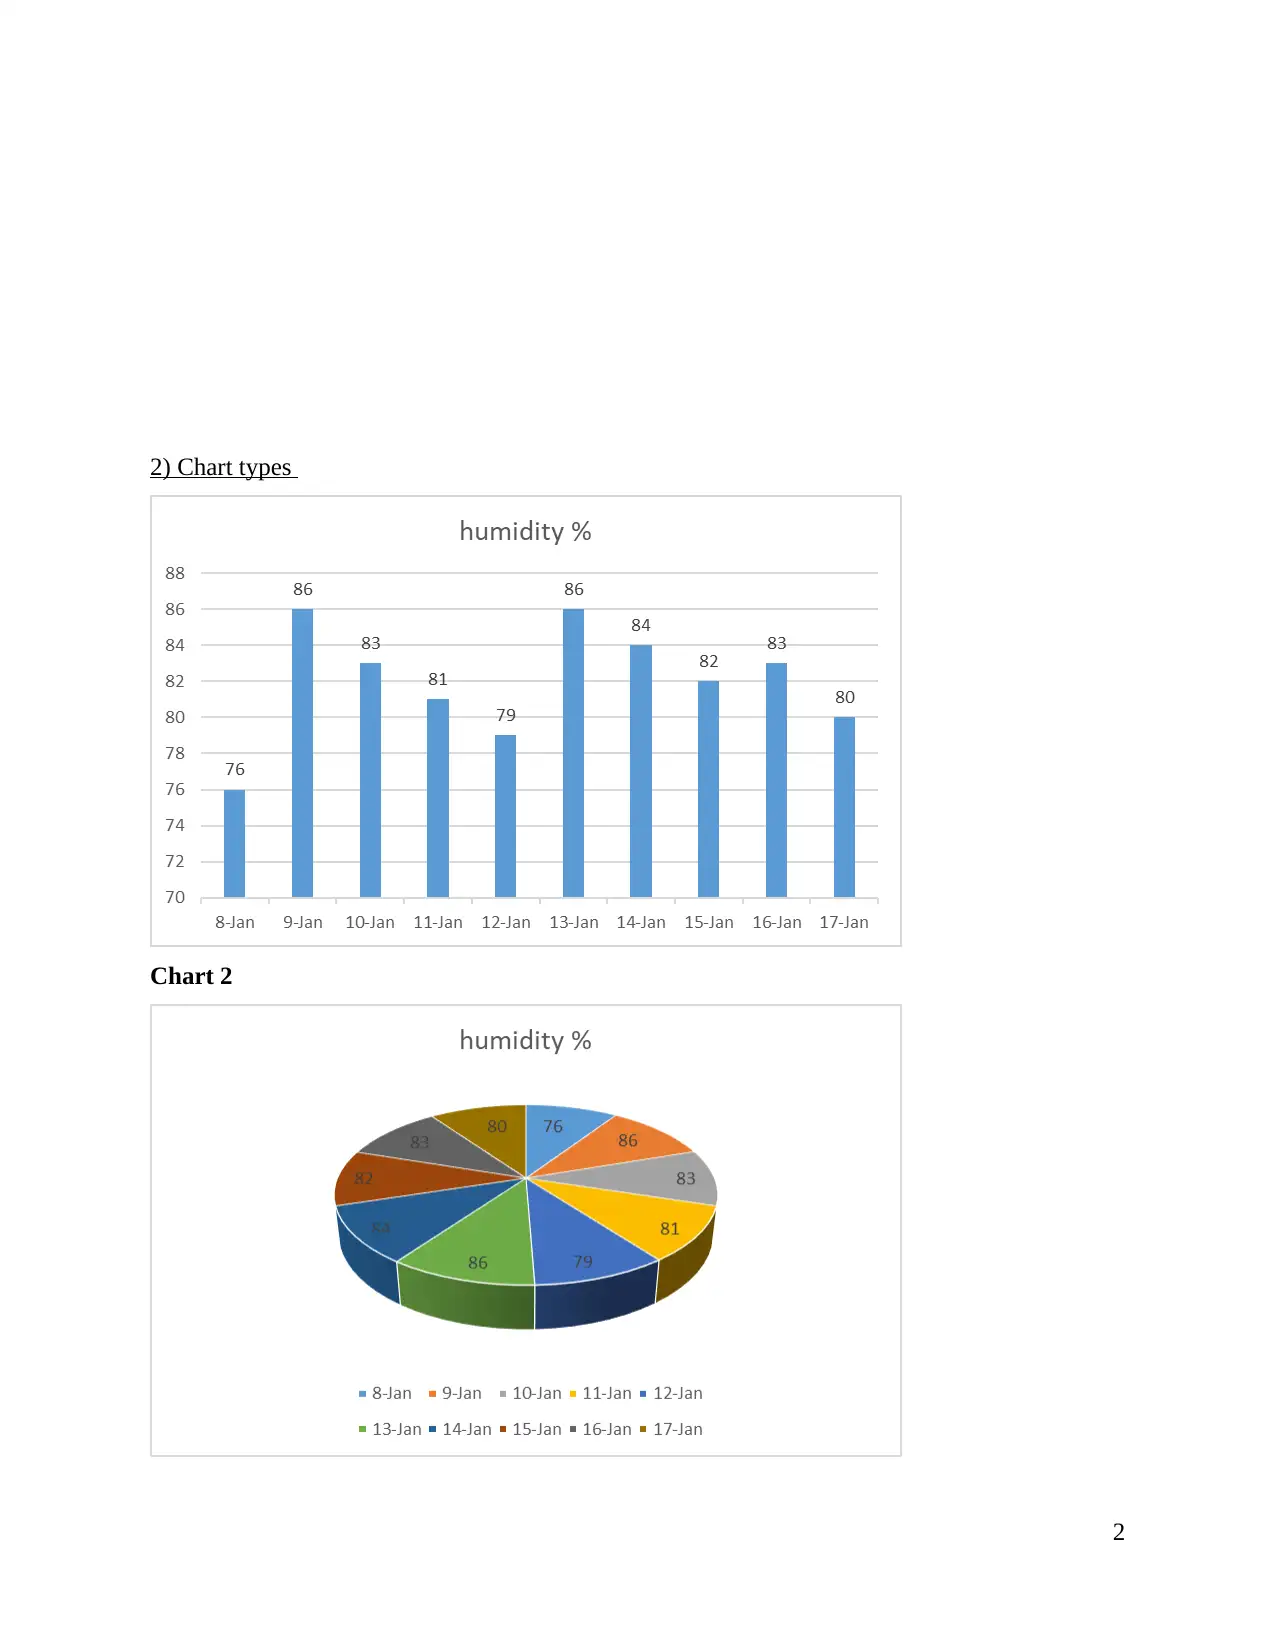
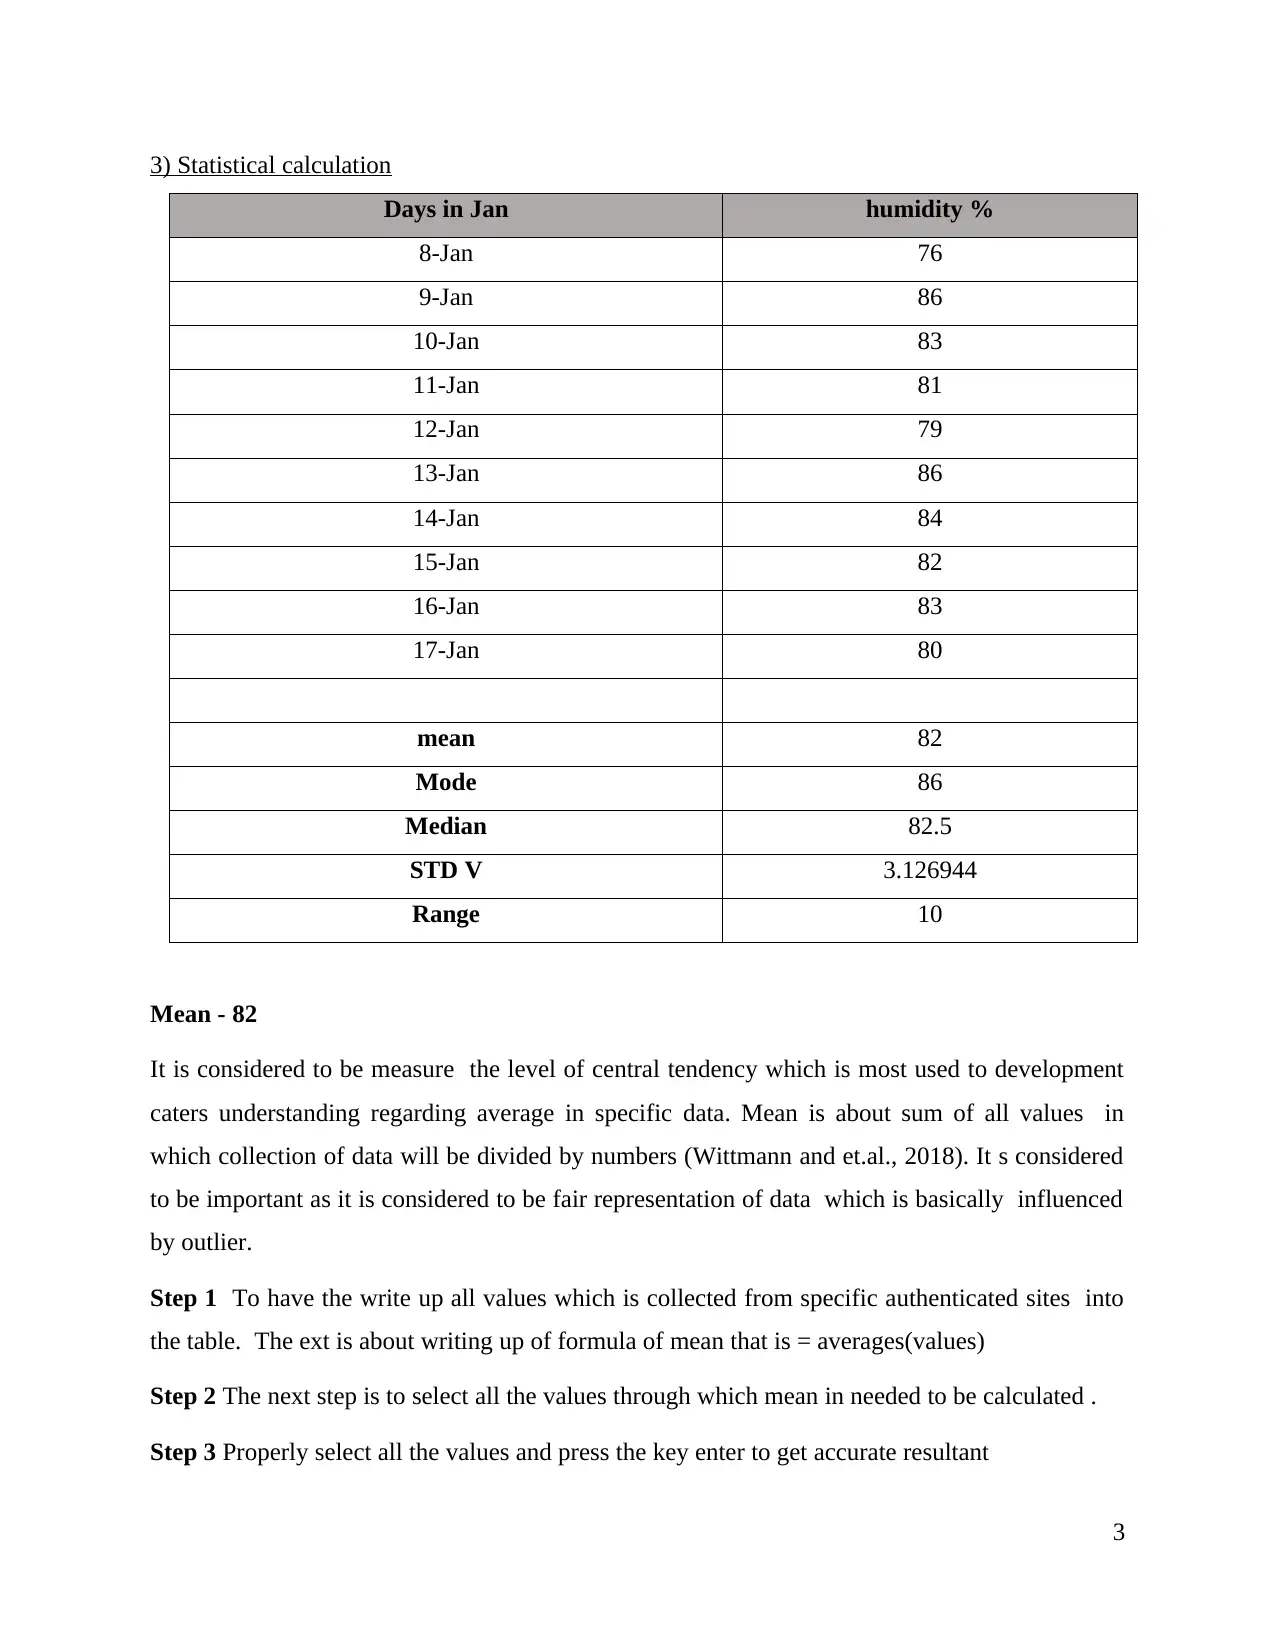
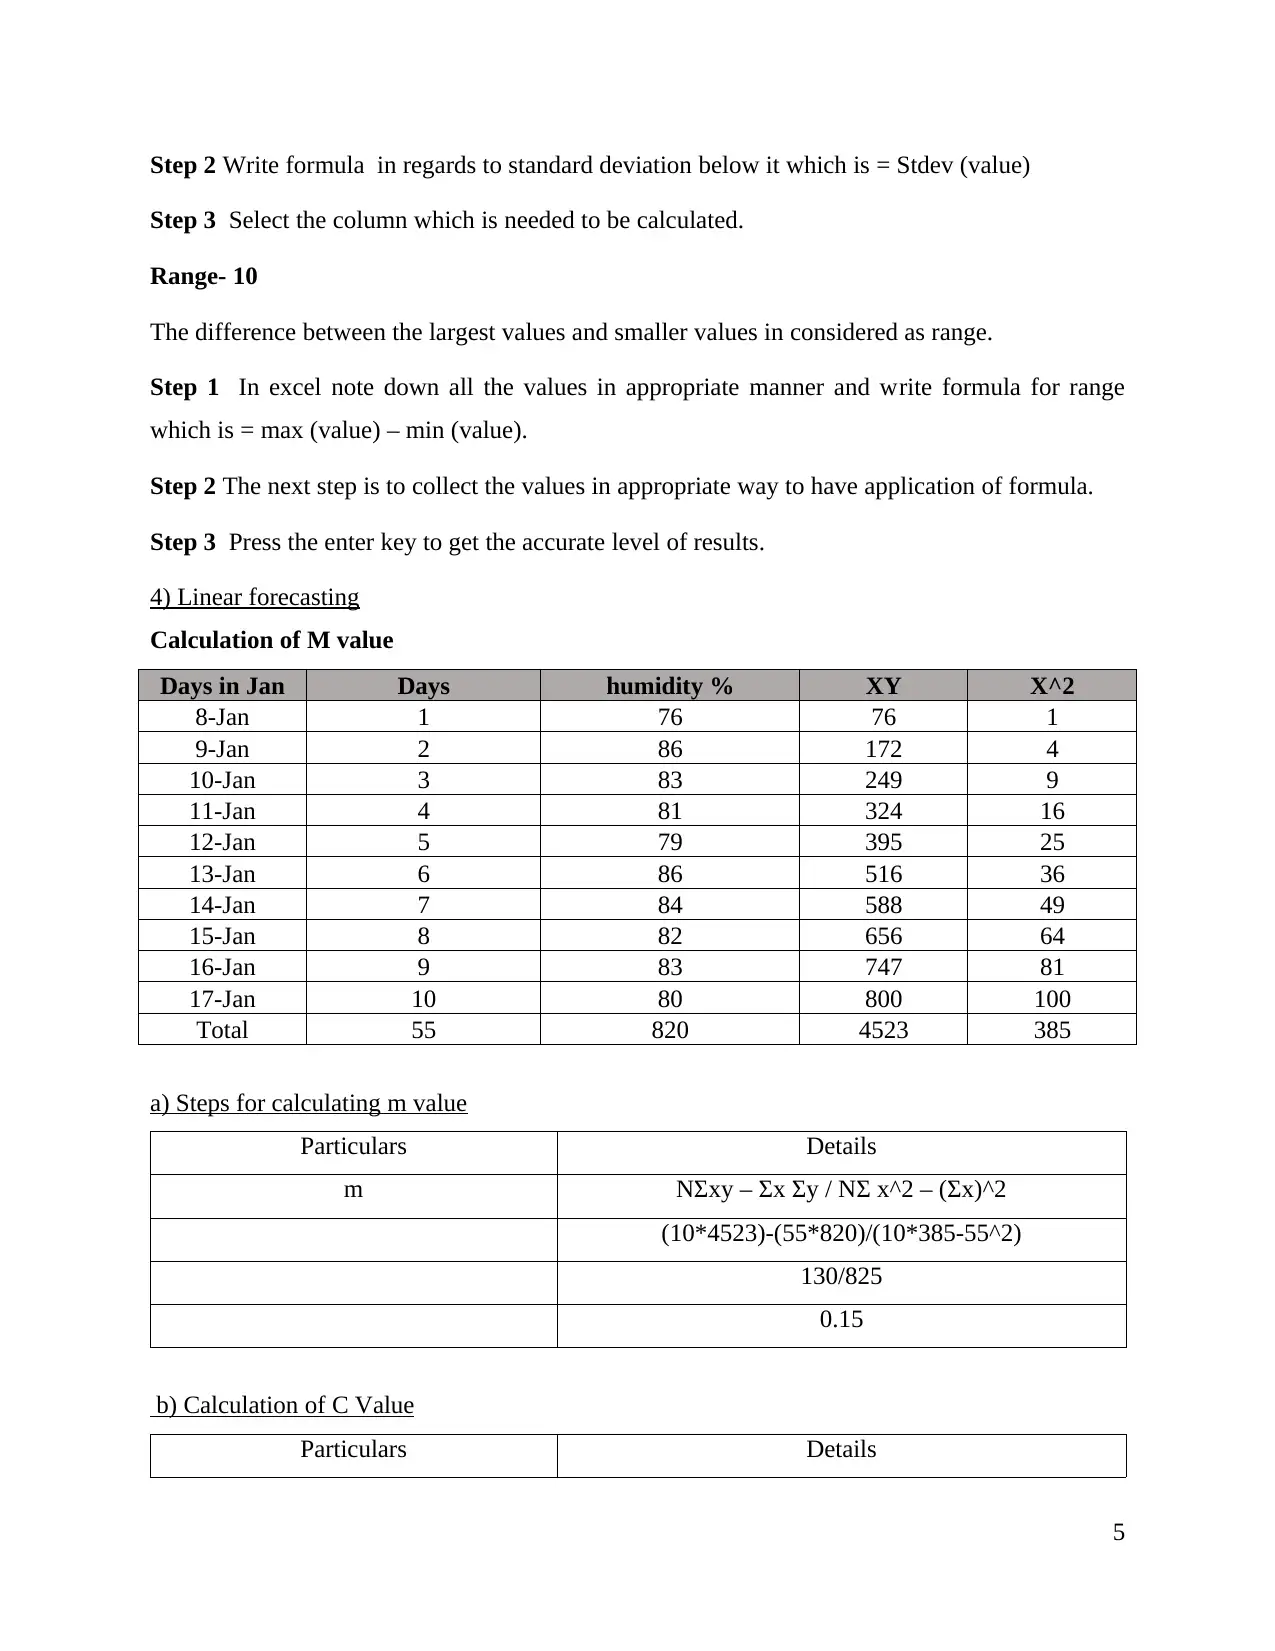
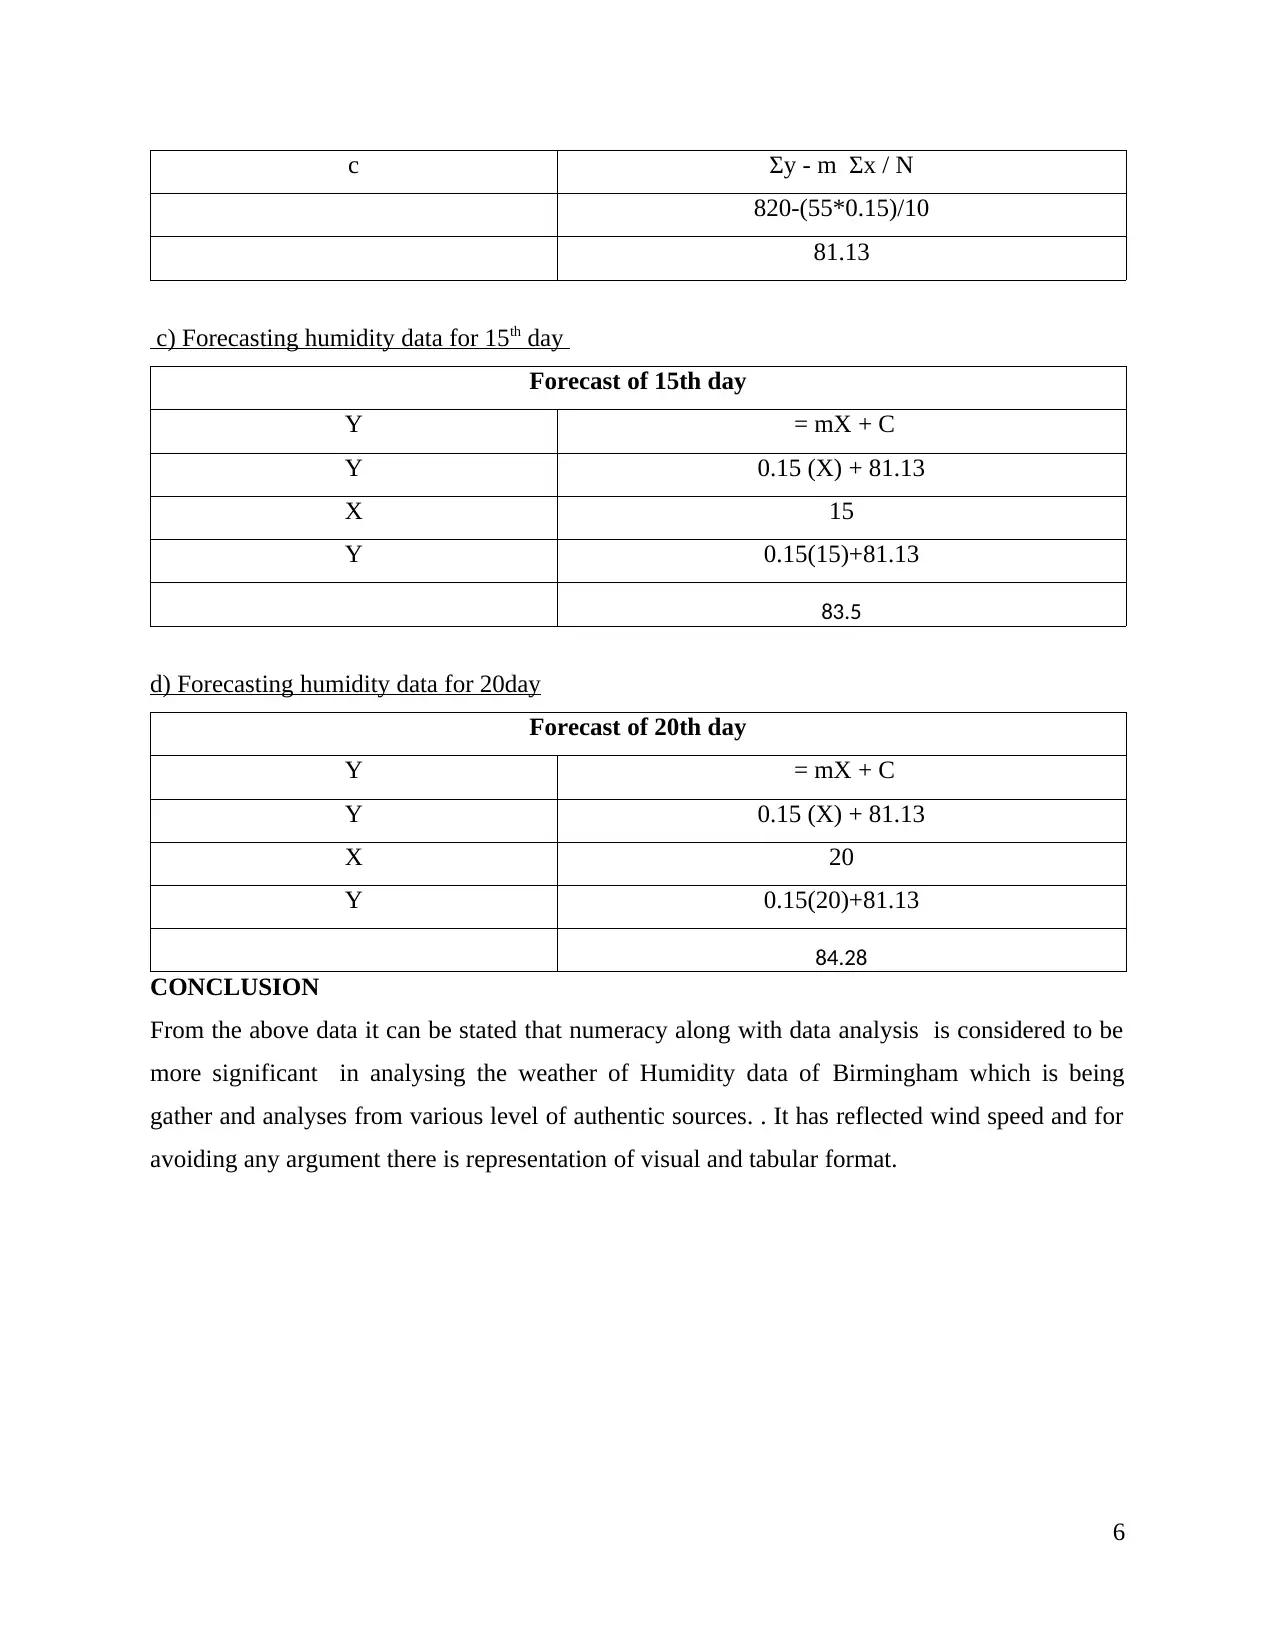
This project presents a comprehensive analysis of Birmingham's humidity data, covering various aspects of data analysis and forecasting. The assignment begins with a tabular representation of humidity data collected over a period of time, followed by the utilization of different chart types to visualize the data. Statistical calculations, including mean, median, mode, standard deviation, and range, are performed to provide a detailed understanding of the data's central tendency and dispersion. The project further delves into linear forecasting, calculating the 'm' and 'c' values of the linear equation, and subsequently forecasting humidity data for the 15th and 20th days. The report concludes with a summary of the findings, highlighting the importance of numeracy and data analysis in understanding weather patterns. References are provided to support the data sources and methodologies used throughout the project. This assignment, available on Desklib, offers students insights into data analysis techniques.
tabler-icon-diamond-filled.svg

Contribute Materials

Your contribution can guide someone’s learning journey. Share your documents today.
Document Page
Project on data analysis and
forecasting
tabler-icon-diamond-filled.svg

Secure Best Marks with AI Grader

Need help grading? Try our AI Grader for instant feedback on your assignments.
Document Page
Table of Contents
INTRODUCTION...........................................................................................................................1
1) Humidity data of Birmingham in tabular format....................................................................1
.....................................................................................................................................................1
2) Chart types .............................................................................................................................2
3) Statistical calculation..............................................................................................................2
4) Linear forecasting...................................................................................................................5
a) Steps for calculating m value..................................................................................................5
b) Calculation of C Value..........................................................................................................5
c) Forecasting humidity data for 15th day ................................................................................5
d) Forecasting humidity data for 20day......................................................................................5
Document Page
INTRODUCTION
Numeracy is considered as the important aspects for developing the a clear understanding
in present generation about the numerical analysis. The present report is having the brief
analysis of Humidity data of Birmingham which is being gather and analyses from various level
of authentic sources. The data of report is about having brief level of analysis in more of tabular
formats along with having major level of presentation in form of column & chart (Camarillo and
et.al., 2018). The report have the same level of consistency in series which is being having level
of providence of more level of authentic resources about description of Humidity data of
Birmingham with the help of major level of implementation of selective analysis. In this repost ,
there will be inclusion of mean, median, mode and standard deviation in detail manner. It will
represent about linear forecasting model was Y = mX + c with calculation m, c along with
forecast of day 15 and 20.
1) Humidity data of Birmingham in tabular format
Days in Jan humidity %
8-Jan 76
9-Jan 86
10-Jan 83
11-Jan 81
12-Jan 79
13-Jan 86
14-Jan 84
15-Jan 82
16-Jan 83
17-Jan 80
1
Document Page
2) Chart types
Chart 2
2
tabler-icon-diamond-filled.svg

Secure Best Marks with AI Grader

Need help grading? Try our AI Grader for instant feedback on your assignments.
Document Page
3) Statistical calculation
Days in Jan humidity %
8-Jan 76
9-Jan 86
10-Jan 83
11-Jan 81
12-Jan 79
13-Jan 86
14-Jan 84
15-Jan 82
16-Jan 83
17-Jan 80
mean 82
Mode 86
Median 82.5
STD V 3.126944
Range 10
Mean - 82
It is considered to be measure the level of central tendency which is most used to development
caters understanding regarding average in specific data. Mean is about sum of all values in
which collection of data will be divided by numbers (Wittmann and et.al., 2018). It s considered
to be important as it is considered to be fair representation of data which is basically influenced
by outlier.
Step 1 To have the write up all values which is collected from specific authenticated sites into
the table. The ext is about writing up of formula of mean that is = averages(values)
Step 2 The next step is to select all the values through which mean in needed to be calculated .
Step 3 Properly select all the values and press the key enter to get accurate resultant
3
Document Page
Mode – 86
The mode is considered to values of data which is having major level of appearances in table.
The mode is more way of expressing the single number which is considered to be more
important misinformation over random ad variable level of population in mores specific manner.
It s considered to be important as it is considered to be fair representation of data which is
basically influenced by outline.
Step 1 Write down the values in the excel in more appropriate manner of that the formula could
be easily presented to have evaluation.
Step 2 The next step is to select all the values through which mode in needed to be calculated
with application of formula =mode(values). The mode can be recognized with the helps of
undesirability to repetition of values most of times.
Step 3 The next is too select the all values in specific order and press the key enter to get desired
result.
Median – 82.5
The median values is about level of separating the higher half as respect to lower half of the data
as sample (Kim and et.al., 2018). The median is more considered in value in the list of the
numbers in more specific manner. The median is commonly used to have measurement over
different properties which is more data set in term of statistics along with having high
probability theory.
Step 1 Write up of values in systematic manner in excel which can be presented to have
properties in data set of statistics.
Step 2 The next step is to select all the values through which mean in needed to be calculated
with application of formula = median(values)
Step 3 Properly select all the values and press the key enter to get accurate results.
STDV- 3.126944
This have clearance over measurements over groups in order to be spread out in respect to
average and expected values.
Step 1 In excel note down all the values in systematic manner
4
Document Page
Step 2 Write formula in regards to standard deviation below it which is = Stdev (value)
Step 3 Select the column which is needed to be calculated.
Range- 10
The difference between the largest values and smaller values in considered as range.
Step 1 In excel note down all the values in appropriate manner and write formula for range
which is = max (value) – min (value).
Step 2 The next step is to collect the values in appropriate way to have application of formula.
Step 3 Press the enter key to get the accurate level of results.
4) Linear forecasting
Calculation of M value
Days in Jan Days humidity % XY X^2
8-Jan 1 76 76 1
9-Jan 2 86 172 4
10-Jan 3 83 249 9
11-Jan 4 81 324 16
12-Jan 5 79 395 25
13-Jan 6 86 516 36
14-Jan 7 84 588 49
15-Jan 8 82 656 64
16-Jan 9 83 747 81
17-Jan 10 80 800 100
Total 55 820 4523 385
a) Steps for calculating m value
Particulars Details
m NΣxy – Σx Σy / NΣ x^2 – (Σx)^2
(10*4523)-(55*820)/(10*385-55^2)
130/825
0.15
b) Calculation of C Value
Particulars Details
5
tabler-icon-diamond-filled.svg

Paraphrase This Document

Need a fresh take? Get an instant paraphrase of this document with our AI Paraphraser
Document Page
c Σy - m Σx / N
820-(55*0.15)/10
81.13
c) Forecasting humidity data for 15th day
Forecast of 15th day
Y = mX + C
Y 0.15 (X) + 81.13
X 15
Y 0.15(15)+81.13
83.5
d) Forecasting humidity data for 20day
Forecast of 20th day
Y = mX + C
Y 0.15 (X) + 81.13
X 20
Y 0.15(20)+81.13
84.28
CONCLUSION
From the above data it can be stated that numeracy along with data analysis is considered to be
more significant in analysing the weather of Humidity data of Birmingham which is being
gather and analyses from various level of authentic sources. . It has reflected wind speed and for
avoiding any argument there is representation of visual and tabular format.
6
Document Page
references
Kim, M.H. and et.al., 2018. Segregated subnetworks of intracortical projection neurons in
primary visual cortex. Neuron. 100(6). pp.1313-1321.
Wittmann, S. and et.al., 2018. Filtering mode for intra prediction inferred from statistics of
surrounding blocks. U.S. Patent 9,973,772.
Camarillo, T. and et.al., 2018. Median Statistics Estimate of the Distance to the Galactic Center.
Publications of the Astronomical Society of the Pacific. 130(984). p.024101.
7
chevron_up_icon
1 out of 9
circle_padding
hide_on_mobile
zoom_out_icon
logo.png

Your All-in-One AI-Powered Toolkit for Academic Success.

Available 24*7 on WhatsApp / Email

[object Object]