Comprehensive Report: Numeracy and Data Analysis of Sleep Patterns

Verified

Added on  2023/01/11

|8
|1335
|256
Report
AI Summary
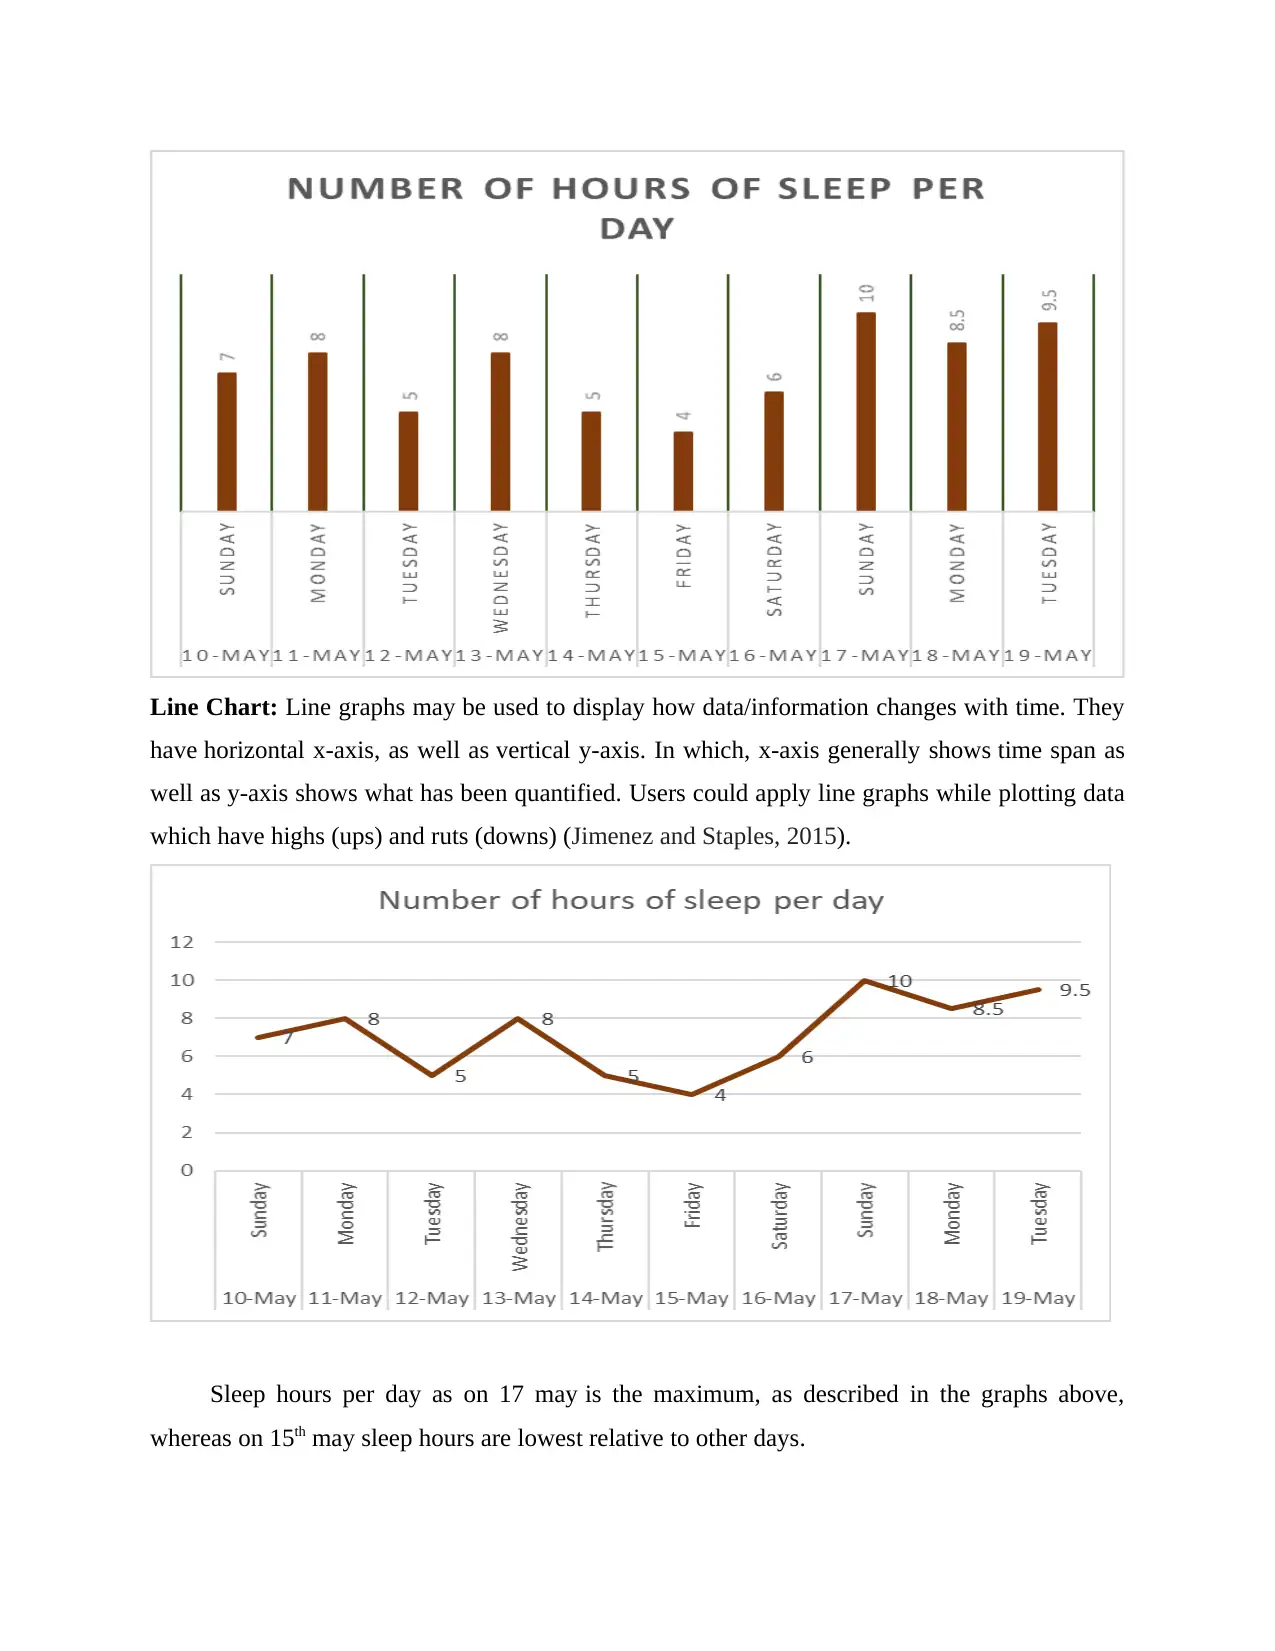
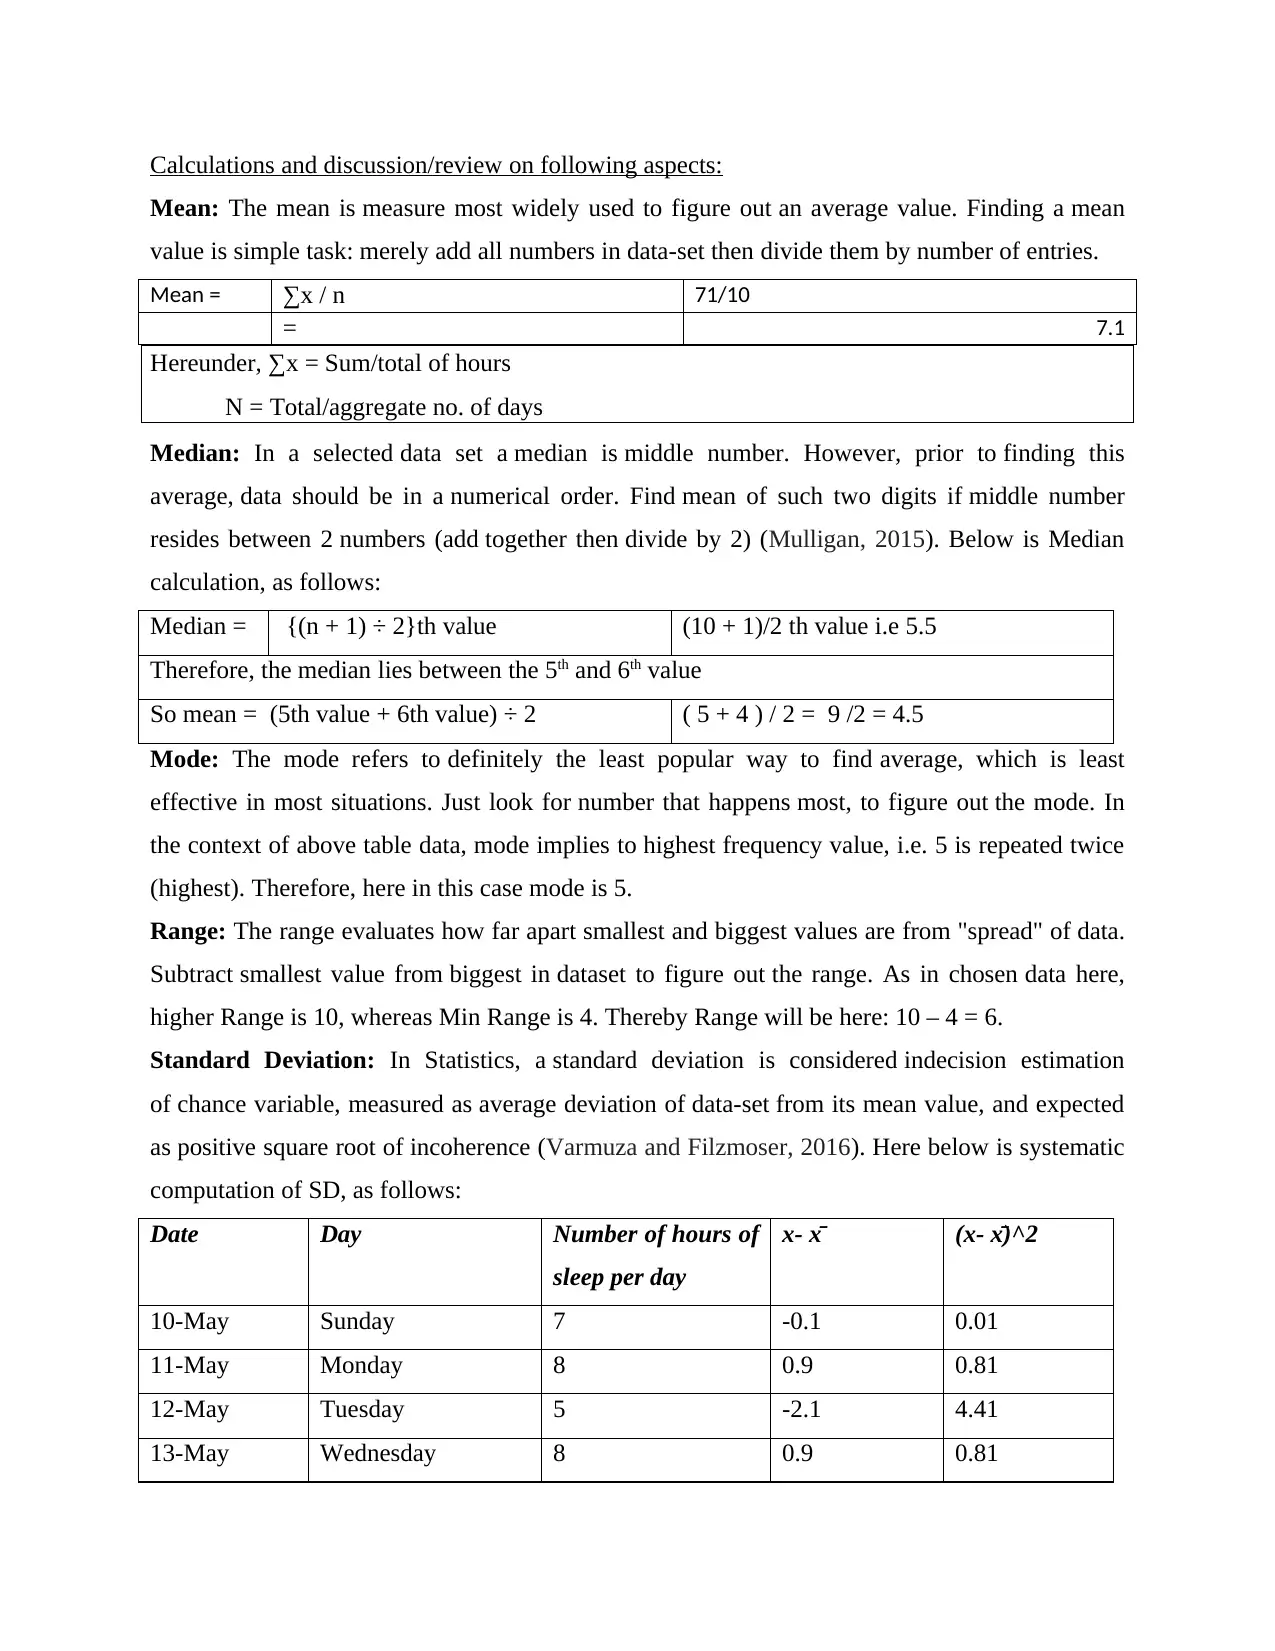
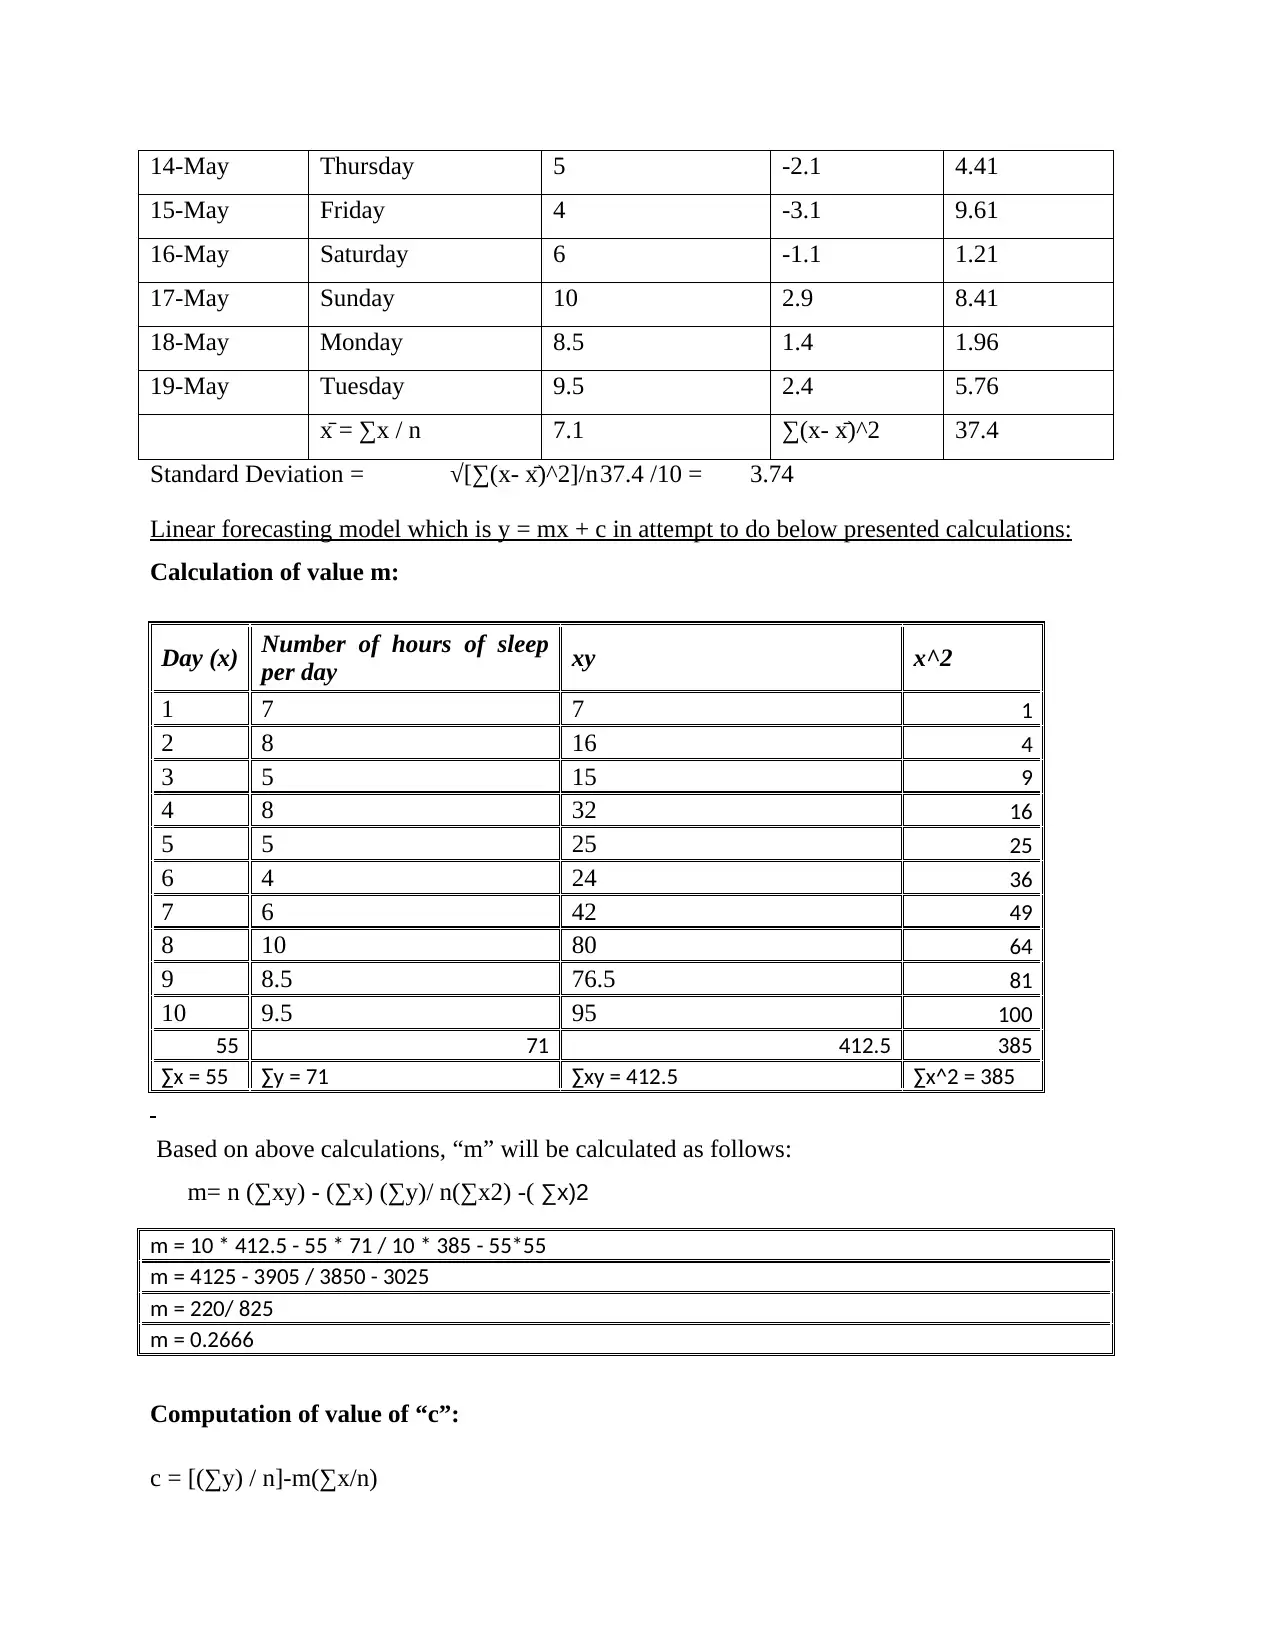
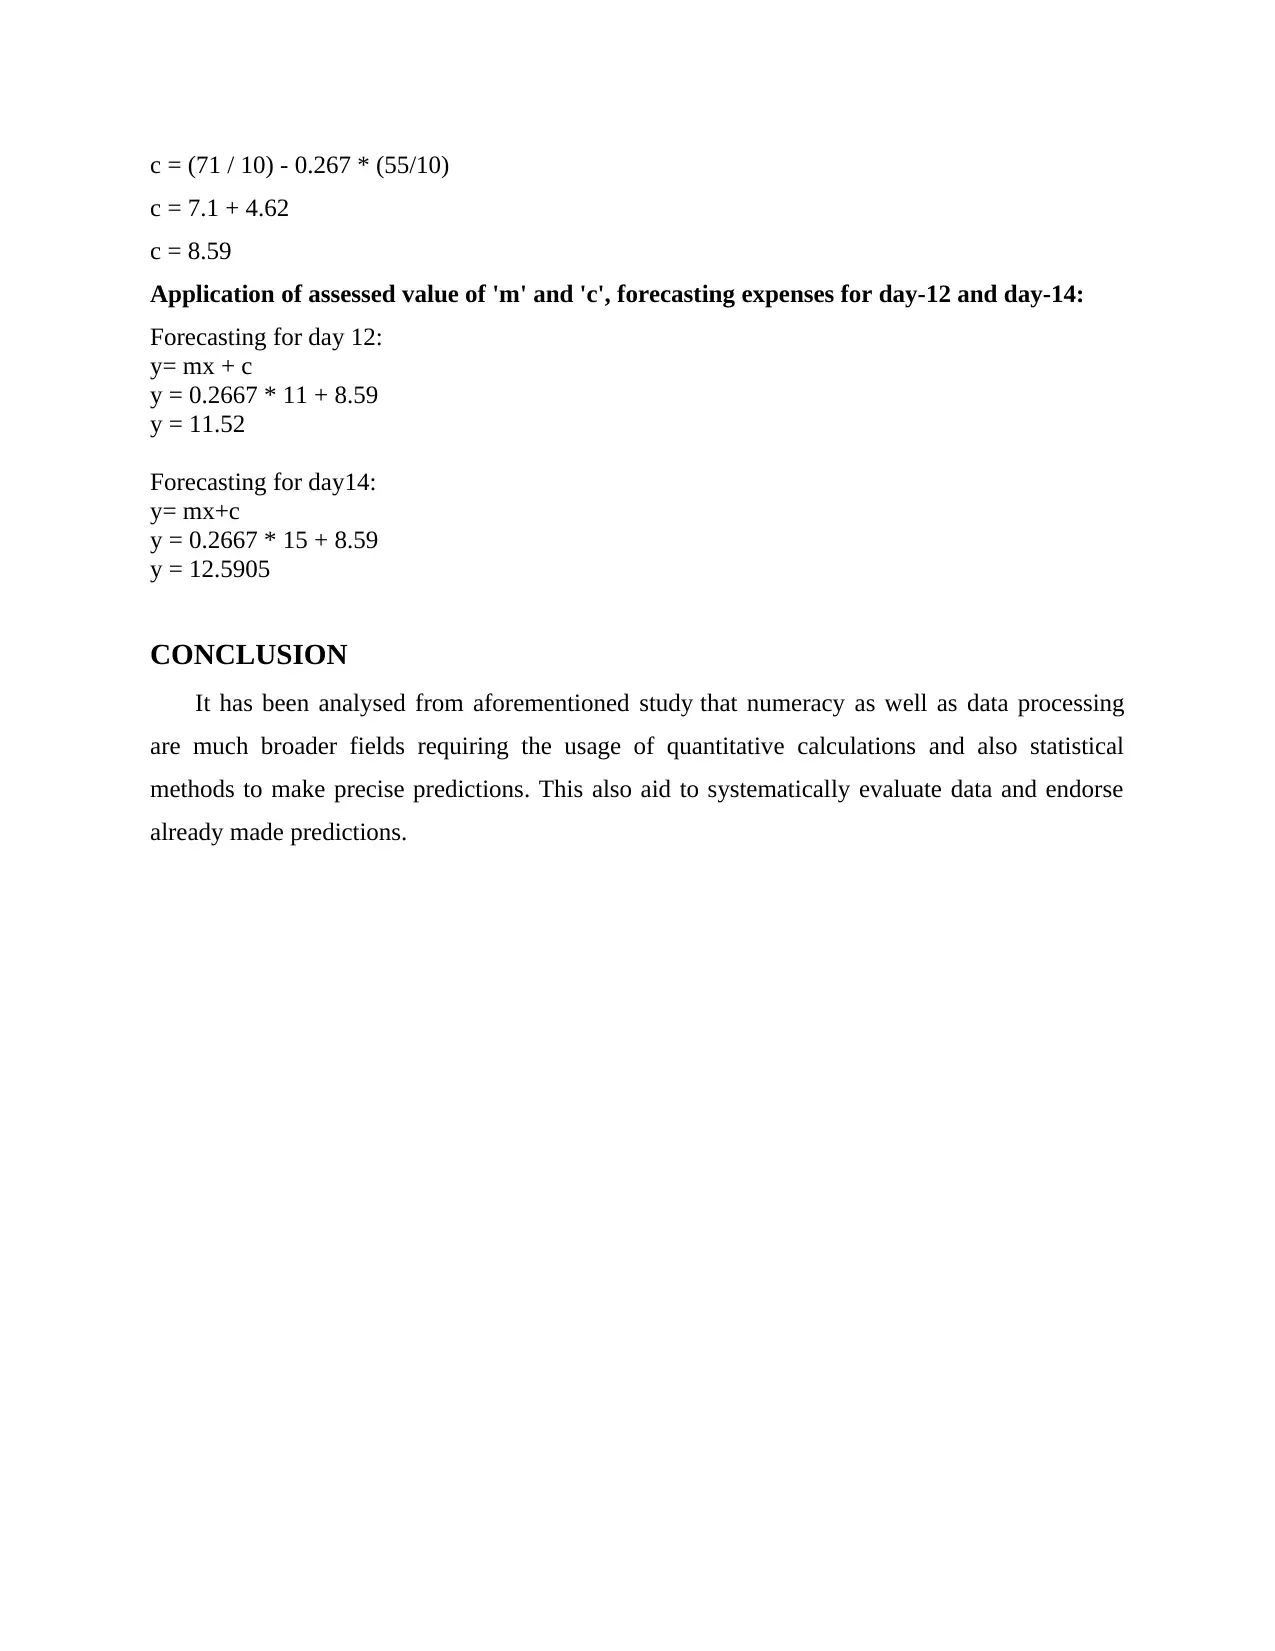
This report presents a comprehensive analysis of sleep data using various statistical techniques. The student begins by arranging the data into a table format, followed by the presentation of the data through multiple graphs, including column and line charts, to visualize the trends in sleep hours over a ten-day period. The core of the report involves detailed calculations and discussions of key statistical measures such as mean, median, mode, range, and standard deviation. Furthermore, the report incorporates a linear forecasting model (y = mx + c) to estimate the number of sleep hours for the 11th and 15th days. The student calculates the values of 'm' and 'c' and applies these values to predict future sleep patterns. The report concludes by summarizing the findings and emphasizing the importance of numeracy and data processing in making precise predictions and systematically evaluating data.
Document Page
Numeracy and Data
Analysis
tabler-icon-diamond-filled.svg

Paraphrase This Document

Need a fresh take? Get an instant paraphrase of this document with our AI Paraphraser
Document Page
Contents
Contents...........................................................................................................................................2
INTRODUCTION...........................................................................................................................3
MAIN BODY..................................................................................................................................3
Arranging selected data into a table format:................................................................................3
Presentation of chosen data through multiple graphs:.................................................................3
Calculations and discussion/review on following aspects:..........................................................5
Linear forecasting model which is y = mx + c in attempt to do below presented calculations:..6
CONCLUSION................................................................................................................................8
Document Page
INTRODUCTION
Numeracy applies to explaining and integrating basic numerical principles. The basic
skills for numeracy require learning basic mathematics including additions, subtractions,
multiplications as well as dividing. While the data analysis, method / tactic of collection and
configuration of data / raw information is being used to allow researchers to derive meaningful-
data from it. The main object of data analysis phase is to concentrate in a few simple words on
what data wants to suggest (Dryden and Mardia, 2016). The report highlights different aspects of
the data analysis and application of statistical techniques. The report includes the number of
hours of sleep per day for ten consecutive day for the application of statistical methods such as
median, mean-average, mode, SD as well as the data display in various graphs. In addition, the
11th and 15th hours of sleep per day is estimated using linear model.
MAIN BODY
Arranging selected data into a table format:
Date Day Number of hours of sleep per day
10-May Sunday 7
11-May Monday 8
12-May Tuesday 5
13-May Wednesday 8
14-May Thursday 5
15-May Friday 4
16-May Saturday 6
17-May Sunday 10
18-May Monday 8.5
19-May Tuesday 9.5
Presentation of chosen data through multiple graphs:
Column Chart: Bar charts seem to be similar to the line charts because they contain 2 axes and
are helpful to reflect how something has shifted over a certain time frame, in particular when
shifts are crucial.
Document Page
Line Chart: Line graphs may be used to display how data/information changes with time. They
have horizontal x-axis, as well as vertical y-axis. In which, x-axis generally shows time span as
well as y-axis shows what has been quantified. Users could apply line graphs while plotting data
which have highs (ups) and ruts (downs) (Jimenez and Staples, 2015).
Sleep hours per day as on 17 may is the maximum, as described in the graphs above,
whereas on 15th may sleep hours are lowest relative to other days.
tabler-icon-diamond-filled.svg

Paraphrase This Document

Need a fresh take? Get an instant paraphrase of this document with our AI Paraphraser
Document Page
Calculations and discussion/review on following aspects:
Mean: The mean is measure most widely used to figure out an average value. Finding a mean
value is simple task: merely add all numbers in data-set then divide them by number of entries.
Mean = ∑x / n 71/10
= 7.1
Hereunder, ∑x = Sum/total of hours
N = Total/aggregate no. of days
Median: In a selected data set a median is middle number. However, prior to finding this
average, data should be in a numerical order. Find mean of such two digits if middle number
resides between 2 numbers (add together then divide by 2) (Mulligan, 2015). Below is Median
calculation, as follows:
Median = {(n + 1) ÷ 2}th value (10 + 1)/2 th value i.e 5.5
Therefore, the median lies between the 5th and 6th value
So mean = (5th value + 6th value) ÷ 2 ( 5 + 4 ) / 2 = 9 /2 = 4.5
Mode: The mode refers to definitely the least popular way to find average, which is least
effective in most situations. Just look for number that happens most, to figure out the mode. In
the context of above table data, mode implies to highest frequency value, i.e. 5 is repeated twice
(highest). Therefore, here in this case mode is 5.
Range: The range evaluates how far apart smallest and biggest values are from "spread" of data.
Subtract smallest value from biggest in dataset to figure out the range. As in chosen data here,
higher Range is 10, whereas Min Range is 4. Thereby Range will be here: 10 – 4 = 6.
Standard Deviation: In Statistics, a standard deviation is considered indecision estimation
of chance variable, measured as average deviation of data-set from its mean value, and expected
as positive square root of incoherence (Varmuza and Filzmoser, 2016). Here below is systematic
computation of SD, as follows:
Date Day Number of hours of
sleep per day
x- x̄ (x- x̄)^2
10-May Sunday 7 -0.1 0.01
11-May Monday 8 0.9 0.81
12-May Tuesday 5 -2.1 4.41
13-May Wednesday 8 0.9 0.81
Document Page
14-May Thursday 5 -2.1 4.41
15-May Friday 4 -3.1 9.61
16-May Saturday 6 -1.1 1.21
17-May Sunday 10 2.9 8.41
18-May Monday 8.5 1.4 1.96
19-May Tuesday 9.5 2.4 5.76
x̄ = ∑x / n 7.1 ∑(x- x̄)^2 37.4
Standard Deviation = √[∑(x- x̄)^2]/n37.4 /10 = 3.74
Linear forecasting model which is y = mx + c in attempt to do below presented calculations:
Calculation of value m:
Day (x) Number of hours of sleep
per day xy x^2
1 7 7 1
2 8 16 4
3 5 15 9
4 8 32 16
5 5 25 25
6 4 24 36
7 6 42 49
8 10 80 64
9 8.5 76.5 81
10 9.5 95 100
55 71 412.5 385
∑x = 55 ∑y = 71 ∑xy = 412.5 ∑x^2 = 385
Based on above calculations, “m” will be calculated as follows:
m= n (∑xy) - (∑x) (∑y)/ n(∑x2) -( ∑x)2
m = 10 * 412.5 - 55 * 71 / 10 * 385 - 55*55
m = 4125 - 3905 / 3850 - 3025
m = 220/ 825
m = 0.2666
Computation of value of “c”:
c = [(∑y) / n]-m(∑x/n)
Document Page
c = (71 / 10) - 0.267 * (55/10)
c = 7.1 + 4.62
c = 8.59
Application of assessed value of 'm' and 'c', forecasting expenses for day-12 and day-14:
Forecasting for day 12:
y= mx + c
y = 0.2667 * 11 + 8.59
y = 11.52
Forecasting for day14:
y= mx+c
y = 0.2667 * 15 + 8.59
y = 12.5905
CONCLUSION
It has been analysed from aforementioned study that numeracy as well as data processing
are much broader fields requiring the usage of quantitative calculations and also statistical
methods to make precise predictions. This also aid to systematically evaluate data and endorse
already made predictions.
tabler-icon-diamond-filled.svg

Paraphrase This Document

Need a fresh take? Get an instant paraphrase of this document with our AI Paraphraser
Document Page
REFERENCES
Books and Journals:
Dryden, I.L. and Mardia, K.V., 2016. Statistical shape analysis: with applications in R (Vol.
995). John Wiley & Sons.
Jimenez, B.A. and Staples, K., 2015. Access to the common core state standards in mathematics
through early numeracy skill building for students with significant intellectual
disability. Education and Training in Autism and Developmental Disabilities, pp.17-30.
Mulligan, J., 2015. Moving beyond basic numeracy: data modeling in the early years of
schooling. ZDM, 47(4), pp.653-663..
Varmuza, K. and Filzmoser, P., 2016. Introduction to multivariate statistical analysis in
chemometrics. CRC press.
chevron_up_icon
1 out of 8
circle_padding
hide_on_mobile
zoom_out_icon
[object Object]