Data Analysis of London Humidity: Mean, Median, Mode, and Forecast
VerifiedAdded on 2023/01/17
|10
|1540
|69
Report
AI Summary
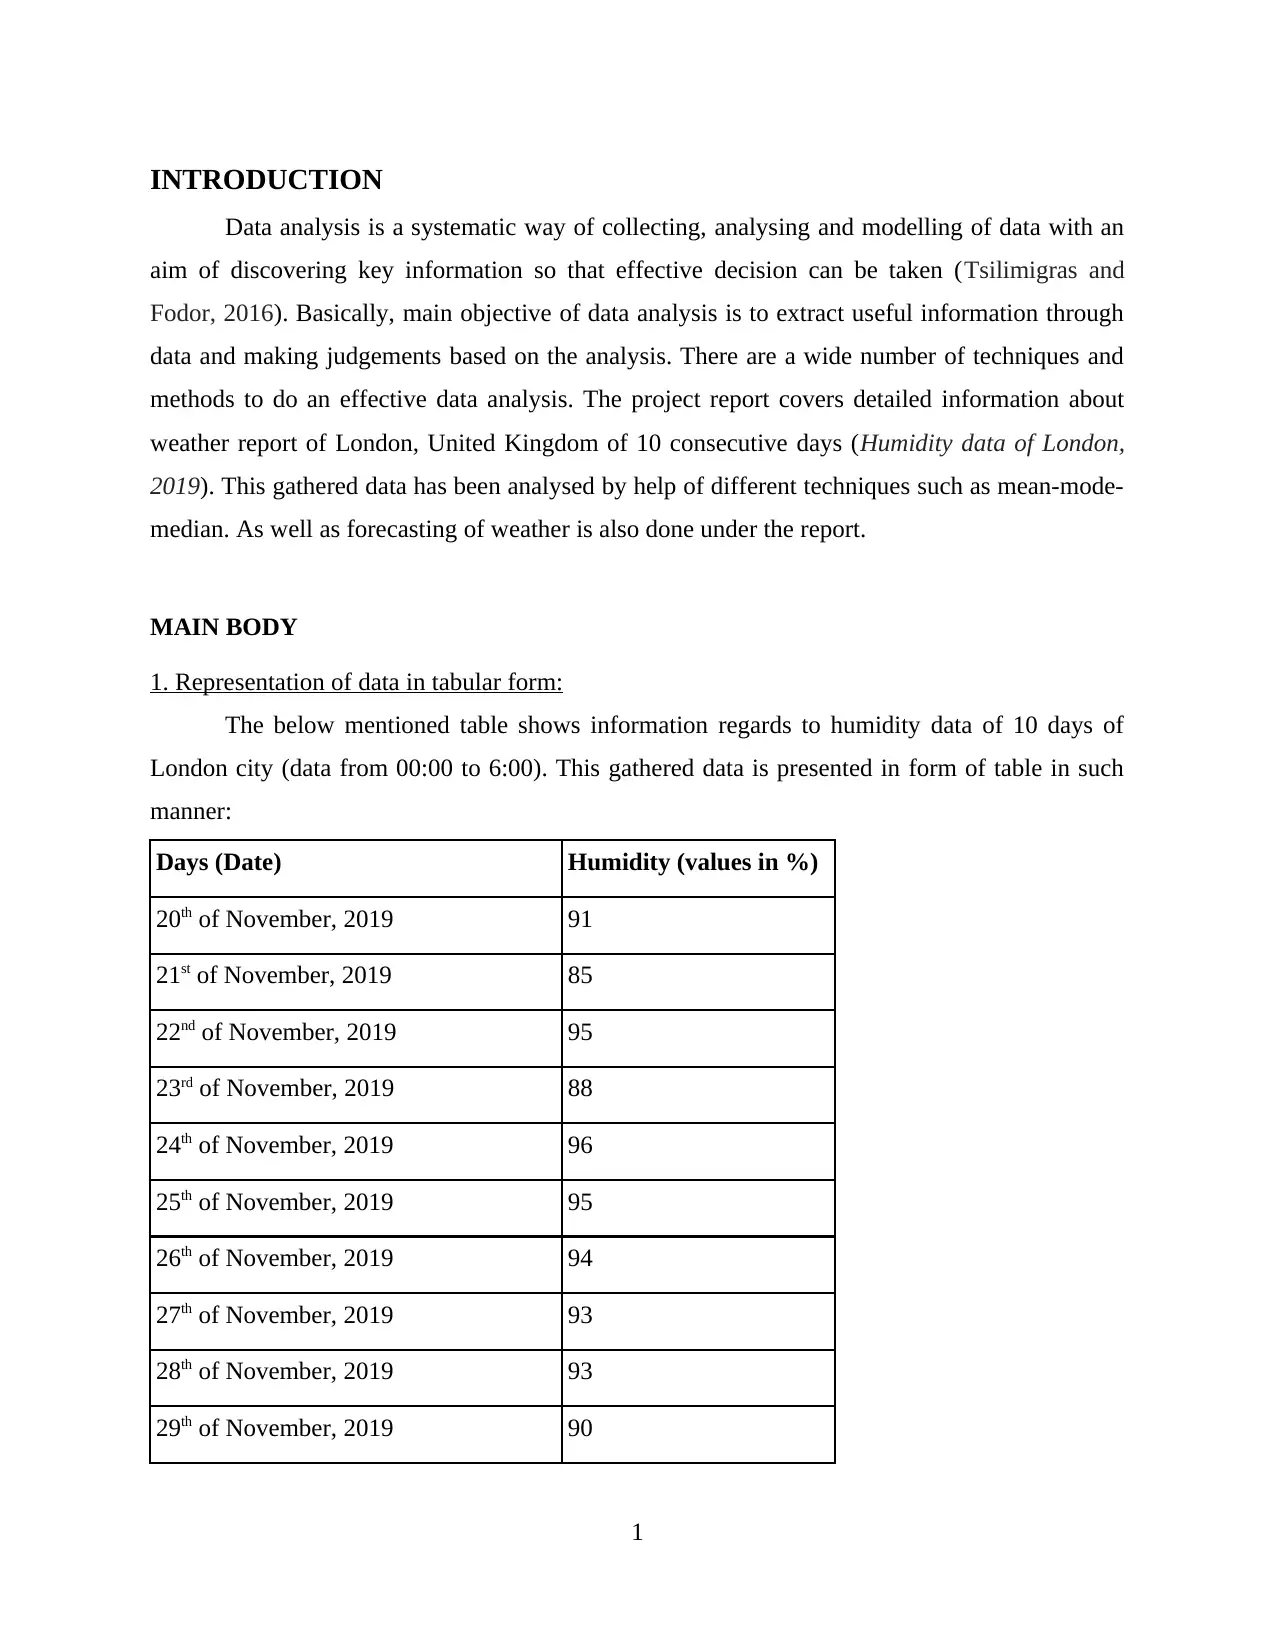
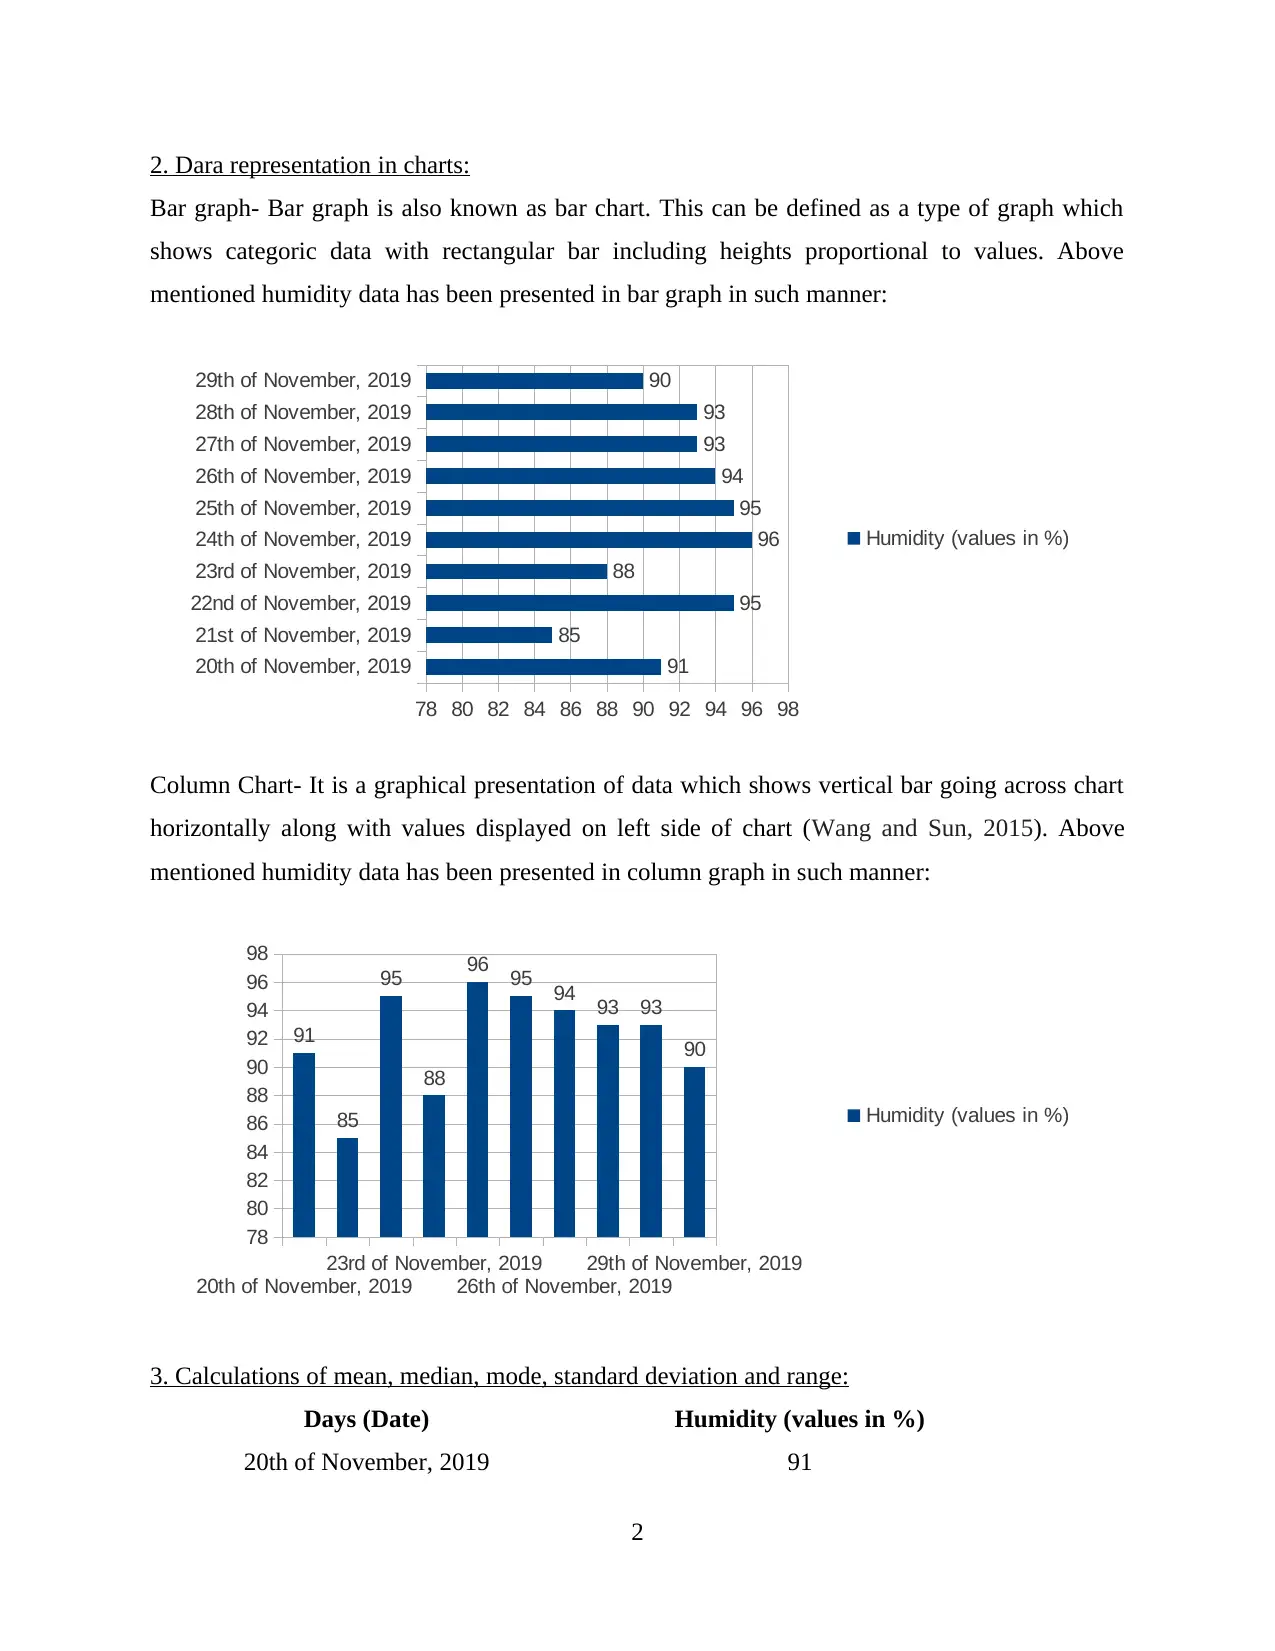
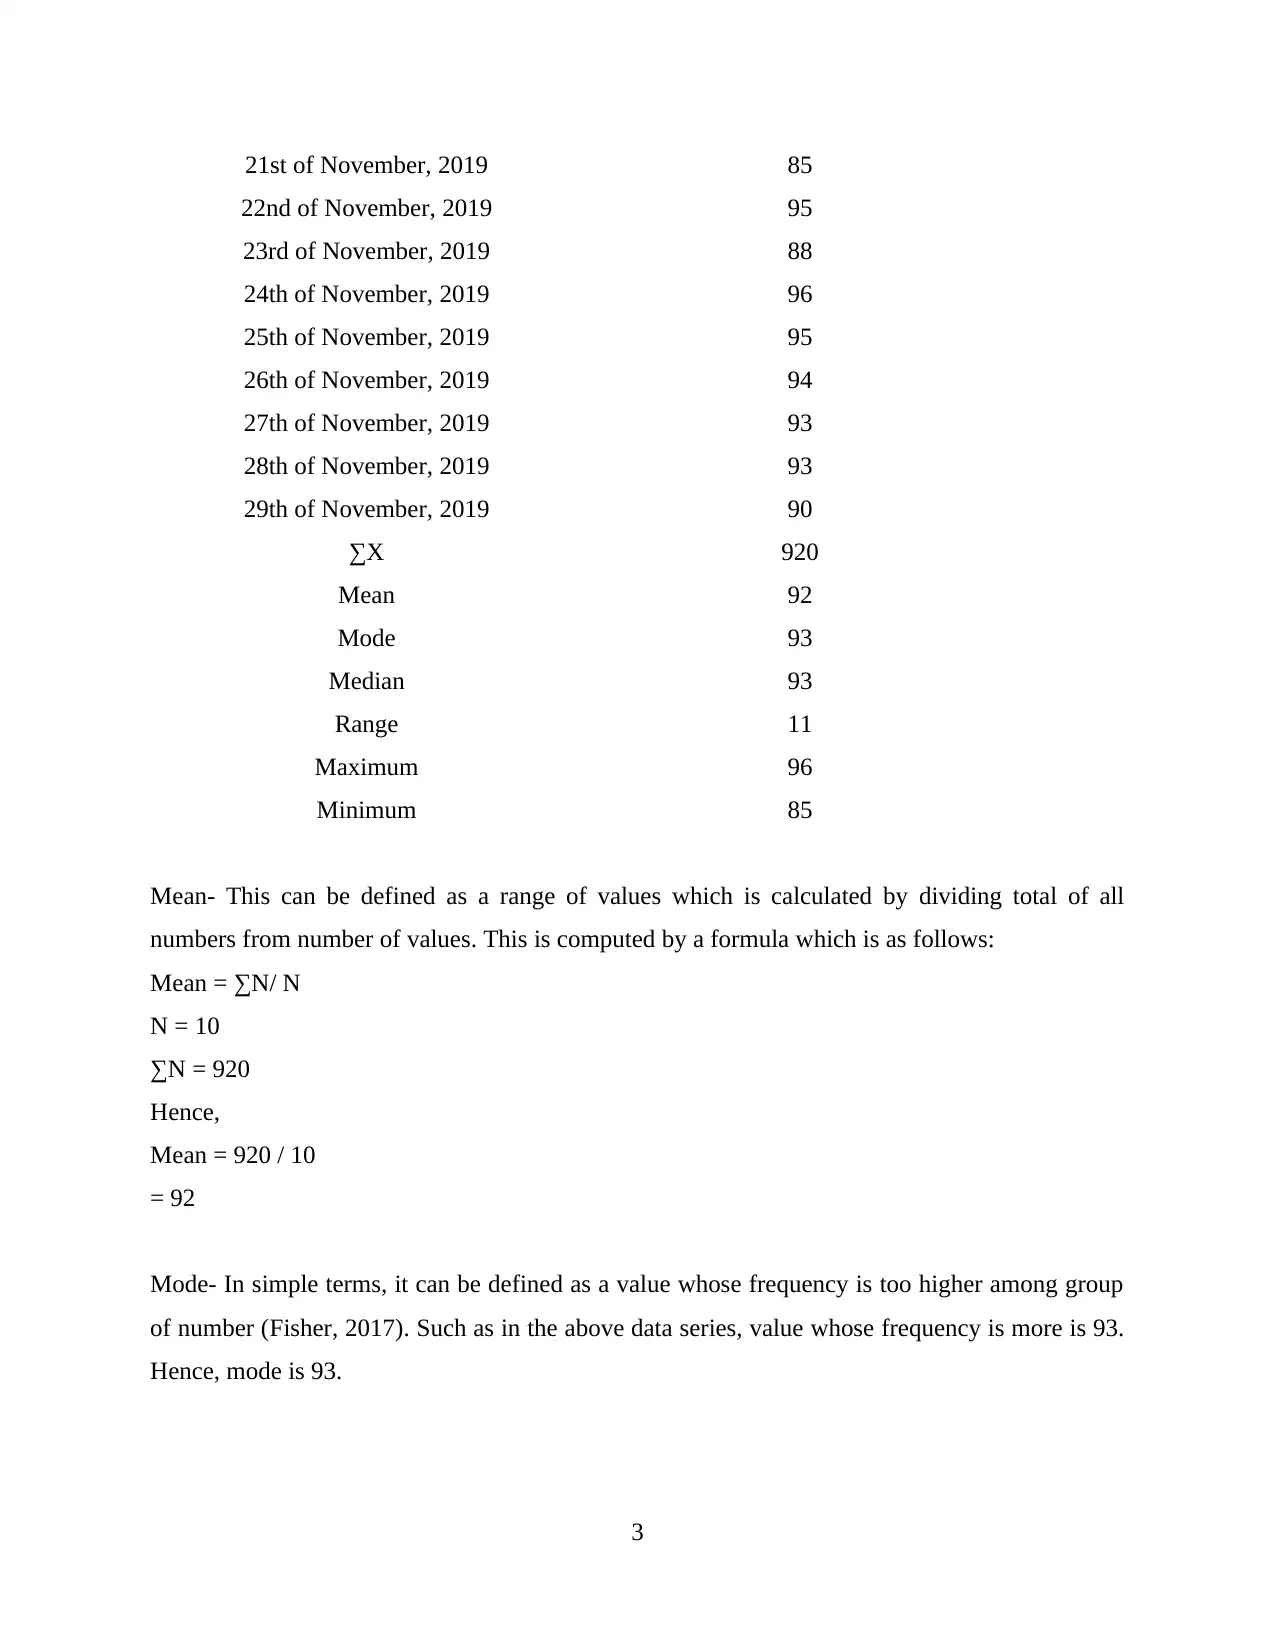
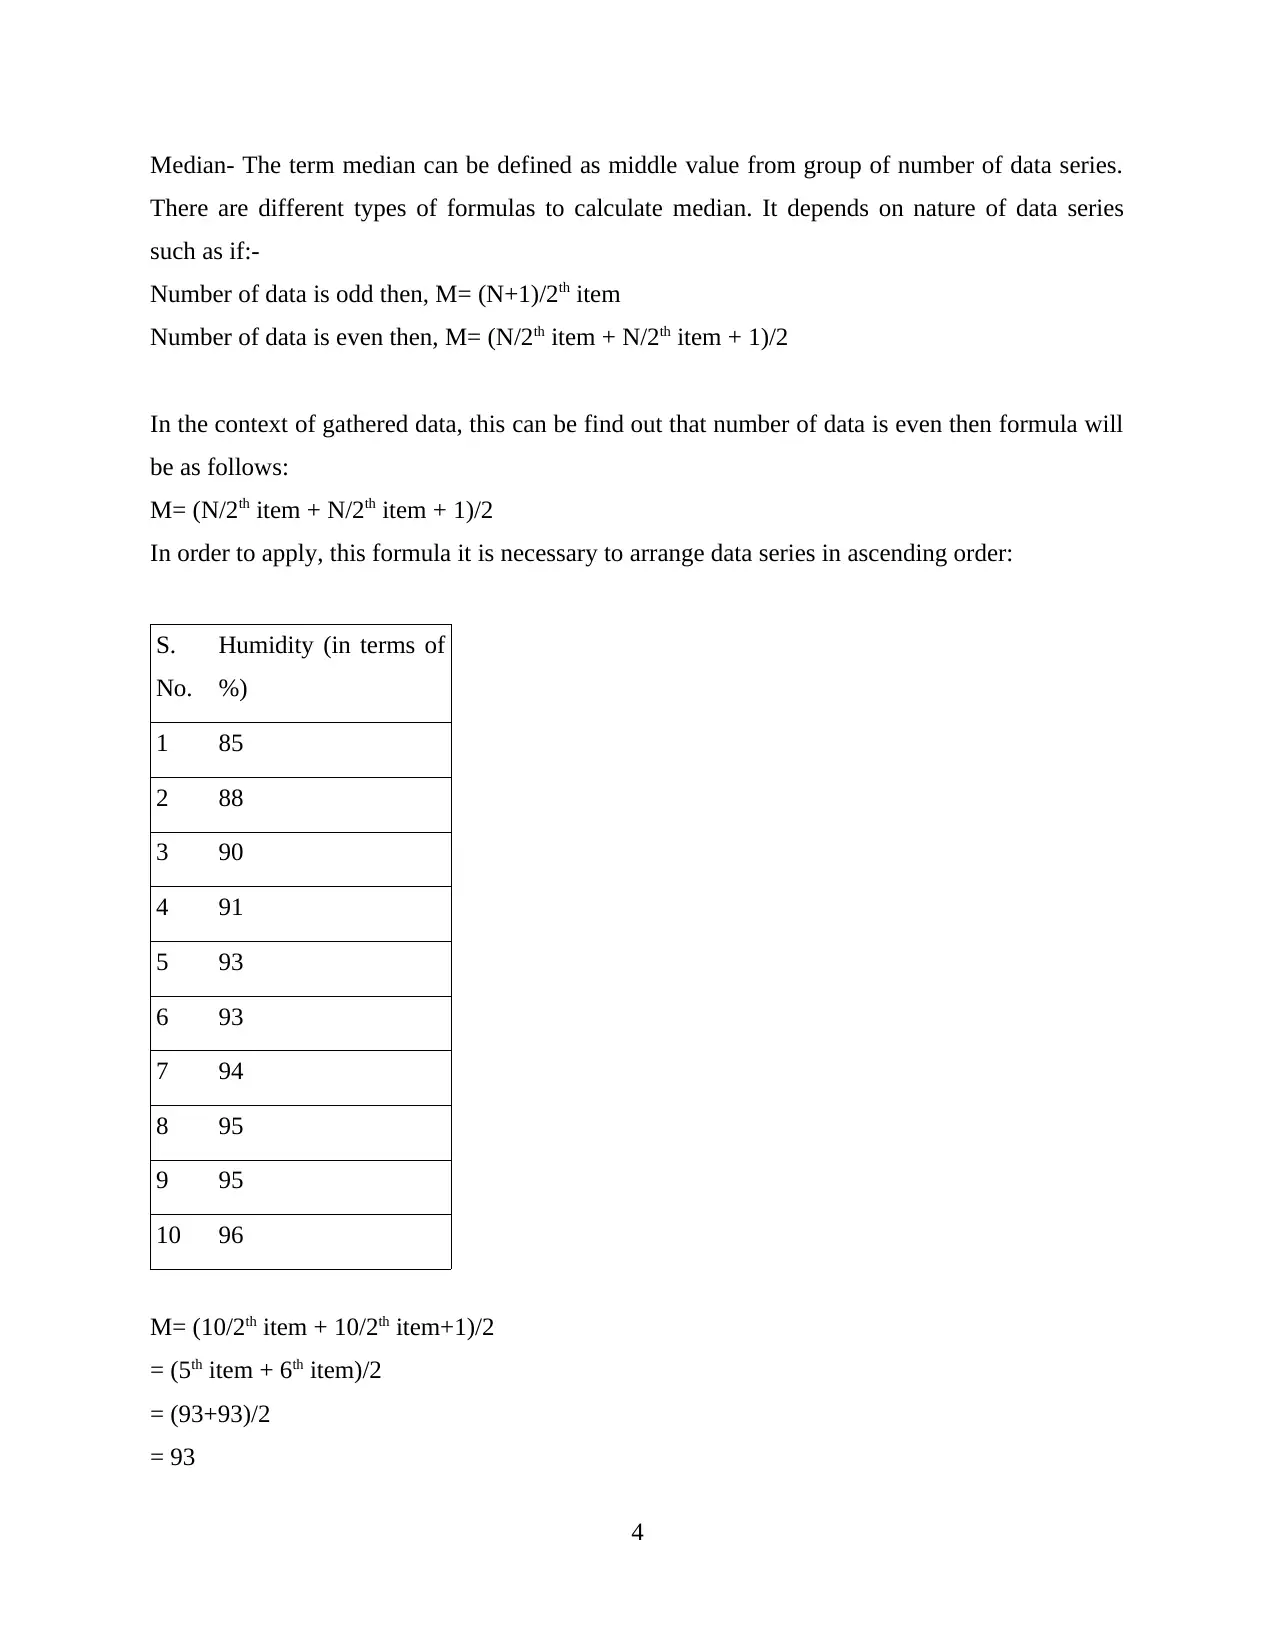
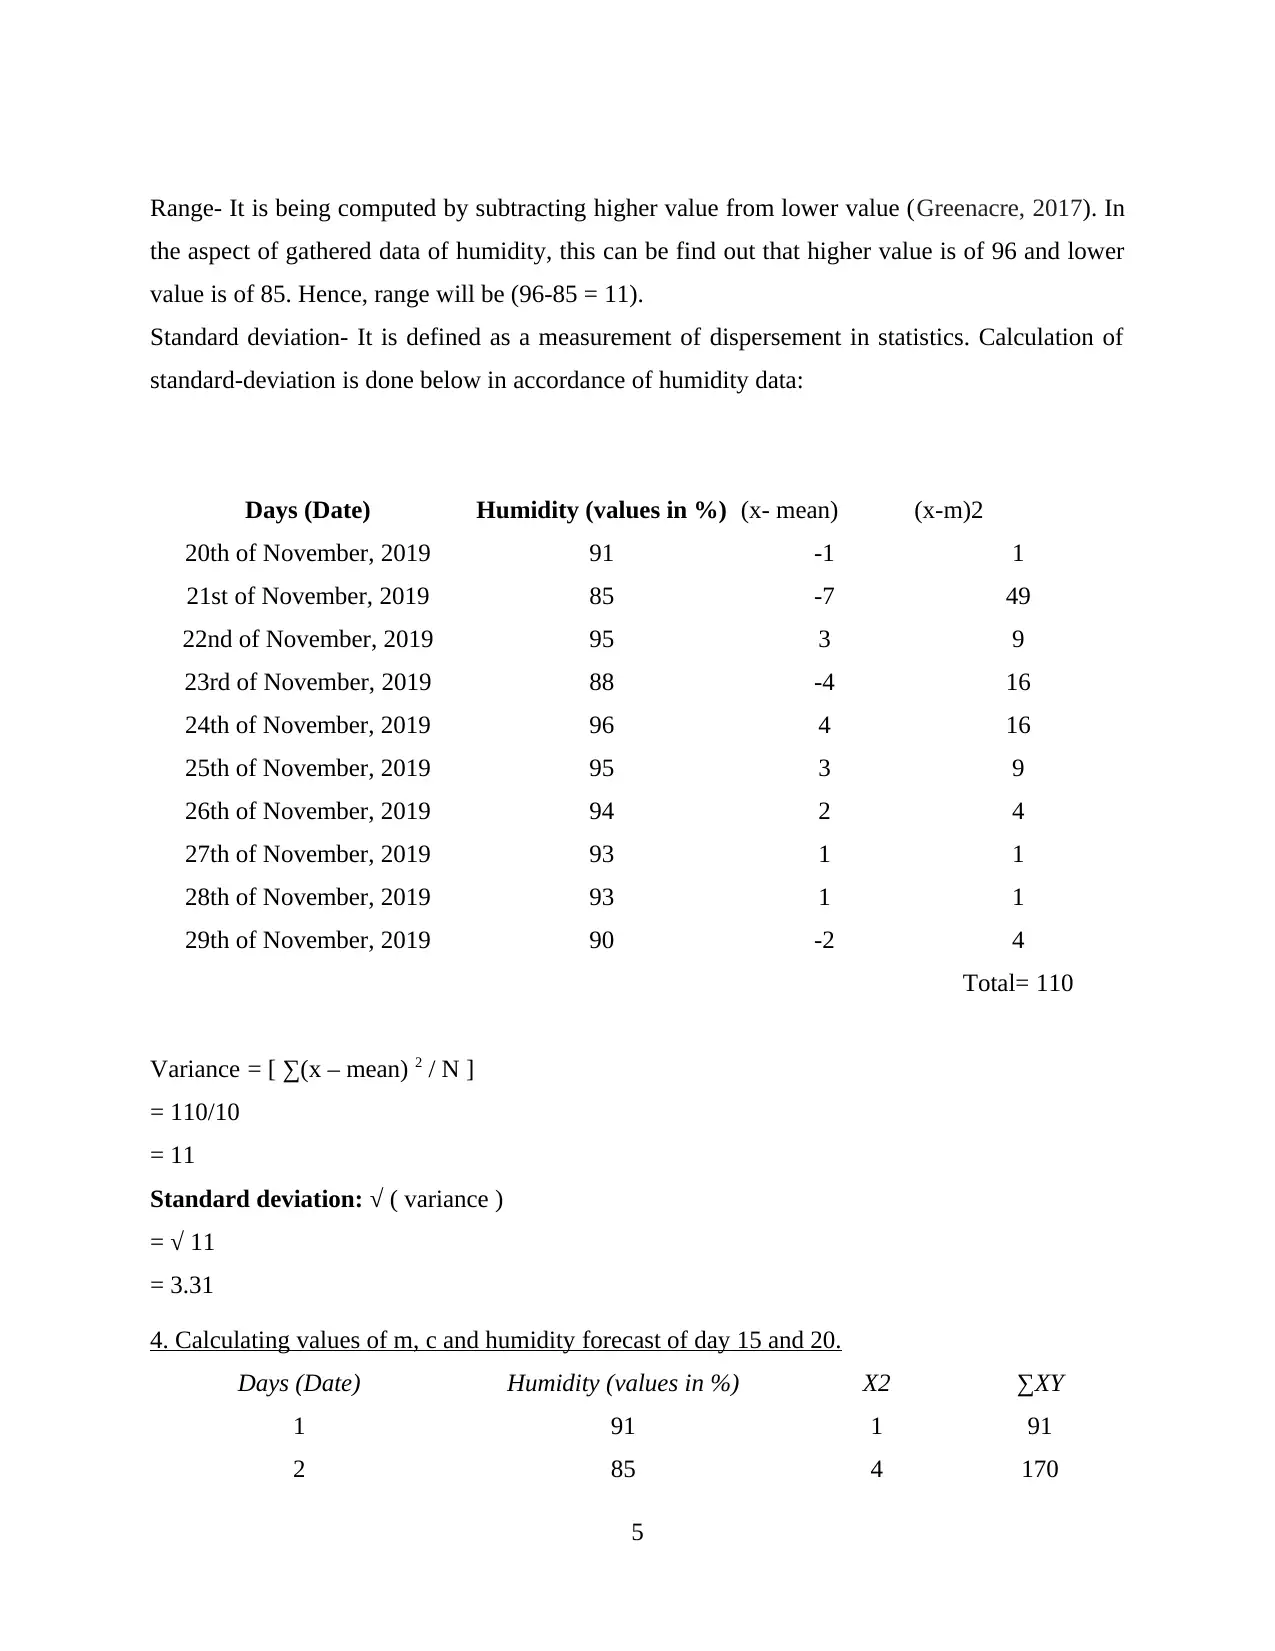
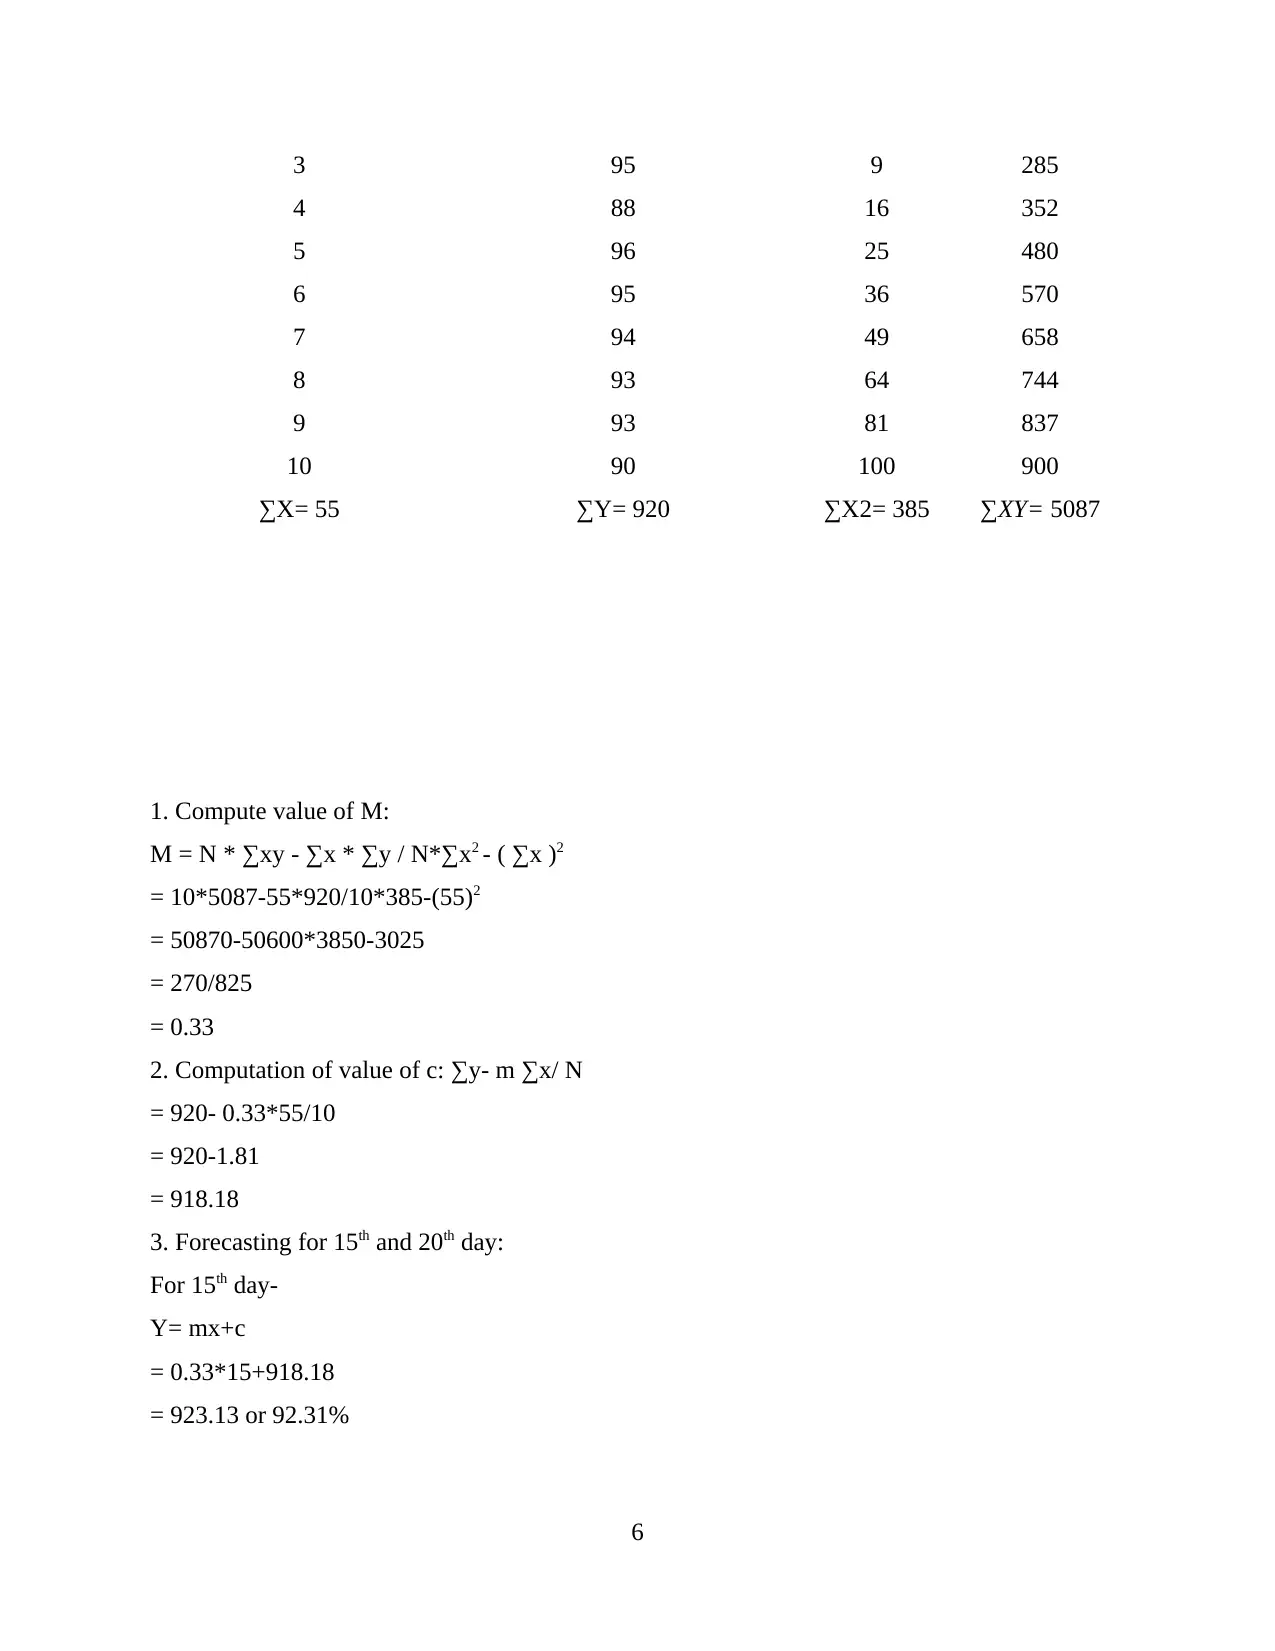
This report presents a comprehensive analysis of humidity data in London over a ten-day period. It begins with the representation of data in tabular form and visually through bar and column charts. The core of the report involves calculating key statistical measures, including mean, median, mode, standard deviation, and range, to understand the central tendencies and variability of the humidity data. Furthermore, the report utilizes linear regression to forecast humidity levels for the 15th and 20th days, providing insights into potential future weather patterns. The report concludes with a summary of the findings, highlighting the effectiveness of data analysis in informed decision-making and weather prediction. The analysis utilizes real-world data and demonstrates the application of various data analysis techniques.

Numeracy and Data
Analysis
Analysis
Paraphrase This Document
Need a fresh take? Get an instant paraphrase of this document with our AI Paraphraser

Table of Contents
INTRODUCTION...........................................................................................................................1
MAIN BODY...................................................................................................................................1
1. Representation of data in tabular form:...................................................................................1
2. Dara representation in charts:..................................................................................................2
3. Calculations of mean, median, mode, standard deviation and range:......................................3
4. Calculating values of m, c and humidity forecast of day 15 and 20........................................5
CONCLUSION................................................................................................................................6
REFERENCES................................................................................................................................8

INTRODUCTION
Data analysis is a systematic way of collecting, analysing and modelling of data with an
aim of discovering key information so that effective decision can be taken (Tsilimigras and
Fodor, 2016). Basically, main objective of data analysis is to extract useful information through
data and making judgements based on the analysis. There are a wide number of techniques and
methods to do an effective data analysis. The project report covers detailed information about
weather report of London, United Kingdom of 10 consecutive days (Humidity data of London,
2019). This gathered data has been analysed by help of different techniques such as mean-mode-
median. As well as forecasting of weather is also done under the report.
MAIN BODY
1. Representation of data in tabular form:
The below mentioned table shows information regards to humidity data of 10 days of
London city (data from 00:00 to 6:00). This gathered data is presented in form of table in such
manner:
Days (Date) Humidity (values in %)
20th of November, 2019 91
21st of November, 2019 85
22nd of November, 2019 95
23rd of November, 2019 88
24th of November, 2019 96
25th of November, 2019 95
26th of November, 2019 94
27th of November, 2019 93
28th of November, 2019 93
29th of November, 2019 90
1
⊘ This is a preview!⊘
Do you want full access?
Subscribe today to unlock all pages.

Trusted by 1+ million students worldwide

2. Dara representation in charts:
Bar graph- Bar graph is also known as bar chart. This can be defined as a type of graph which
shows categoric data with rectangular bar including heights proportional to values. Above
mentioned humidity data has been presented in bar graph in such manner:
20th of November, 2019
21st of November, 2019
22nd of November, 2019
23rd of November, 2019
24th of November, 2019
25th of November, 2019
26th of November, 2019
27th of November, 2019
28th of November, 2019
29th of November, 2019
78 80 82 84 86 88 90 92 94 96 98
91
85
95
88
96
95
94
93
93
90
Humidity (values in %)
Column Chart- It is a graphical presentation of data which shows vertical bar going across chart
horizontally along with values displayed on left side of chart (Wang and Sun, 2015). Above
mentioned humidity data has been presented in column graph in such manner:
20th of November, 2019
23rd of November, 2019
26th of November, 2019
29th of November, 2019
78
80
82
84
86
88
90
92
94
96
98
91
85
95
88
96 95 94 93 93
90
Humidity (values in %)
3. Calculations of mean, median, mode, standard deviation and range:
Days (Date) Humidity (values in %)
20th of November, 2019 91
2
Paraphrase This Document
Need a fresh take? Get an instant paraphrase of this document with our AI Paraphraser

21st of November, 2019 85
22nd of November, 2019 95
23rd of November, 2019 88
24th of November, 2019 96
25th of November, 2019 95
26th of November, 2019 94
27th of November, 2019 93
28th of November, 2019 93
29th of November, 2019 90
∑X 920
Mean 92
Mode 93
Median 93
Range 11
Maximum 96
Minimum 85
Mean- This can be defined as a range of values which is calculated by dividing total of all
numbers from number of values. This is computed by a formula which is as follows:
Mean = ∑N/ N
N = 10
∑N = 920
Hence,
Mean = 920 / 10
= 92
Mode- In simple terms, it can be defined as a value whose frequency is too higher among group
of number (Fisher, 2017). Such as in the above data series, value whose frequency is more is 93.
Hence, mode is 93.
3

Median- The term median can be defined as middle value from group of number of data series.
There are different types of formulas to calculate median. It depends on nature of data series
such as if:-
Number of data is odd then, M= (N+1)/2th item
Number of data is even then, M= (N/2th item + N/2th item + 1)/2
In the context of gathered data, this can be find out that number of data is even then formula will
be as follows:
M= (N/2th item + N/2th item + 1)/2
In order to apply, this formula it is necessary to arrange data series in ascending order:
S.
No.
Humidity (in terms of
%)
1 85
2 88
3 90
4 91
5 93
6 93
7 94
8 95
9 95
10 96
M= (10/2th item + 10/2th item+1)/2
= (5th item + 6th item)/2
= (93+93)/2
= 93
4
⊘ This is a preview!⊘
Do you want full access?
Subscribe today to unlock all pages.

Trusted by 1+ million students worldwide

Range- It is being computed by subtracting higher value from lower value (Greenacre, 2017). In
the aspect of gathered data of humidity, this can be find out that higher value is of 96 and lower
value is of 85. Hence, range will be (96-85 = 11).
Standard deviation- It is defined as a measurement of dispersement in statistics. Calculation of
standard-deviation is done below in accordance of humidity data:
Days (Date) Humidity (values in %) (x- mean) (x-m)2
20th of November, 2019 91 -1 1
21st of November, 2019 85 -7 49
22nd of November, 2019 95 3 9
23rd of November, 2019 88 -4 16
24th of November, 2019 96 4 16
25th of November, 2019 95 3 9
26th of November, 2019 94 2 4
27th of November, 2019 93 1 1
28th of November, 2019 93 1 1
29th of November, 2019 90 -2 4
Total= 110
Variance = [ ∑(x – mean) 2 / N ]
= 110/10
= 11
Standard deviation: √ ( variance )
= √ 11
= 3.31
4. Calculating values of m, c and humidity forecast of day 15 and 20.
Days (Date) Humidity (values in %) X2 ∑XY
1 91 1 91
2 85 4 170
5
Paraphrase This Document
Need a fresh take? Get an instant paraphrase of this document with our AI Paraphraser

3 95 9 285
4 88 16 352
5 96 25 480
6 95 36 570
7 94 49 658
8 93 64 744
9 93 81 837
10 90 100 900
∑X= 55 ∑Y= 920 ∑X2= 385 ∑XY= 5087
1. Compute value of M:
M = N * ∑xy - ∑x * ∑y / N*∑x2 - ( ∑x )2
= 10*5087-55*920/10*385-(55)2
= 50870-50600*3850-3025
= 270/825
= 0.33
2. Computation of value of c: ∑y- m ∑x/ N
= 920- 0.33*55/10
= 920-1.81
= 918.18
3. Forecasting for 15th and 20th day:
For 15th day-
Y= mx+c
= 0.33*15+918.18
= 923.13 or 92.31%
6

For 20th day-
Y= mx+c
= 0.33*20+918.18
= 924.78 or 92.47%
CONCLUSION
On the basis of above project report, it can be concluded that data analysis is one of the
key method to provide assistance for better decisions. Report concludes about calculation of
mean-mode-median as per the selected data of humidity of ten days. As well as gathered data is
presented in form of bar and column charts. Further part of report concludes about forecasting of
humidity for 15th and 20th days that is calculated by linear regression model.
7
⊘ This is a preview!⊘
Do you want full access?
Subscribe today to unlock all pages.

Trusted by 1+ million students worldwide

REFERENCES
Books and journal:
Tsilimigras, M .C. and Fodor, A .A., 2016. Compositional data analysis of the microbiome:
fundamentals, tools, and challenges. Annals of epidemiology. 26(5). pp.330-335.
Wang, D. and Sun, Z., 2015. Big data analysis and parallel load forecasting of electric power
user side. Proceedings of the CSEE. 35(3). pp.527-537.
Fisher, M., 2017. Qualitative computing: using software for qualitative data analysis. Routledge.
Greenacre, M., 2017. Correspondence analysis in practice. Chapman and Hall/CRC.
Online
Humidity data of London. 2019. [Online]. Available through:
<https://www.timeanddate.com/weather/uk/london/historic>
8
1 out of 10
Related Documents

Your All-in-One AI-Powered Toolkit for Academic Success.
+13062052269
info@desklib.com
Available 24*7 on WhatsApp / Email
Unlock your academic potential
Copyright © 2020–2025 A2Z Services. All Rights Reserved. Developed and managed by ZUCOL.