London School of Commerce Numeracy and Data Analysis Exam Solution
VerifiedAdded on 2022/11/24
|3
|509
|431
Homework Assignment
AI Summary
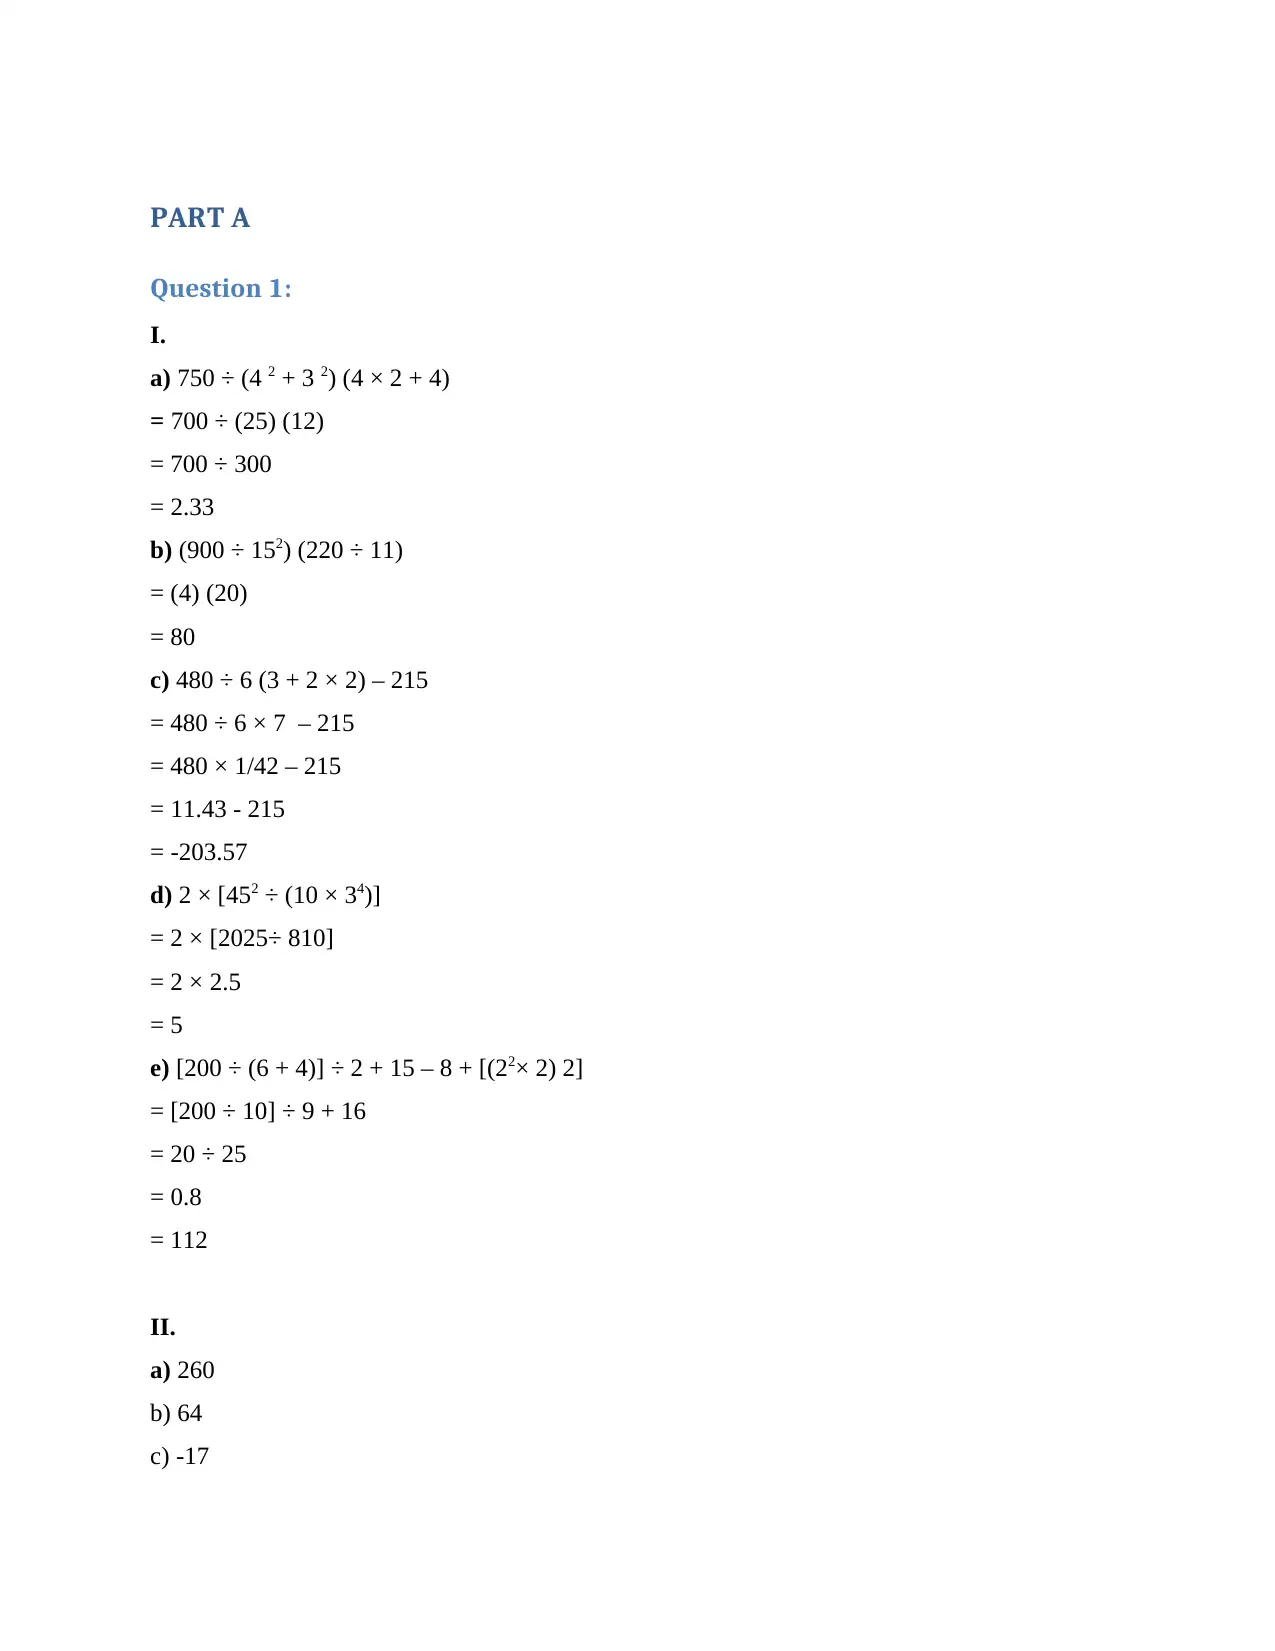
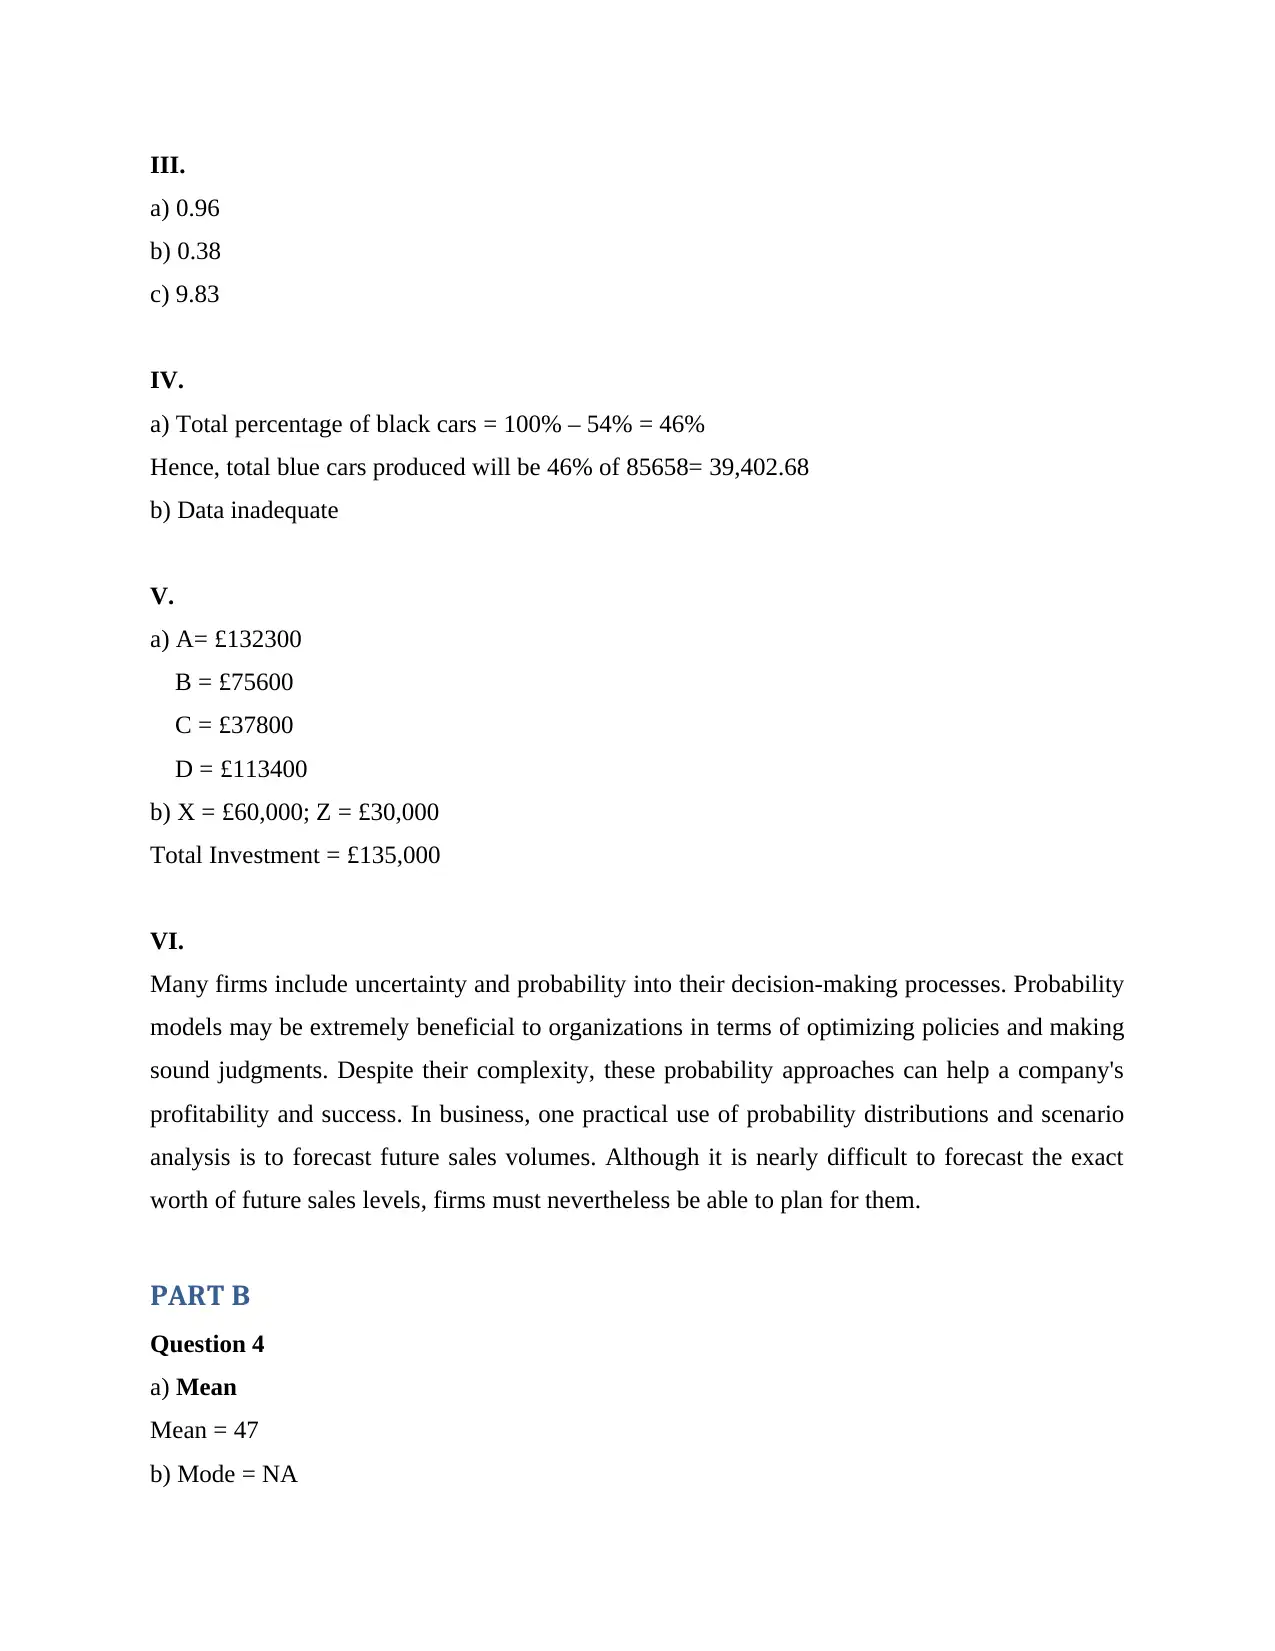
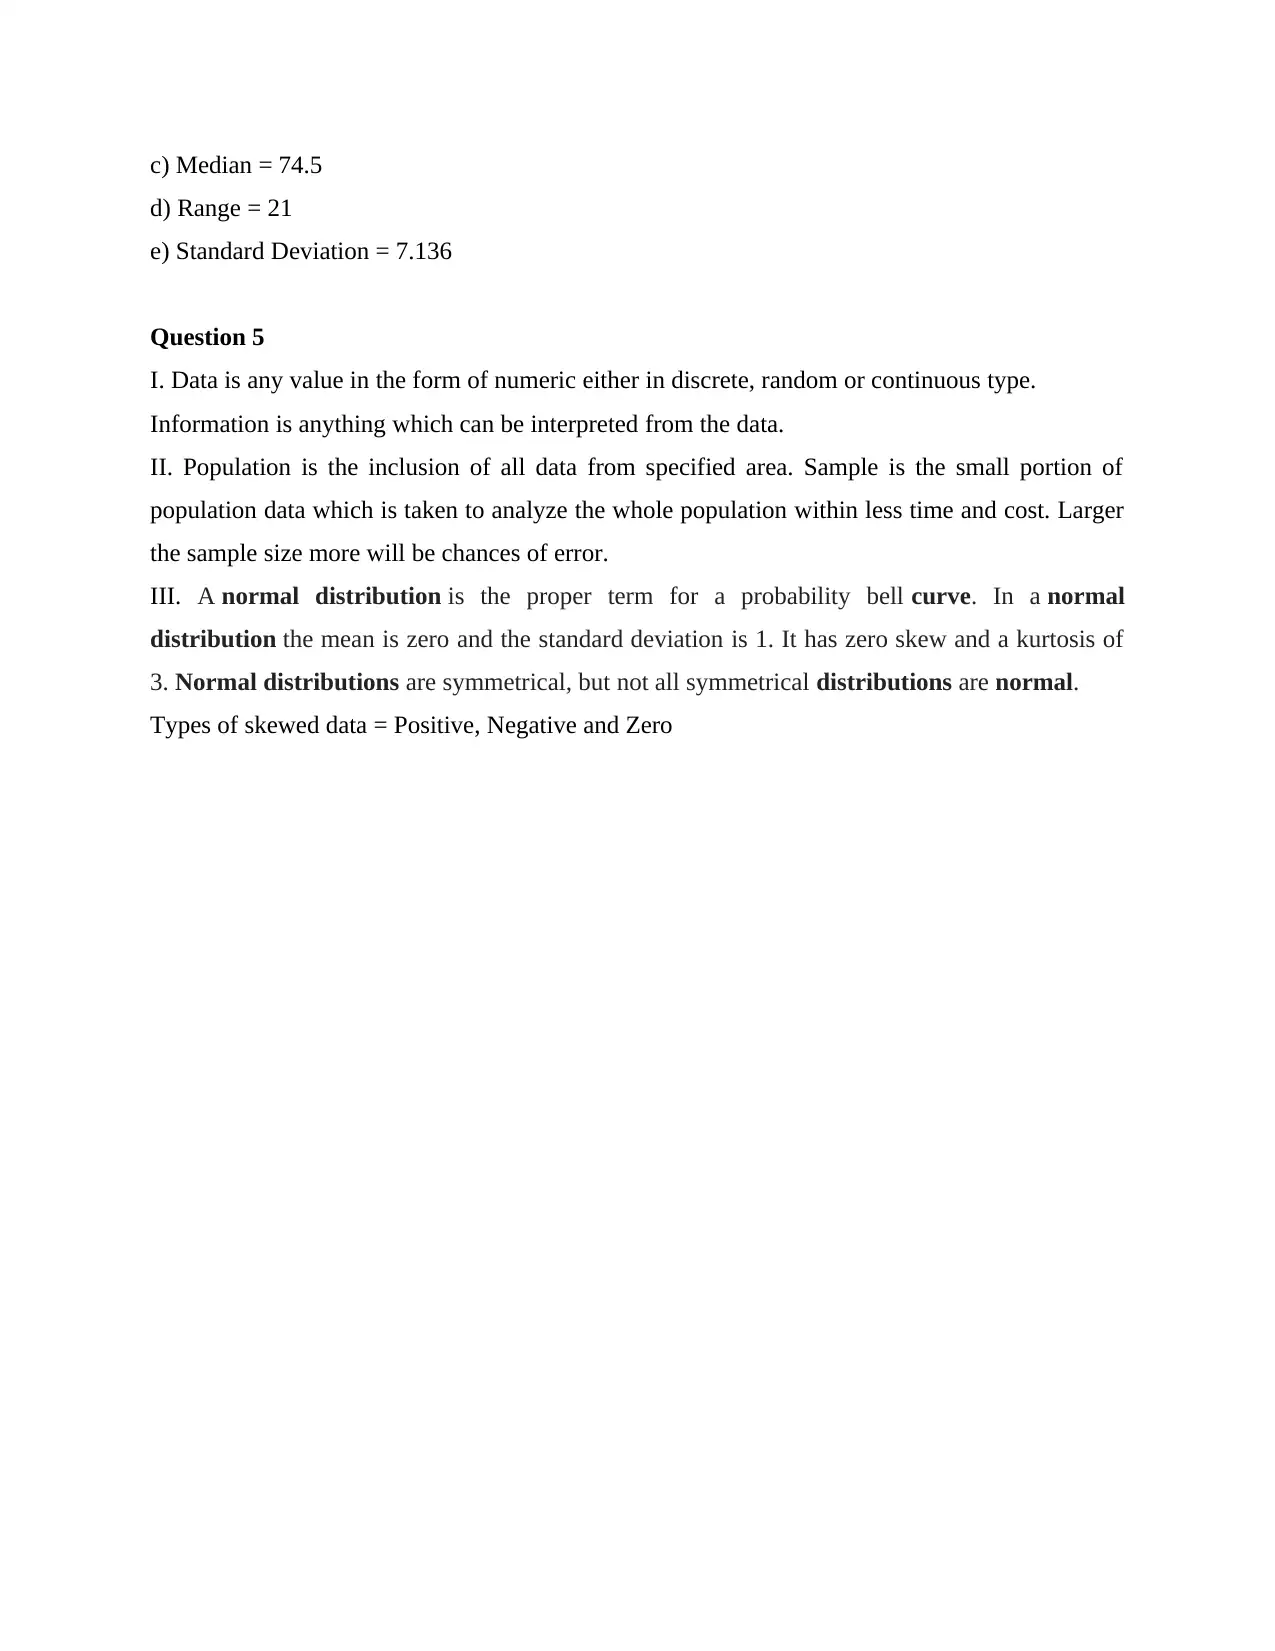
This document presents a comprehensive solution to a Numeracy and Data Analysis exam, specifically for the BABS Foundation Level at the London School of Commerce in association with the University of Suffolk. The solution covers both Part A and Part B questions, addressing various topics including calculations involving fractions and exponents, percentage calculations, probability, statistical measures (mean, mode, median, range, and standard deviation), and data interpretation. Part A includes calculations and problem-solving exercises, while Part B delves into data types, sampling techniques, and the concept of normal distribution. The assignment emphasizes practical applications of probability distributions in business decision-making, particularly in sales forecasting. The solution is handwritten as per the instructions and provides detailed steps and answers to all the questions.
1 out of 3
Related Documents


Your All-in-One AI-Powered Toolkit for Academic Success.
+13062052269
info@desklib.com
Available 24*7 on WhatsApp / Email
![[object Object]](/_next/static/media/star-bottom.7253800d.svg)
Copyright © 2020–2026 A2Z Services. All Rights Reserved. Developed and managed by ZUCOL.