Assignment: Analysis of Electricity Bills Using Data and Numeracy

Verified

Added on  2022/11/25

|8
|1522
|374
Homework Assignment
AI Summary
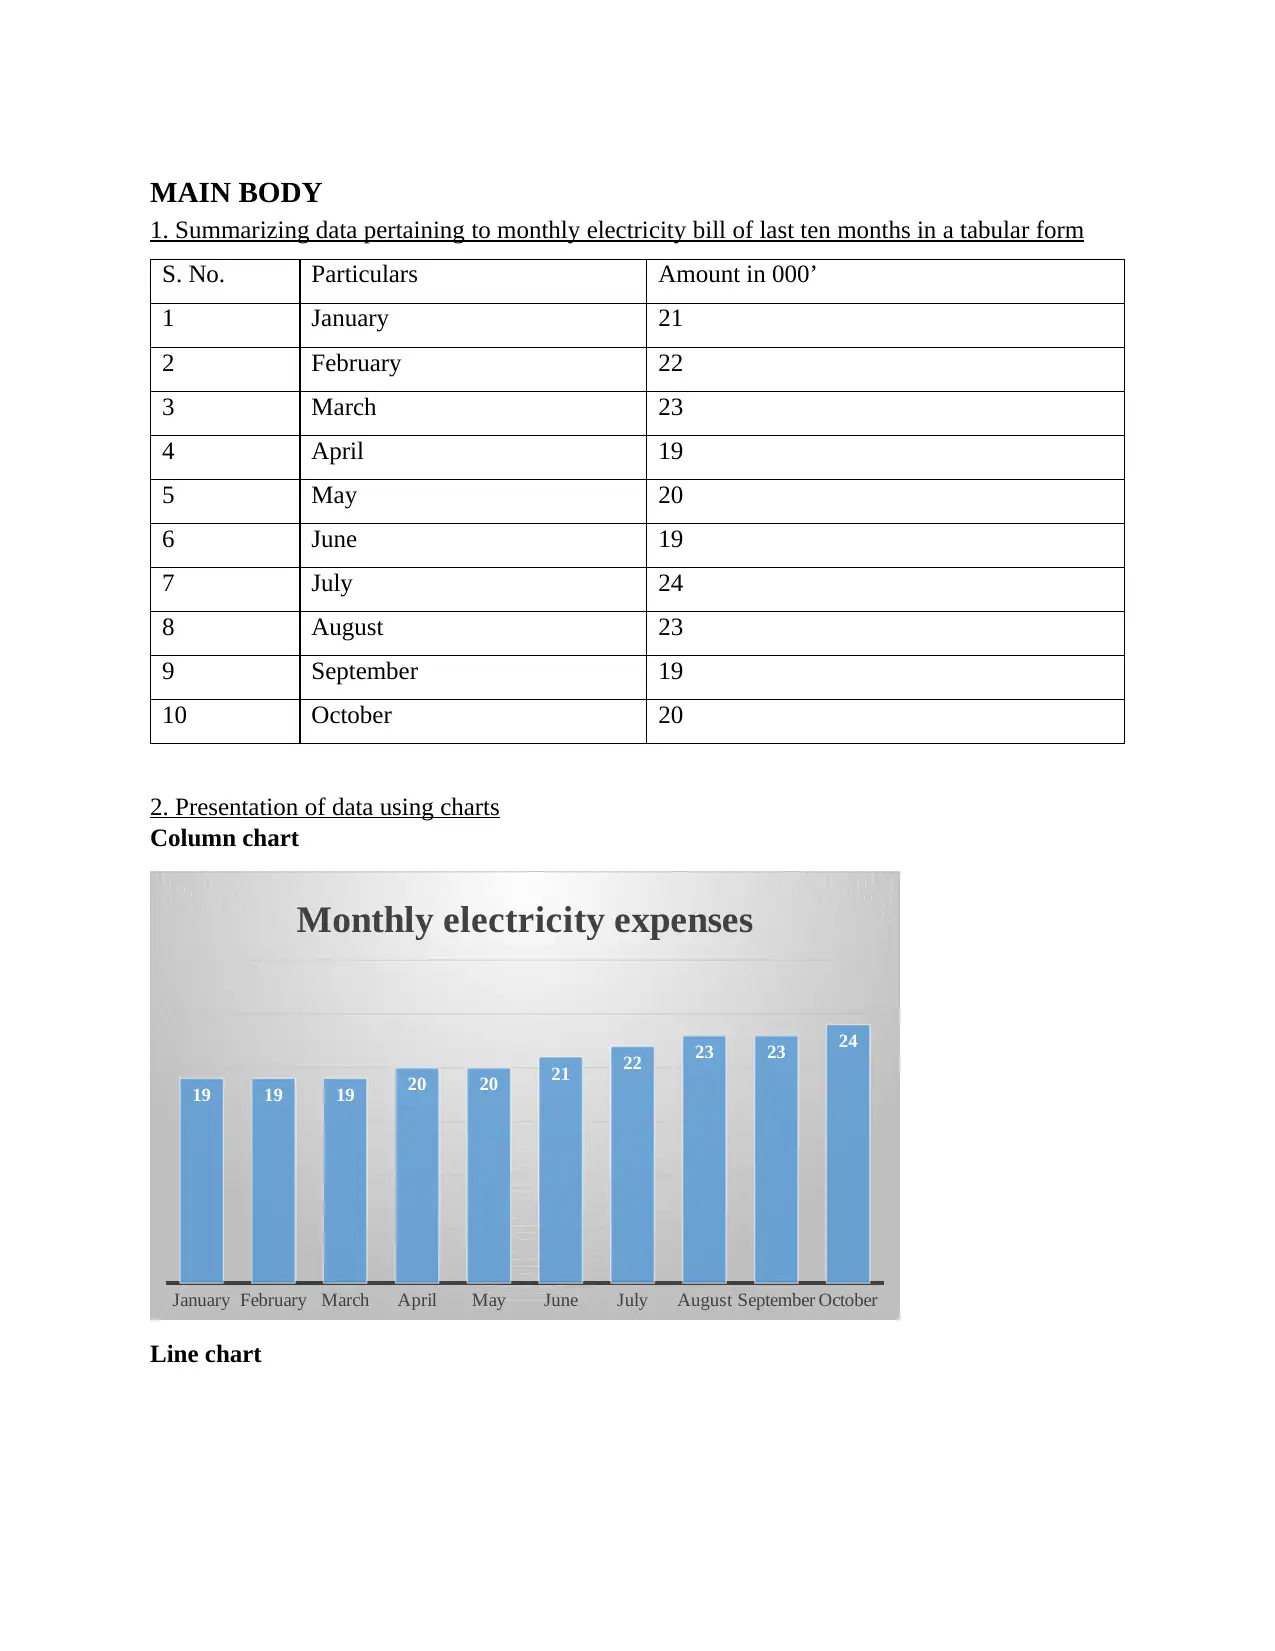
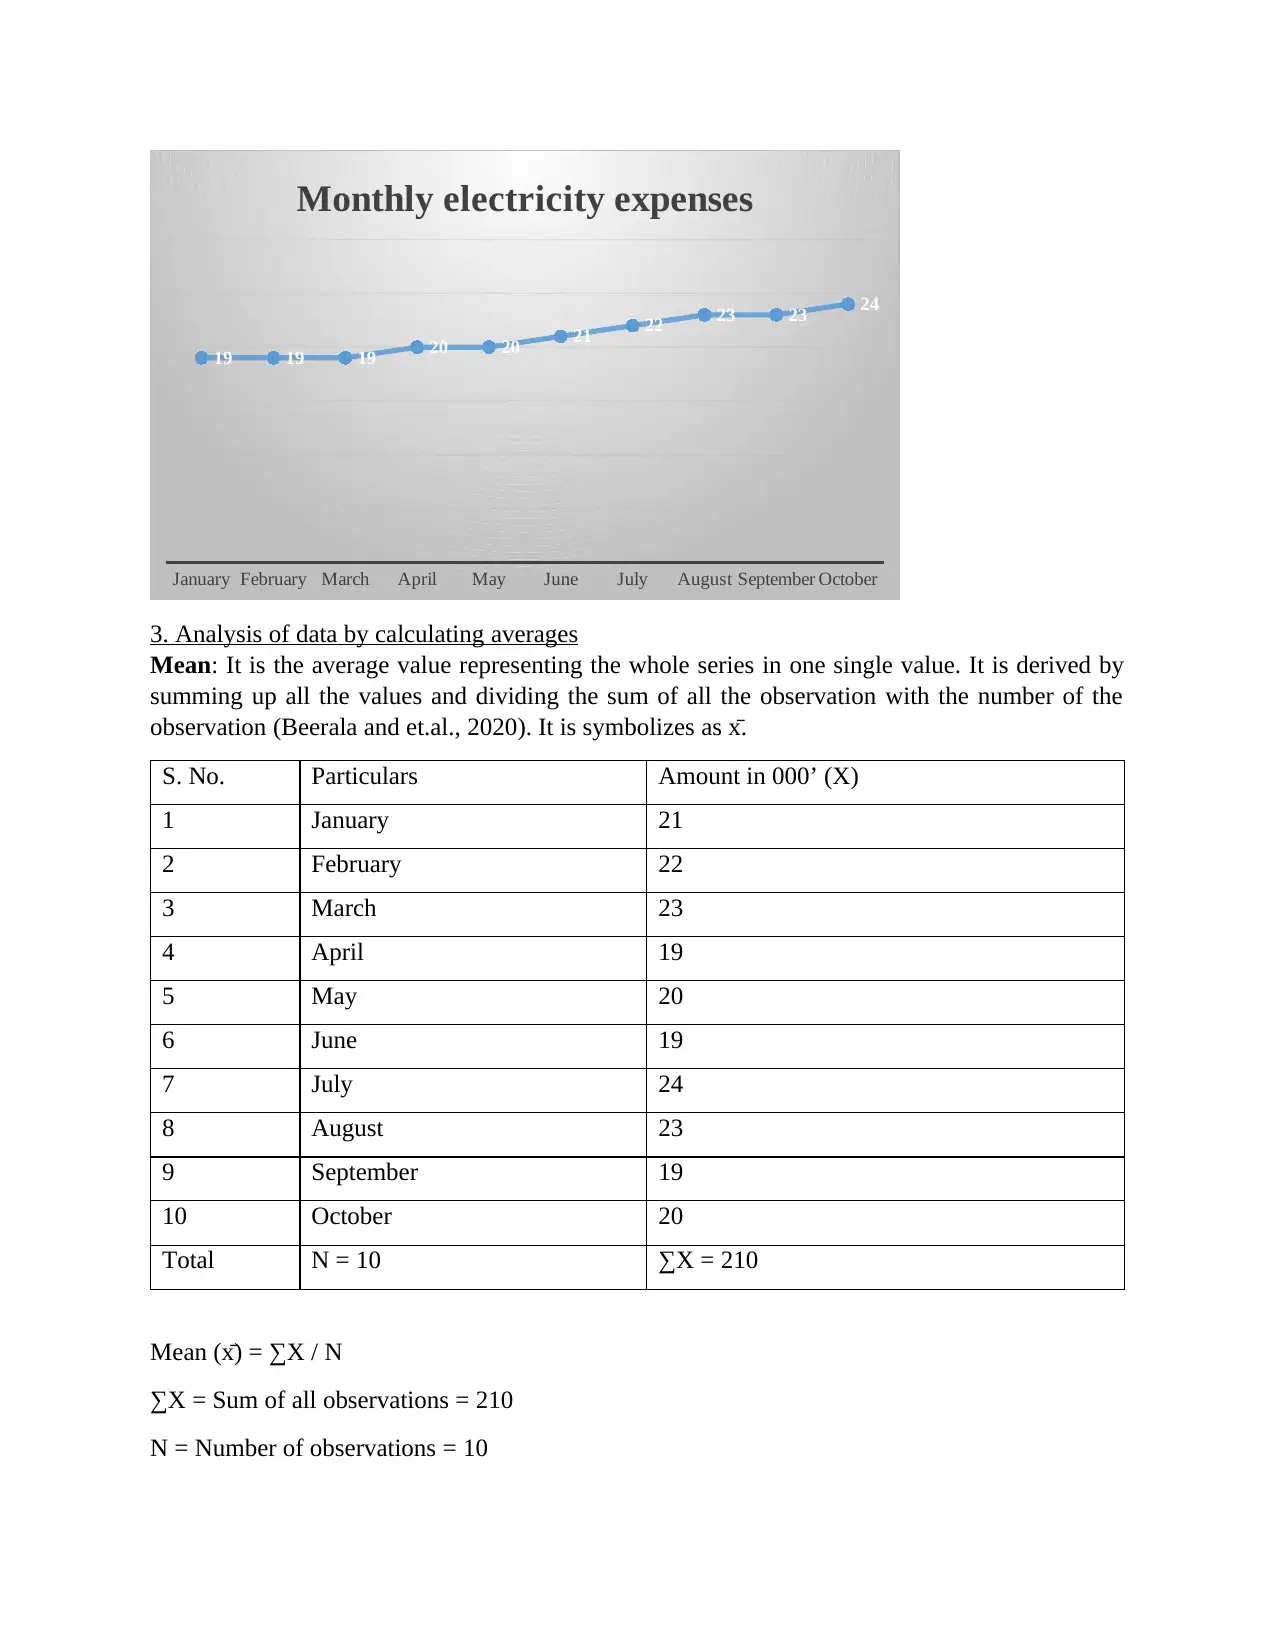
This assignment analyzes monthly electricity bill data using various statistical techniques. The analysis begins with summarizing the data in a tabular format, followed by data presentation using column and line charts. The core of the assignment involves calculating descriptive statistics, including mean, median, mode, range, and standard deviation to understand the central tendency and variability of the electricity expenses over a ten-month period. Furthermore, a linear forecasting model is developed and applied to predict future electricity expenses, demonstrating the practical application of statistical concepts. The assignment includes step-by-step calculations and interpretations, offering a comprehensive understanding of data analysis and forecasting.
Document Page
NUMERACY AND DATA
ANALYSIS
tabler-icon-diamond-filled.svg

Paraphrase This Document

Need a fresh take? Get an instant paraphrase of this document with our AI Paraphraser
Document Page
Table of Contents
MAIN BODY..................................................................................................................................3
1. Summarizing data pertaining to monthly electricity bill of last ten months in a tabular form3
2. Presentation of data using charts.............................................................................................3
3. Analysis of data by calculating averages.................................................................................4
4. Linear forecasting model.........................................................................................................6
REFERENCES................................................................................................................................8
Document Page
MAIN BODY
1. Summarizing data pertaining to monthly electricity bill of last ten months in a tabular form
S. No. Particulars Amount in 000’
1 January 21
2 February 22
3 March 23
4 April 19
5 May 20
6 June 19
7 July 24
8 August 23
9 September 19
10 October 20
2. Presentation of data using charts
Column chart
January February March April May June July August September October
19 19 19 20 20 21 22 23 23 24
Monthly electricity expenses
Line chart
Document Page
January February March April May June July August September October
19 19 19 20 20 21 22 23 23 24
Monthly electricity expenses
3. Analysis of data by calculating averages
Mean: It is the average value representing the whole series in one single value. It is derived by
summing up all the values and dividing the sum of all the observation with the number of the
observation (Beerala and et.al., 2020). It is symbolizes as x̄.
S. No. Particulars Amount in 000’ (X)
1 January 21
2 February 22
3 March 23
4 April 19
5 May 20
6 June 19
7 July 24
8 August 23
9 September 19
10 October 20
Total N = 10 ∑X = 210
Mean (x̄) = ∑X / N
∑X = Sum of all observations = 210
N = Number of observations = 10
tabler-icon-diamond-filled.svg

Paraphrase This Document

Need a fresh take? Get an instant paraphrase of this document with our AI Paraphraser
Document Page
x̄ = 210 / 10 = 21.
Median: It indicates the middle value of the series of observations. The middle value so obtained
it taken as the average value of the observations (Vaske, 2019). When there is odd number of
items, then the formula used is (n + 1 / 2). This formula gives the location of the median value.
Median is symbolizes as M.
As in the case given here, there is an individual series of monthly electricity expenses where the
number of observation is even that is 10, so first of all the series will be arranged in ascending
order then there will be two numbers in the middle of the series, both the numbers will be added
together and divided by two, this will gives us the median or middle value of the series (Friedli
and Velenik, 2017). The following table shows the series of monthly electricity arranged in an
ascending order.
S. No. Expenses
4 19
6 19
9 19
5 20
10 20
1 21
2 22
3 23
8 23
7 24
N = 10
Median = two values in the middle that is, 5th and 6th item of the series
= 20 + 21 / 2 = 41 / 2 = 20.5.
Mode: Frequently appearing value in the series is taken as the value of mode. The mode has the
highest frequency among other items in the series (Azzalini, 2017). It is symbolizes as Mo.
The most frequently appearing value in the above given data pertaining to monthly electricity
expenses is 19.
Range: It indicates the difference between the highest value in a given set of observation and the
lowest value in a set of observation (Guha, 2017). It is symbolizes as R.
Range (R) = Highest value in the series (H) - lowest value in the series (L) = 24 – 19 = 5.
Standard deviation: It indicates how much amount of deviation is present between the values in
the series from the average value of the series. A low standard deviation indicates better mean
value than a high standard deviation which indicates poor value of mean (Xie, 2018). First of all
mean value is determined for the series of number, then subtract this mean value from each value
of the series along with squaring the results at each level, then average out the sum of squared
value and finally obtain the square root of this average. It is symbolizes as σ.
Document Page
S. No. X (expenses) x - x̄ (x - x̄)2
1 21 21 – 21 = 0 (0)2 = 0
2 22 22 – 21 = -1 (-1)2 = 1
3 23 23 – 21 = 2 (2)2 = 4
4 19 19 – 21 = -2 (-2)2 = 4
5 20 20 – 21 = -1 (-1)2 = 1
6 19 19 – 21 = -2 (-2)2 = 4
7 24 24 – 21 = 3 (3)2 = 9
8 23 23 – 21 = 2 (2)2 = 4
9 19 19 – 21 = -2 (-2)2 = 4
10 20 20 – 21 = -1 (-1)2 = 1
N = 10 ∑x = 210
x̄ = 210 / 10
= 21
∑(x - x̄)2 = 32
σ = √ ∑(x - x̄)2/ N
σ = √ 32 / 10 = √ 3.2 = 1.79.
4. Linear forecasting model
Forecasting model = y = mx + c
(i) Steps for calculating the value of m
m = n (∑xy) – (∑x) (∑y) / n (∑x2) – (∑x)2
S. No. (x) Expenses (y) x2 y2 xy
1 21 1 441 21
2 22 4 484 44
3 23 9 529 69
4 19 16 361 76
5 20 25 400 100
6 19 36 361 114
7 24 49 576 168
8 23 64 529 184
9 19 81 361 171
10 20 100 400 200
n = 10
∑x = 55
∑y = 210 ∑x2 = 385 ∑y2 = 4442 ∑xy = 1147
Putting the value in the above formula to determine the value of m as follows:
m = 10 * (1147) – 55 * 210 / 10 * (385) – (55)2
m = 11470 – 11550 / 3850 – 3025 = -80 / 825 = -0.097
Document Page
Therefore, m = -0.097 indicates the slope of the linear regression line.
(ii) Step for calculating the value of c
c = (∑y) (∑x2) – (∑x) (∑xy) / n (∑x2) – (∑x)2
c = 210 * 385 – 55 * 1147 / 10 * 385 – (55)2
c = 80850 * 63085 / 3850 – 3025 = 17765 / 825 = 21.53
Therefore, c = 21.53 indicates the intercept of the linear regression line which is the average
value of y, when the x = 0.
So, the linear forecasting model = y = -0.097x + 21.53
(iii) Forecasting the expenses on day 12 and day 14 through linear regression model
Expenses on day (or month) 12, where x = 12 is as follows:
y = -0.097 * 12 + 21.53 = -1.164 + 21.53 = 20.366
Expenses on day (or month) 14, where x = 14 is as follows:
y = -0.097 * 14 + 21.53 = -1.358 + 21.53 = 20.172
tabler-icon-diamond-filled.svg

Paraphrase This Document

Need a fresh take? Get an instant paraphrase of this document with our AI Paraphraser
Document Page
REFERENCES
Xie, Y., 2018. Case Study of Core Concepts of Statistics Teaching in Two High Schools in
China. Journal of Mathematics Education, 11(3), pp.54-68.
Friedli, S. and Velenik, Y., 2017. Statistical mechanics of lattice systems: a concrete
mathematical introduction. Cambridge University Press.
Vaske, J. J., 2019. Survey research and analysis. Sagamore-Venture. 1807 North Federal Drive,
Urbana, IL 61801.
Azzalini, A., 2017. Statistical inference: Based on the likelihood. Routledge.
Vance, L. L., 2020. I. Fundamental Concepts. In Scientific Method of Auditing (pp. 1-11).
University of California Press.
Beerala, A. K., and et.al., 2020. Water Quality Prediction Using Statistical Tool and Machine
Learning Algorithm. In Waste Management: Concepts, Methodologies, Tools, and
Applications (pp. 609-623). IGI Global.
Guha, M., 2017. Statistics from A to Z: Confusing Concepts Clarified. Reference Reviews.
chevron_up_icon
1 out of 8
circle_padding
hide_on_mobile
zoom_out_icon
[object Object]