Numeracy and Data Analysis of Edinburgh Wind Speed Report

Verified

Added on  2023/06/10

|10
|1609
|96
Report
AI Summary
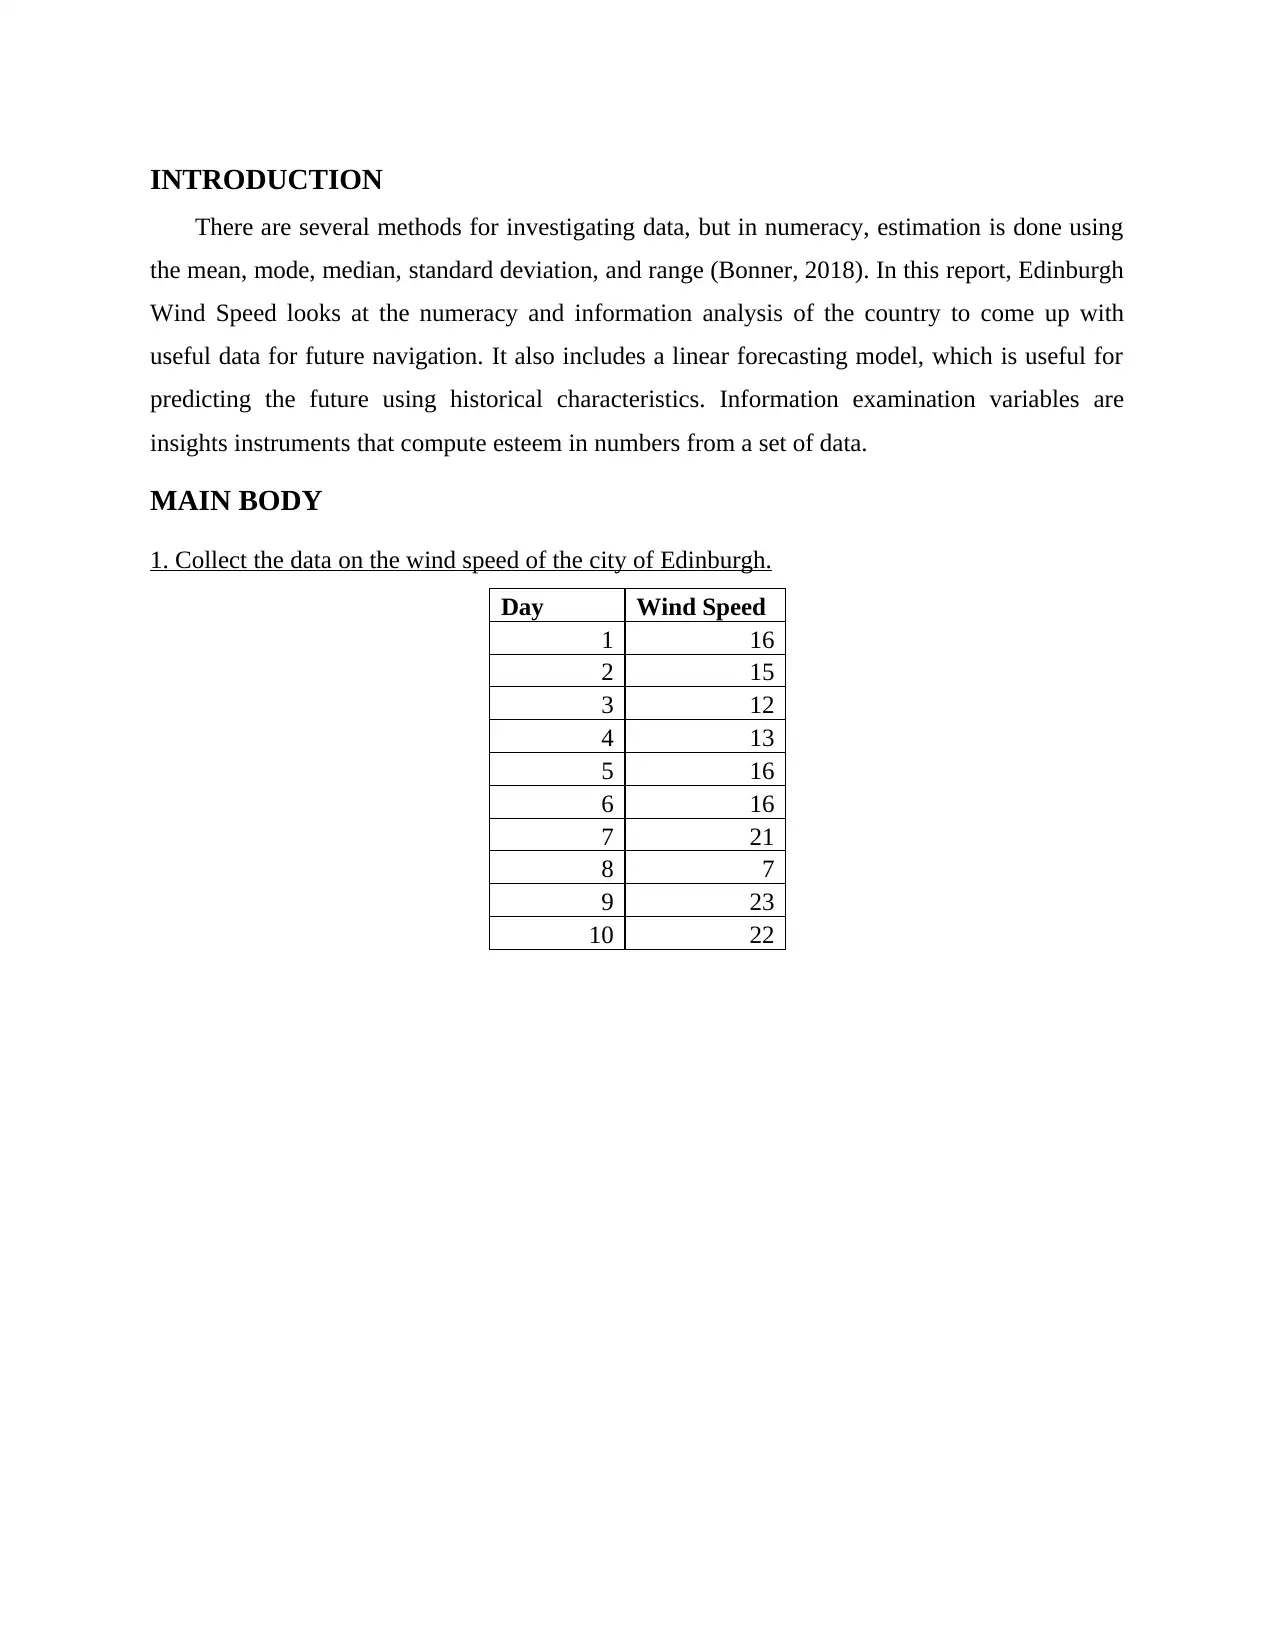
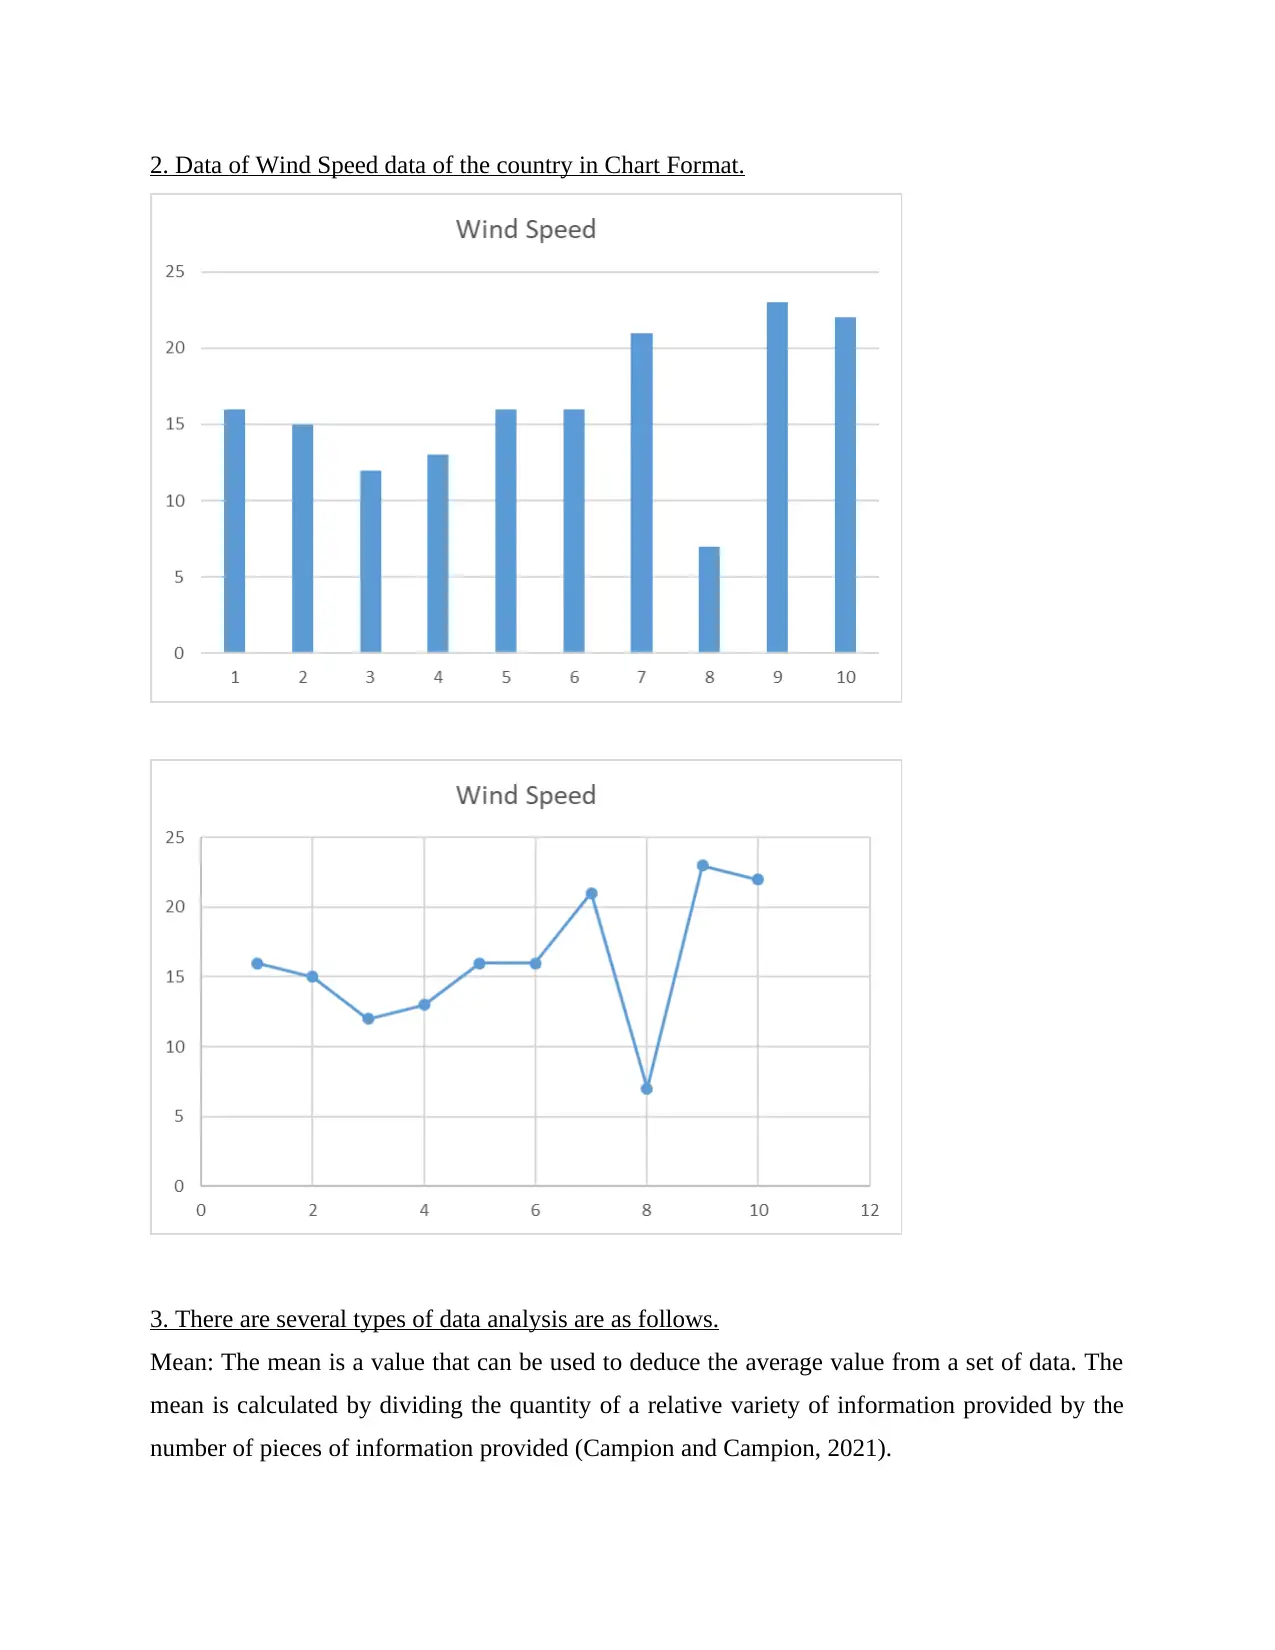
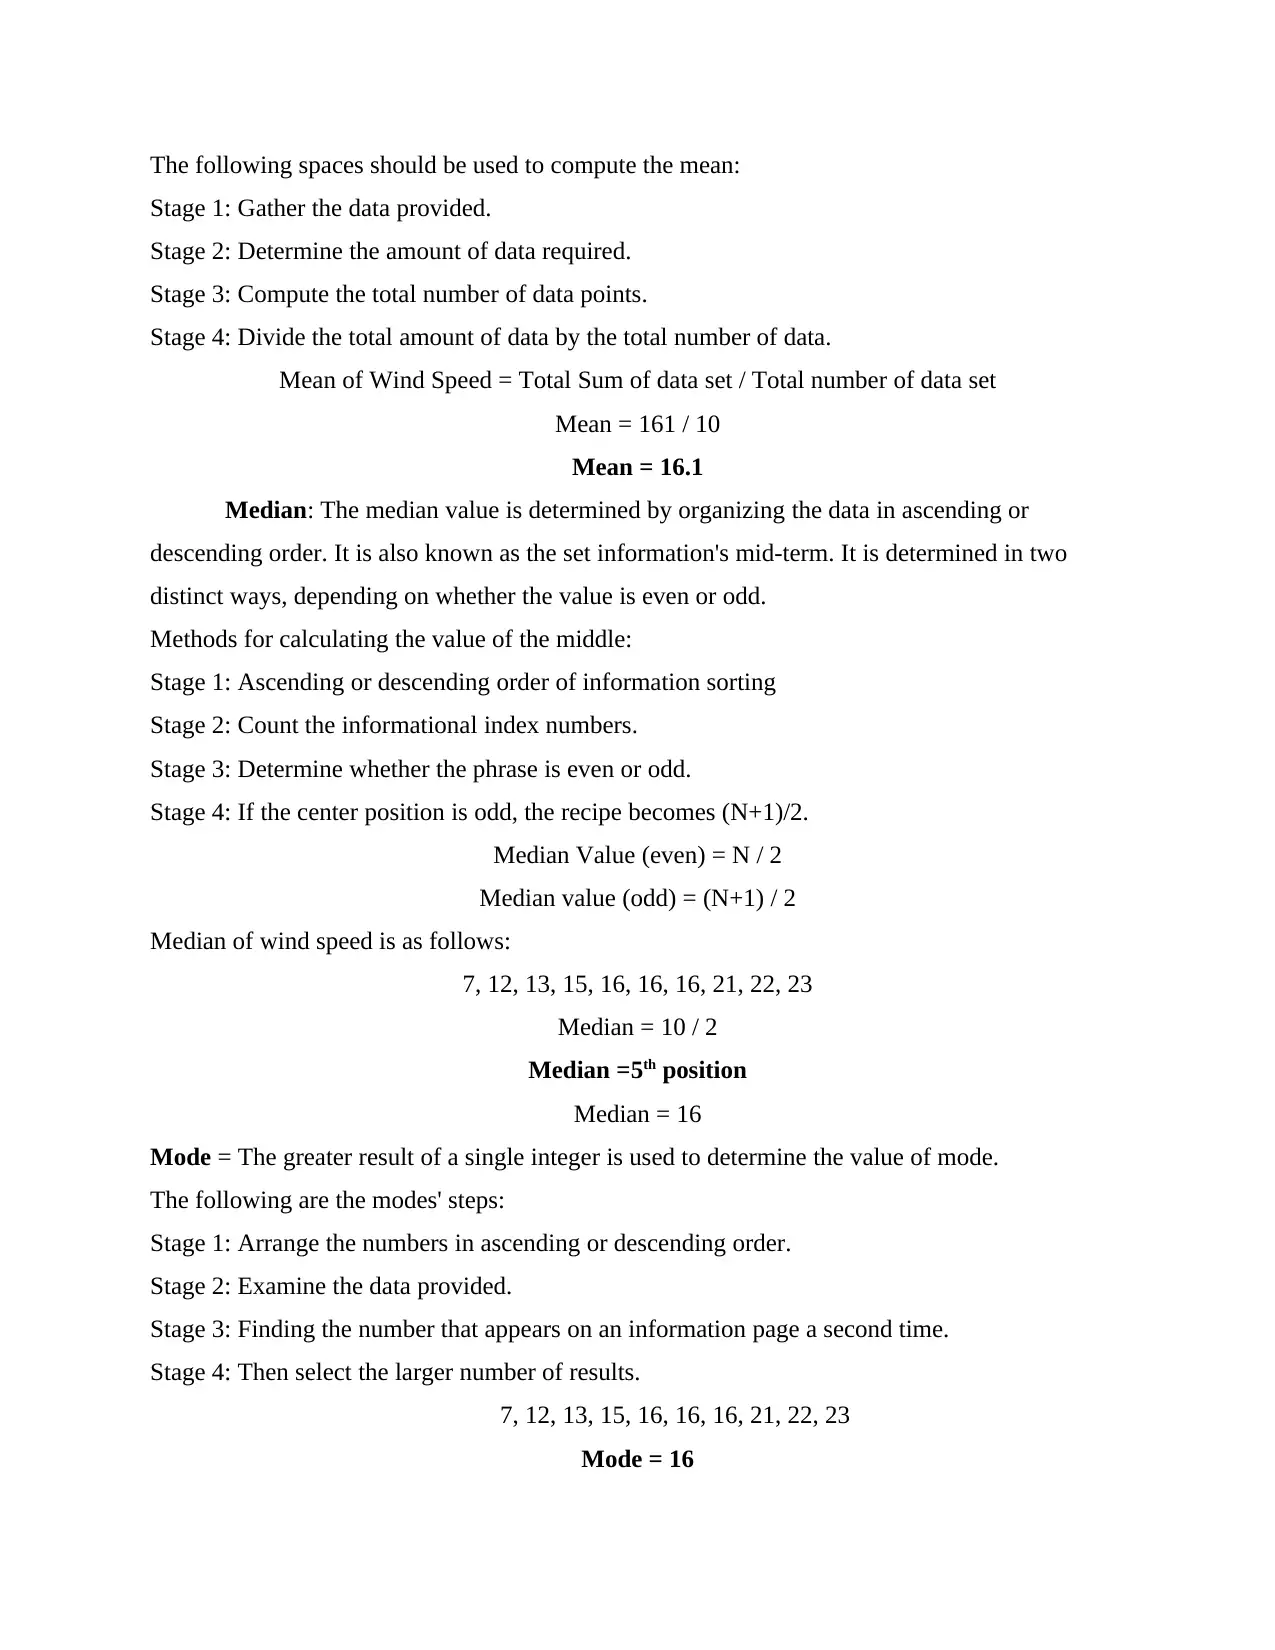
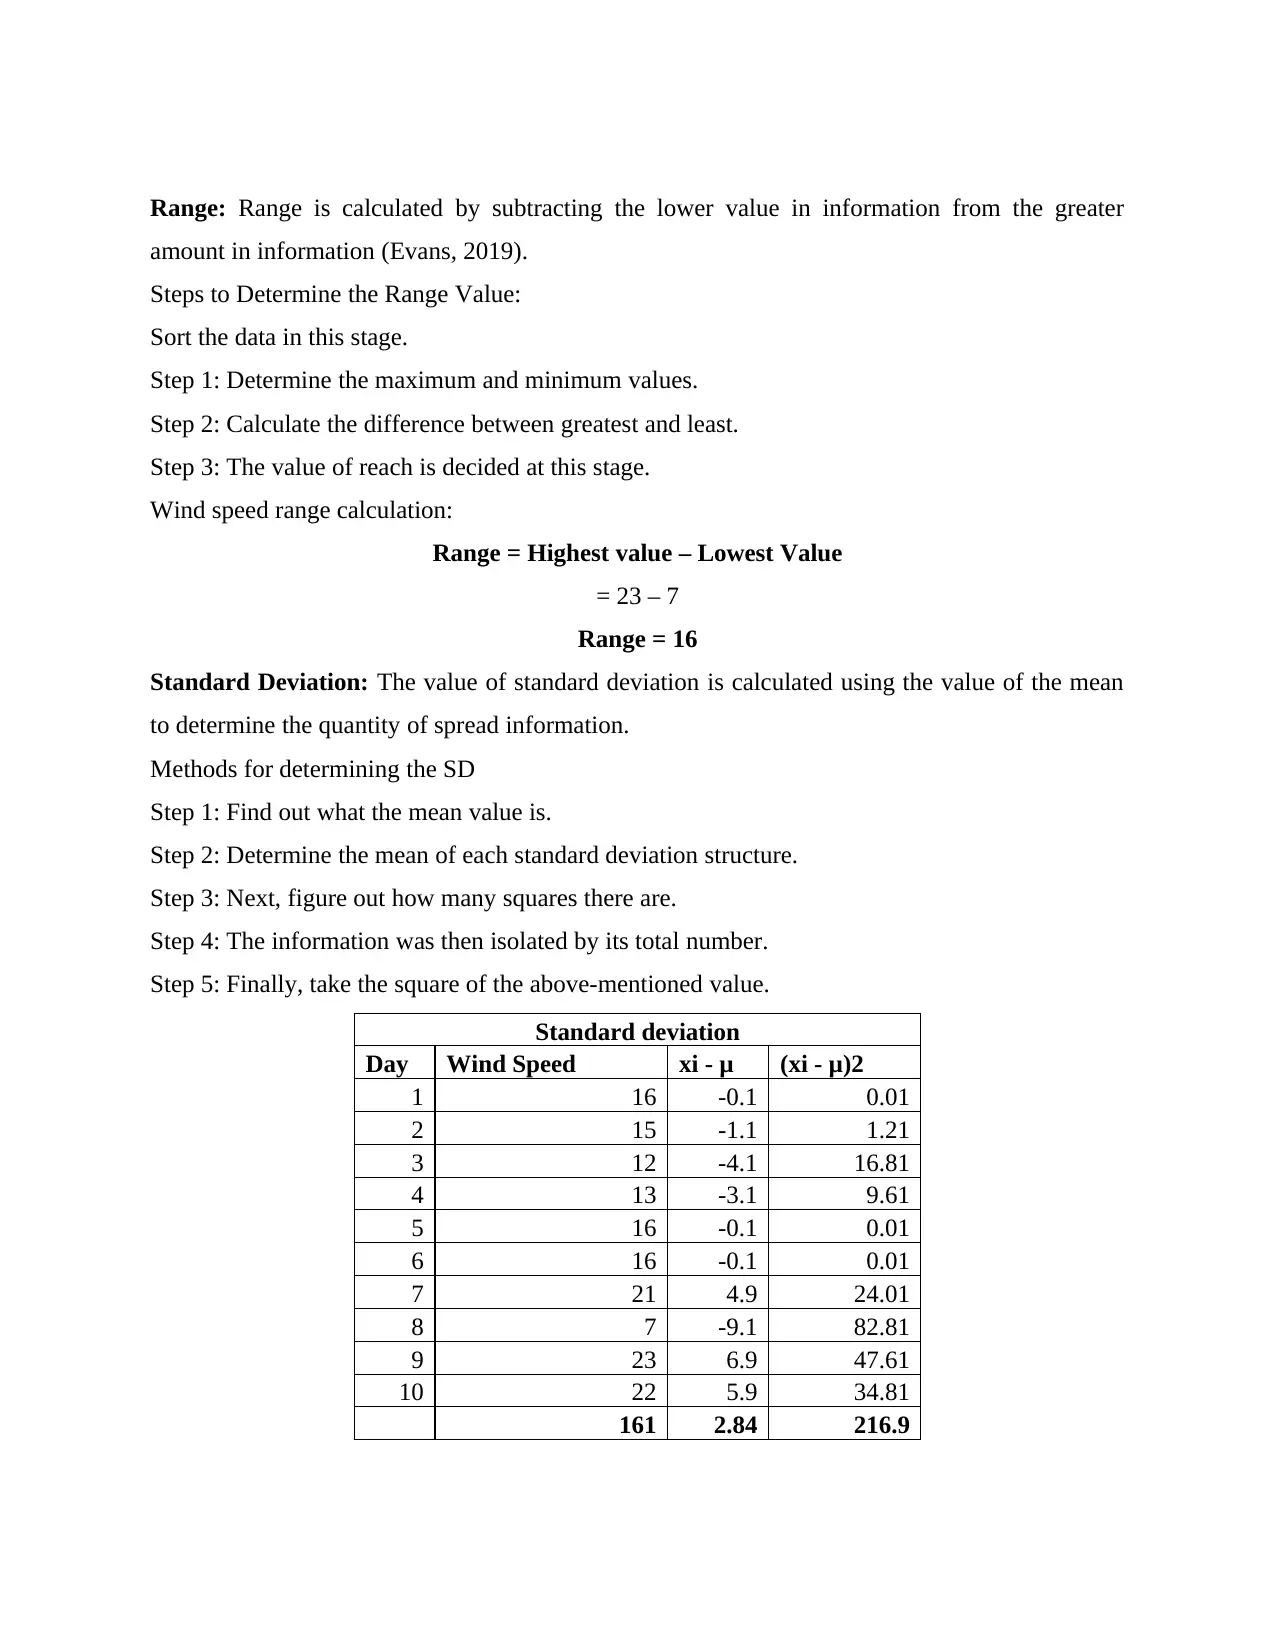
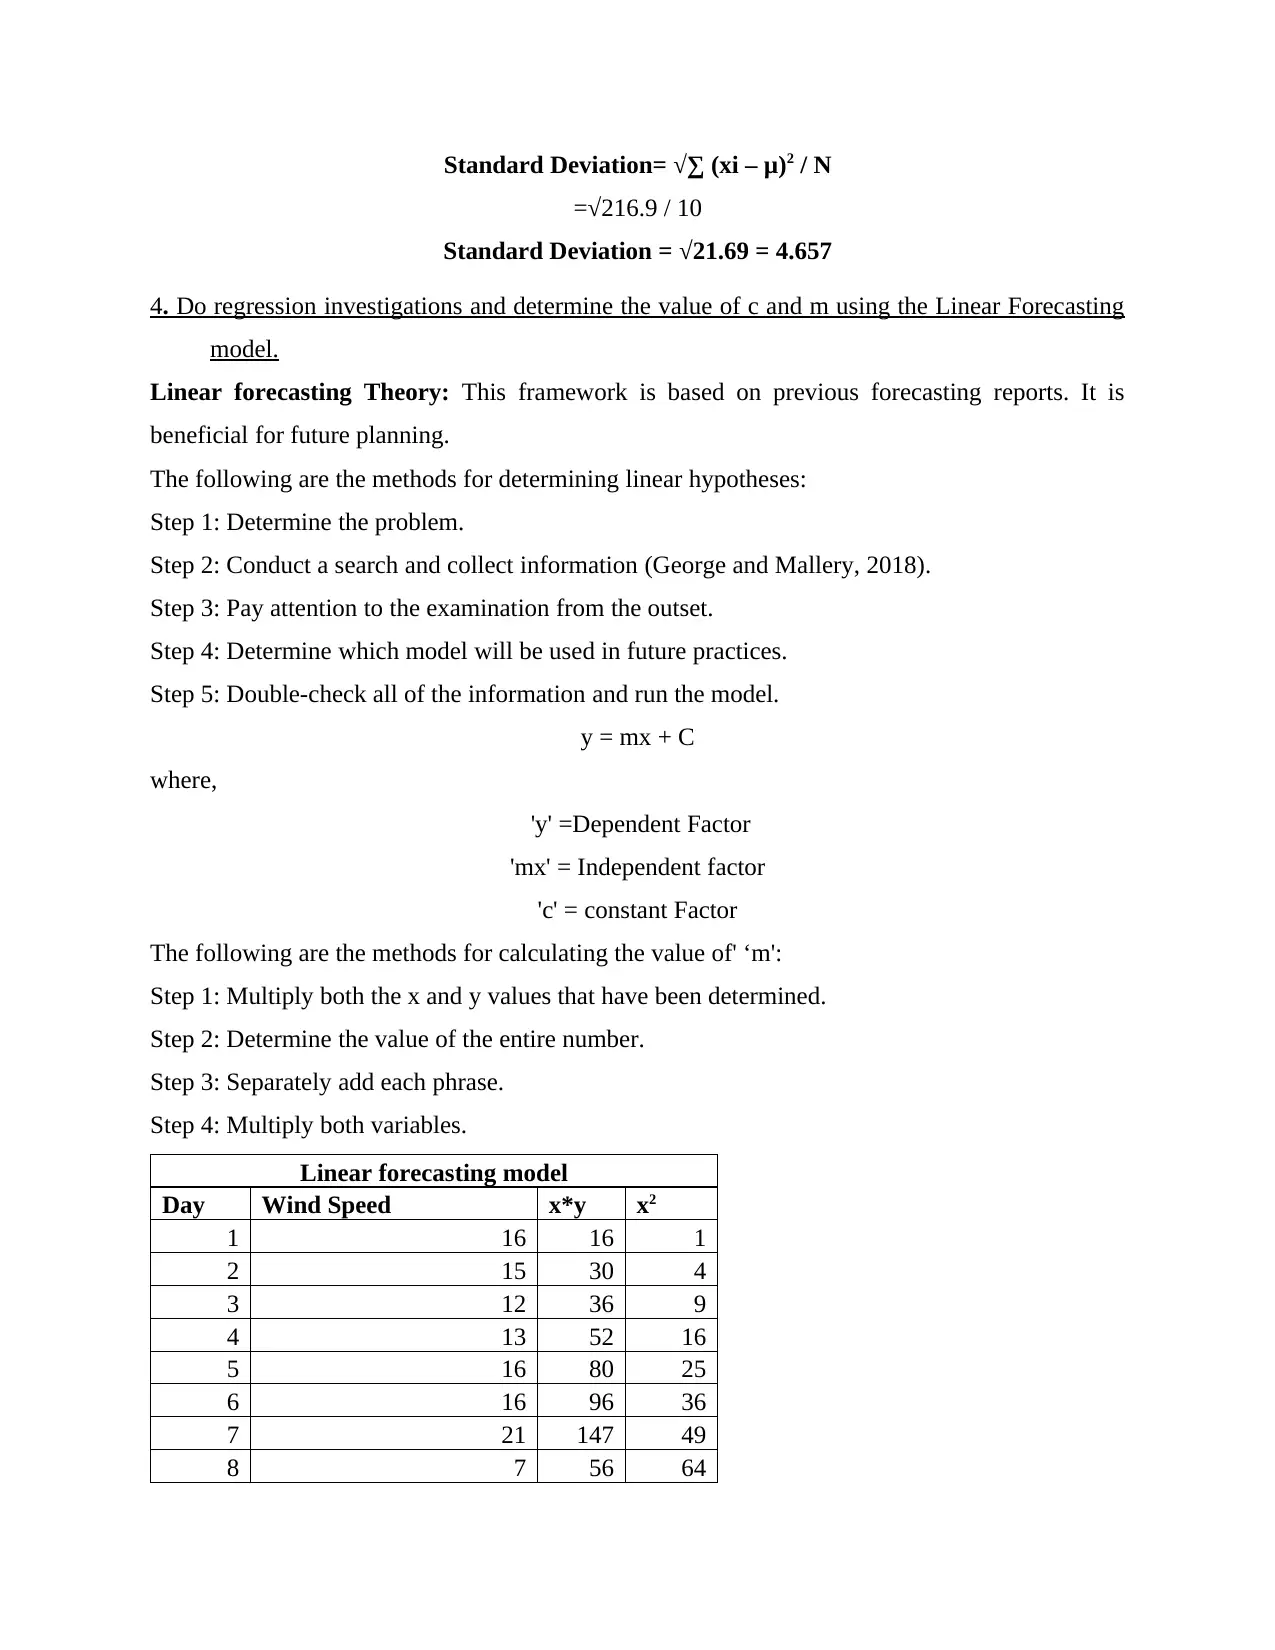
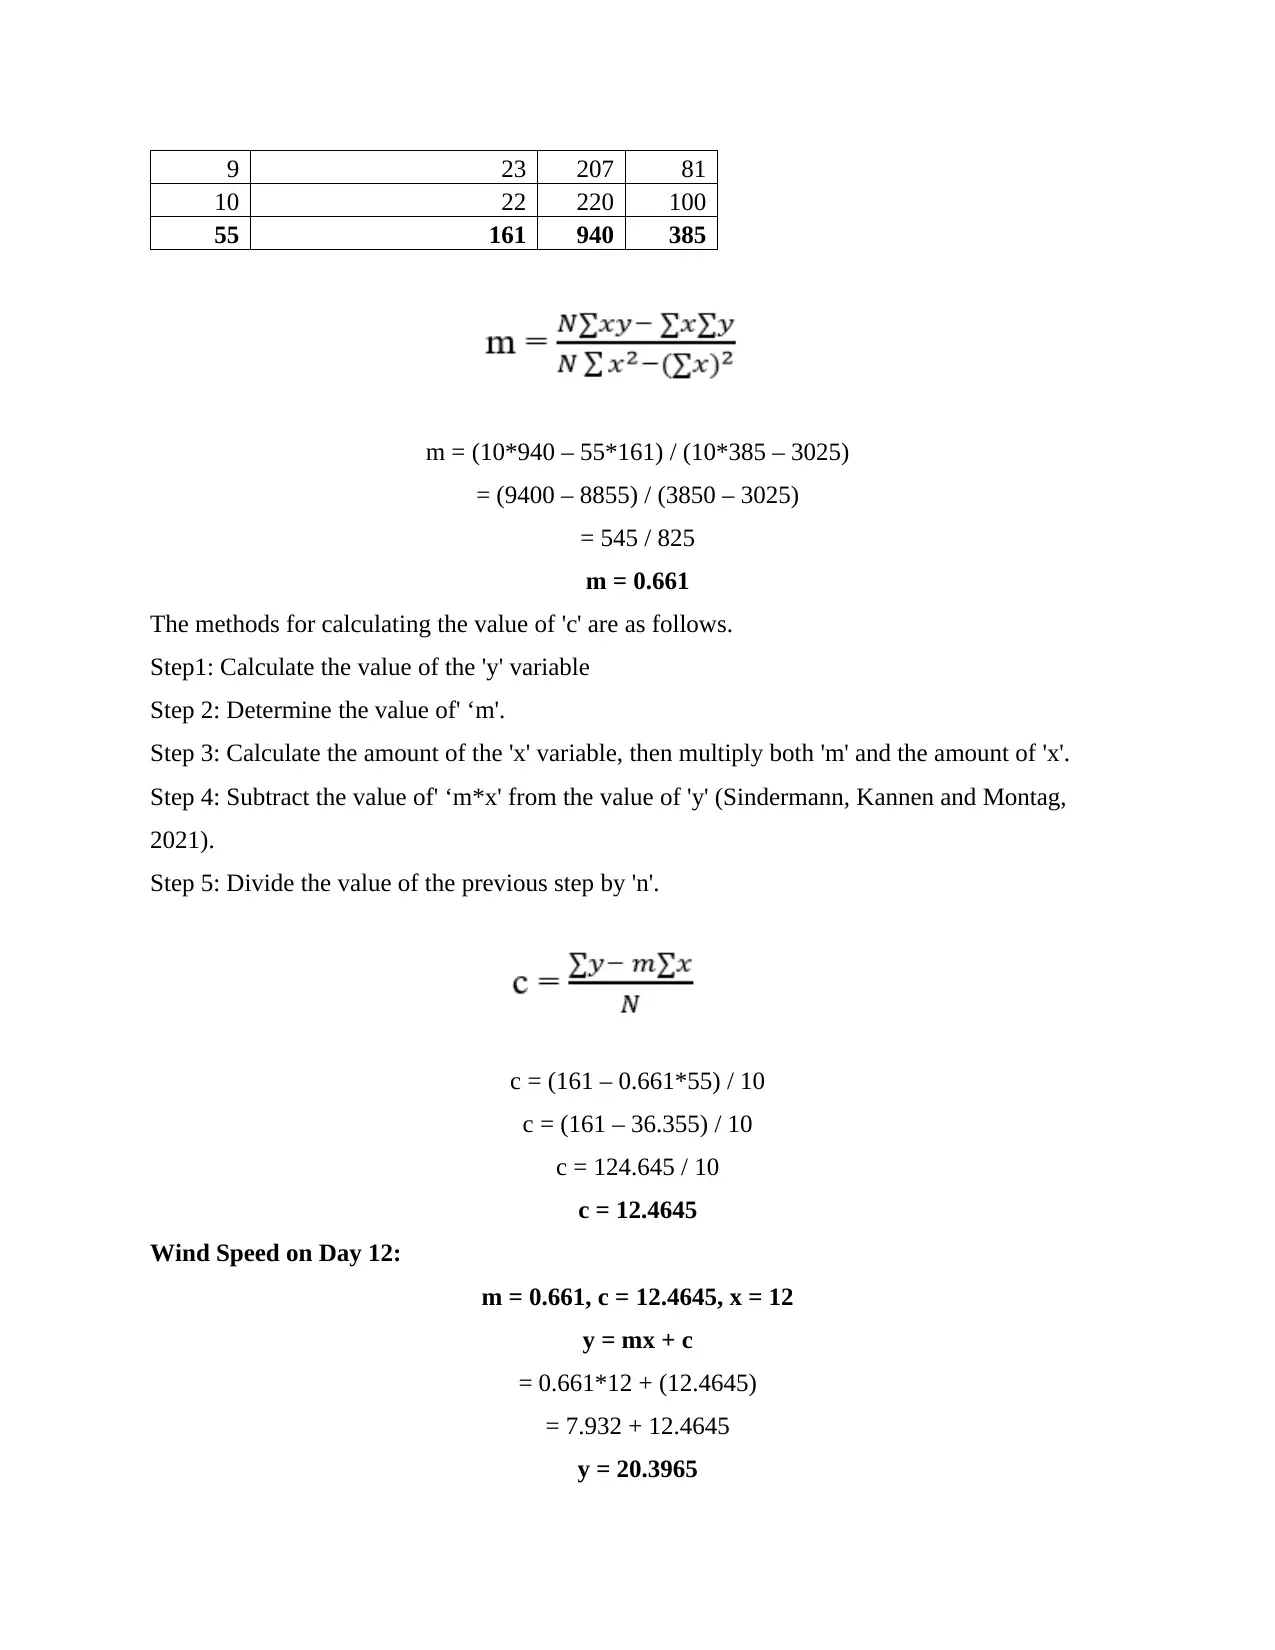
This report presents a comprehensive analysis of Edinburgh's wind speed data. It begins by collecting and organizing the data, followed by the application of various statistical methods, including calculating the mean, median, mode, range, and standard deviation. The report then delves into linear forecasting, explaining the model and its application to predict future wind speeds. Regression investigations are conducted to determine the values of 'c' and 'm' within the linear forecasting model. The report concludes by summarizing the findings and providing relevant references. The analysis aims to provide insights into the numeracy and data analysis of wind speed, offering valuable information for future predictions and planning.
Document Page
And Data Analysis
tabler-icon-diamond-filled.svg

Paraphrase This Document

Need a fresh take? Get an instant paraphrase of this document with our AI Paraphraser
Document Page
Contents
INTRODUCTION...........................................................................................................................3
MAIN BODY..................................................................................................................................3
1. Collect the data on the wind speed of the city of Edinburgh...................................................3
2. Data of Wind Speed data of the country in Chart Format.......................................................4
3. There are several types of data analysis are as follows...........................................................4
4. Do regression investigations and determine the value of c and m using the Linear
Forecasting model........................................................................................................................7
CONCLUSION................................................................................................................................9
REFERENCES..............................................................................................................................10
Document Page
INTRODUCTION
There are several methods for investigating data, but in numeracy, estimation is done using
the mean, mode, median, standard deviation, and range (Bonner, 2018). In this report, Edinburgh
Wind Speed looks at the numeracy and information analysis of the country to come up with
useful data for future navigation. It also includes a linear forecasting model, which is useful for
predicting the future using historical characteristics. Information examination variables are
insights instruments that compute esteem in numbers from a set of data.
MAIN BODY
1. Collect the data on the wind speed of the city of Edinburgh.
Day Wind Speed
1 16
2 15
3 12
4 13
5 16
6 16
7 21
8 7
9 23
10 22
Document Page
2. Data of Wind Speed data of the country in Chart Format.
3. There are several types of data analysis are as follows.
Mean: The mean is a value that can be used to deduce the average value from a set of data. The
mean is calculated by dividing the quantity of a relative variety of information provided by the
number of pieces of information provided (Campion and Campion, 2021).
tabler-icon-diamond-filled.svg

Paraphrase This Document

Need a fresh take? Get an instant paraphrase of this document with our AI Paraphraser
Document Page
The following spaces should be used to compute the mean:
Stage 1: Gather the data provided.
Stage 2: Determine the amount of data required.
Stage 3: Compute the total number of data points.
Stage 4: Divide the total amount of data by the total number of data.
Mean of Wind Speed = Total Sum of data set / Total number of data set
Mean = 161 / 10
Mean = 16.1
Median: The median value is determined by organizing the data in ascending or
descending order. It is also known as the set information's mid-term. It is determined in two
distinct ways, depending on whether the value is even or odd.
Methods for calculating the value of the middle:
Stage 1: Ascending or descending order of information sorting
Stage 2: Count the informational index numbers.
Stage 3: Determine whether the phrase is even or odd.
Stage 4: If the center position is odd, the recipe becomes (N+1)/2.
Median Value (even) = N / 2
Median value (odd) = (N+1) / 2
Median of wind speed is as follows:
7, 12, 13, 15, 16, 16, 16, 21, 22, 23
Median = 10 / 2
Median =5th position
Median = 16
Mode = The greater result of a single integer is used to determine the value of mode.
The following are the modes' steps:
Stage 1: Arrange the numbers in ascending or descending order.
Stage 2: Examine the data provided.
Stage 3: Finding the number that appears on an information page a second time.
Stage 4: Then select the larger number of results.
7, 12, 13, 15, 16, 16, 16, 21, 22, 23
Mode = 16
Document Page
Range: Range is calculated by subtracting the lower value in information from the greater
amount in information (Evans, 2019).
Steps to Determine the Range Value:
Sort the data in this stage.
Step 1: Determine the maximum and minimum values.
Step 2: Calculate the difference between greatest and least.
Step 3: The value of reach is decided at this stage.
Wind speed range calculation:
Range = Highest value – Lowest Value
= 23 – 7
Range = 16
Standard Deviation: The value of standard deviation is calculated using the value of the mean
to determine the quantity of spread information.
Methods for determining the SD
Step 1: Find out what the mean value is.
Step 2: Determine the mean of each standard deviation structure.
Step 3: Next, figure out how many squares there are.
Step 4: The information was then isolated by its total number.
Step 5: Finally, take the square of the above-mentioned value.
Standard deviation
Day Wind Speed xi - μ (xi - μ)2
1 16 -0.1 0.01
2 15 -1.1 1.21
3 12 -4.1 16.81
4 13 -3.1 9.61
5 16 -0.1 0.01
6 16 -0.1 0.01
7 21 4.9 24.01
8 7 -9.1 82.81
9 23 6.9 47.61
10 22 5.9 34.81
161 2.84 216.9
Document Page
Standard Deviation= √∑ (xi – μ)2 / N
=√216.9 / 10
Standard Deviation = 21.69 = 4.657
4. Do regression investigations and determine the value of c and m using the Linear Forecasting
model.
Linear forecasting Theory: This framework is based on previous forecasting reports. It is
beneficial for future planning.
The following are the methods for determining linear hypotheses:
Step 1: Determine the problem.
Step 2: Conduct a search and collect information (George and Mallery, 2018).
Step 3: Pay attention to the examination from the outset.
Step 4: Determine which model will be used in future practices.
Step 5: Double-check all of the information and run the model.
y = mx + C
where,
'y' =Dependent Factor
'mx' = Independent factor
'c' = constant Factor
The following are the methods for calculating the value of' ‘m':
Step 1: Multiply both the x and y values that have been determined.
Step 2: Determine the value of the entire number.
Step 3: Separately add each phrase.
Step 4: Multiply both variables.
Linear forecasting model
Day Wind Speed x*y x2
1 16 16 1
2 15 30 4
3 12 36 9
4 13 52 16
5 16 80 25
6 16 96 36
7 21 147 49
8 7 56 64
tabler-icon-diamond-filled.svg

Paraphrase This Document

Need a fresh take? Get an instant paraphrase of this document with our AI Paraphraser
Document Page
9 23 207 81
10 22 220 100
55 161 940 385
m = (10*940 – 55*161) / (10*385 – 3025)
= (9400 – 8855) / (3850 – 3025)
= 545 / 825
m = 0.661
The methods for calculating the value of 'c' are as follows.
Step1: Calculate the value of the 'y' variable
Step 2: Determine the value of' ‘m'.
Step 3: Calculate the amount of the 'x' variable, then multiply both 'm' and the amount of 'x'.
Step 4: Subtract the value of' ‘m*x' from the value of 'y' (Sindermann, Kannen and Montag,
2021).
Step 5: Divide the value of the previous step by 'n'.
c = (161 – 0.661*55) / 10
c = (161 – 36.355) / 10
c = 124.645 / 10
c = 12.4645
Wind Speed on Day 12:
m = 0.661, c = 12.4645, x = 12
y = mx + c
= 0.661*12 + (12.4645)
= 7.932 + 12.4645
y = 20.3965
Document Page
Wind Speed on Day 14:
m = 0.661, c = 12.4645, x = 14
y = mx + c
= 0.661*14 + (12.4645)
= 9.254 - 12.4645
Y = -3.21
CONCLUSION
According to the report, the nation's wind speed demonstrates numeracy and information
accumulation. The mean, middle, mode, range, standard deviation, and directly determining
assumption of the nation or region are estimated in this report, and it is also beneficial for
identifying the two-day positive future of the country's wind speed.
Document Page
REFERENCES
Books and Journals
Bonner, M.D., 2018. Descriptive statistics. Police Abuse in Contemporary Democracies, p.257.
Campion, E.D. and Campion, M.A., 2021. Descriptive statistics and advanced text analytics: A
dual extension. Industrial and Organizational Psychology, 14(4), pp.489-492.
Evans, I.S., 2019. General geomorphometry, derivatives of altitude, and descriptive statistics.
In Spatial analysis in geomorphology (pp. 17-90). Routledge.
George, D. and Mallery, P., 2018. Descriptive statistics. In IBM SPSS Statistics 25 Step by
Step (pp. 126-134). Routledge.
Sindermann, C., Kannen, C. and Montag, C., 2021. The degree of heterogeneity of news
consumption in Germany—Descriptive statistics and relations with individual
differences in personality, ideological attitudes, and voting intentions. New Media &
Society, p.14614448211061729.
chevron_up_icon
1 out of 10
circle_padding
hide_on_mobile
zoom_out_icon
[object Object]