Numeracy and Data Analysis: Applying Forecasting Techniques
VerifiedAdded on 2023/06/15
|9
|1694
|204
Report
AI Summary
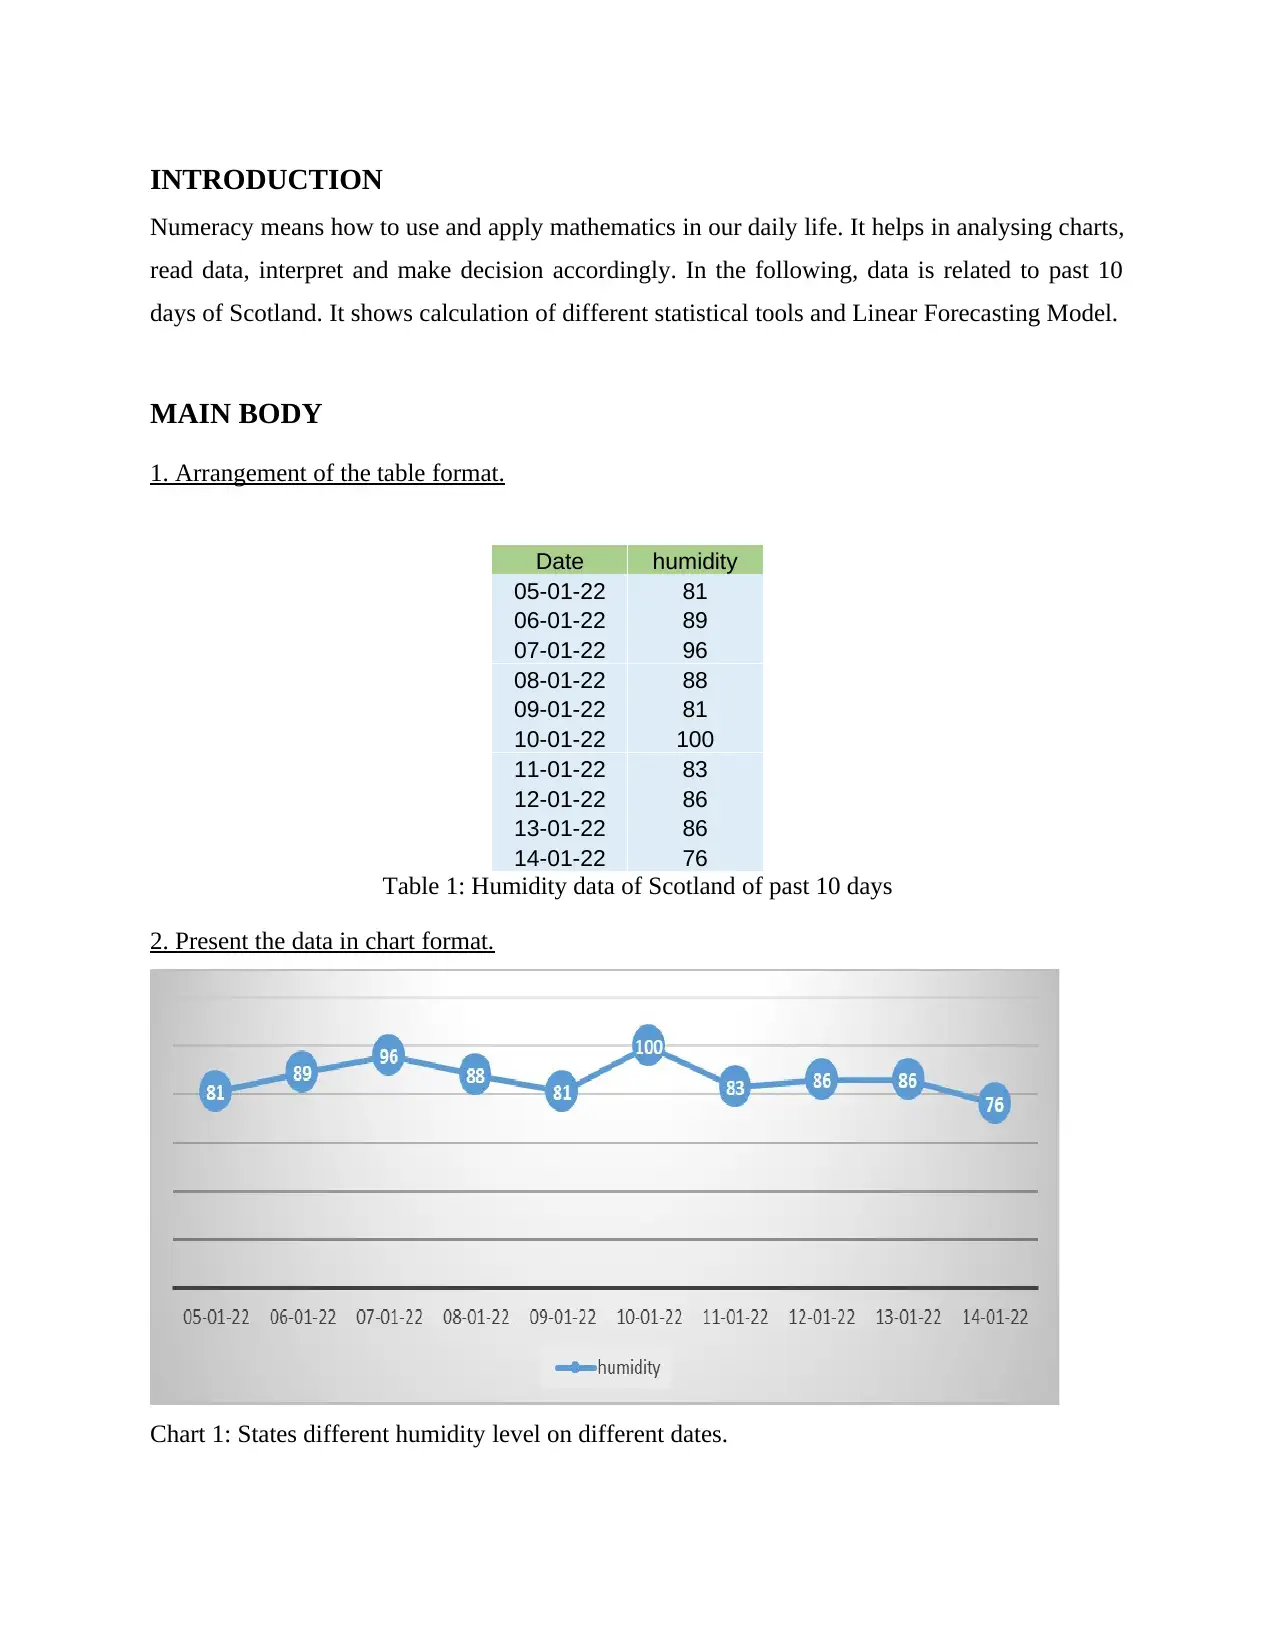
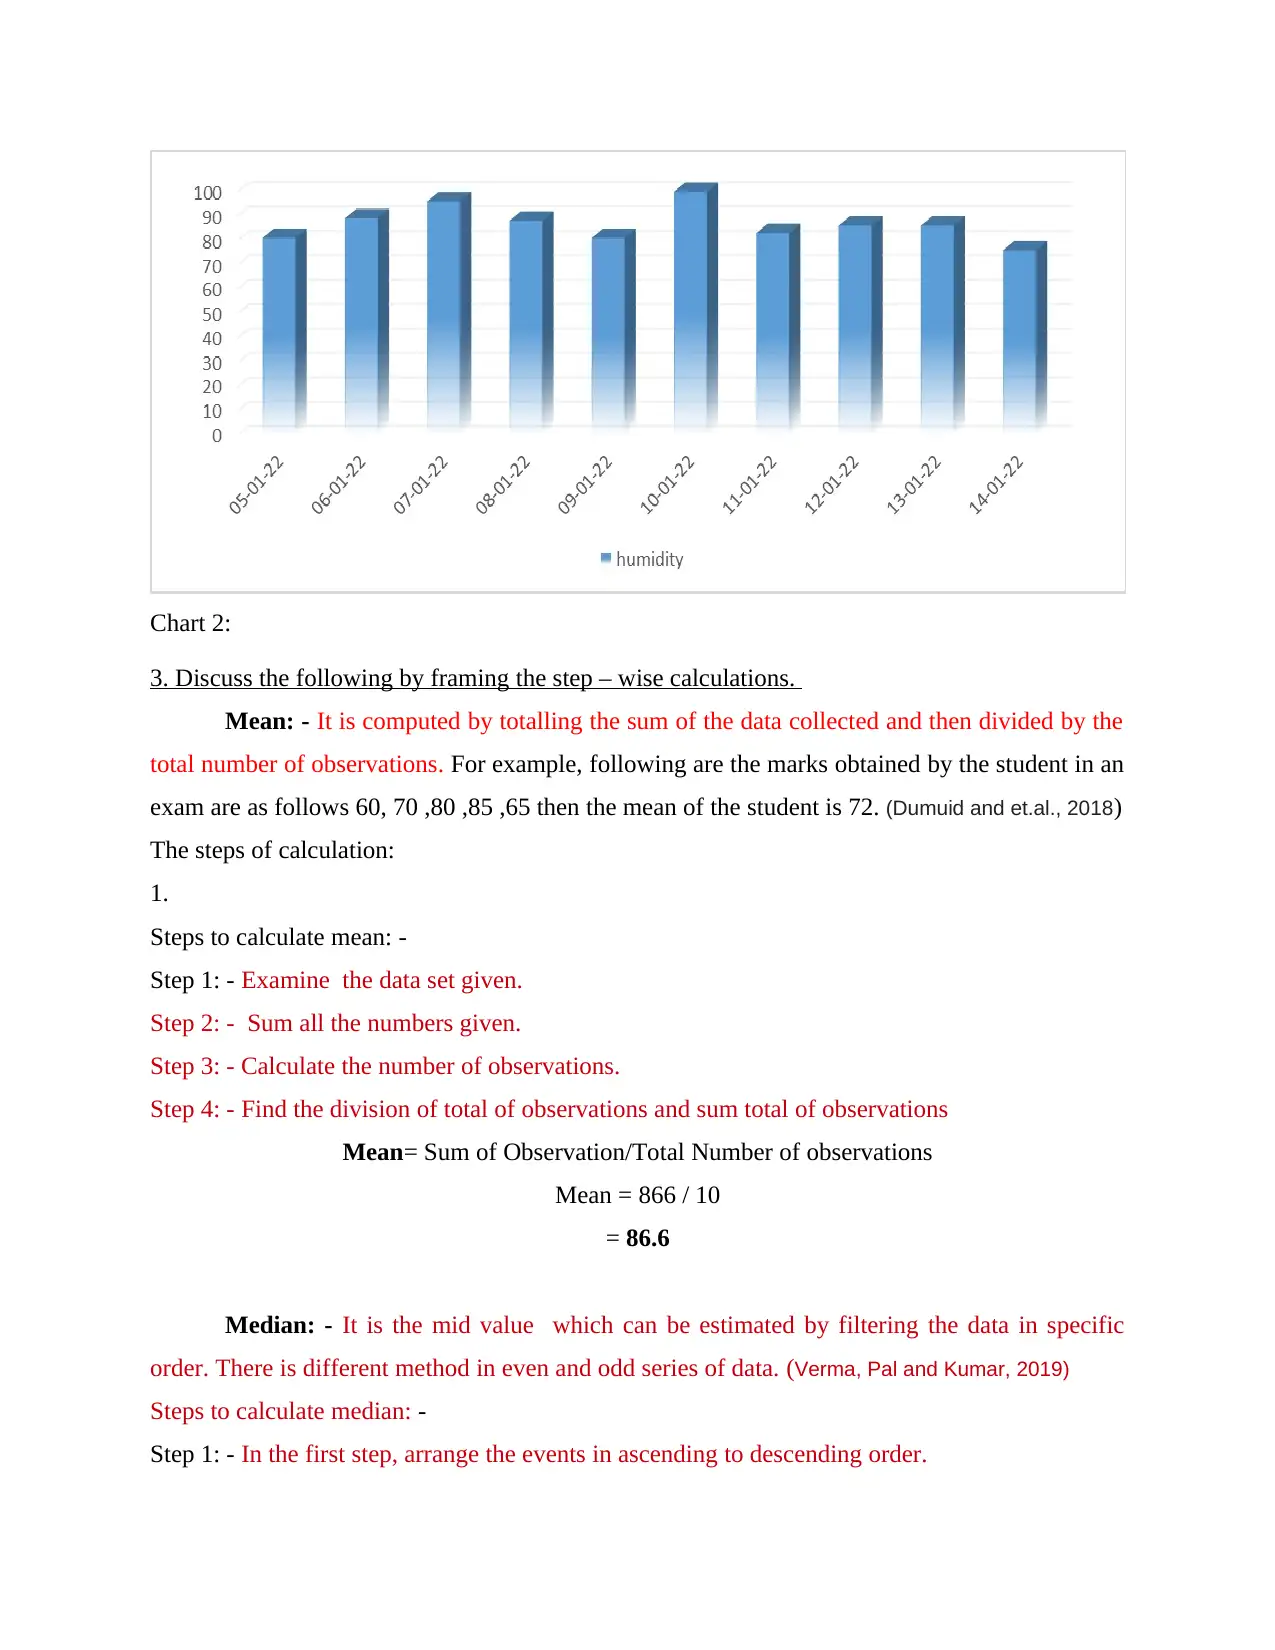
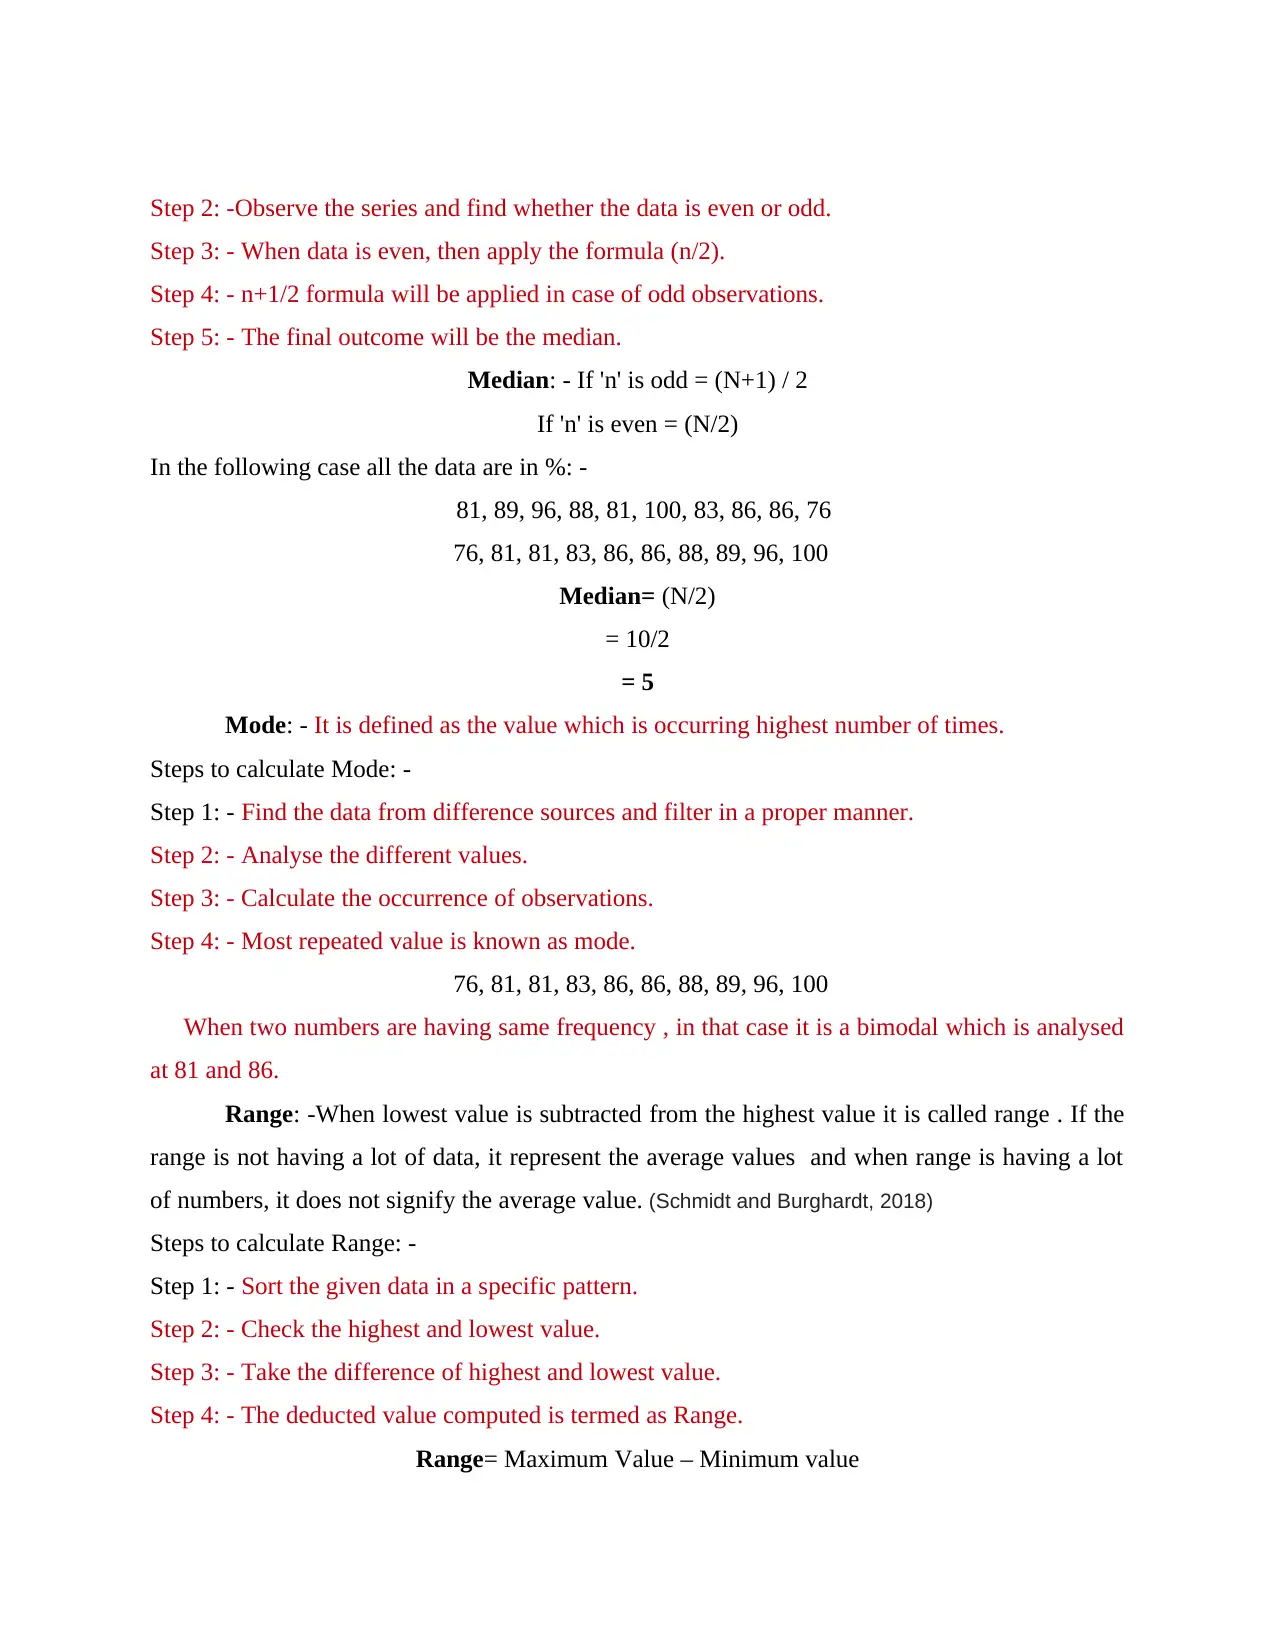
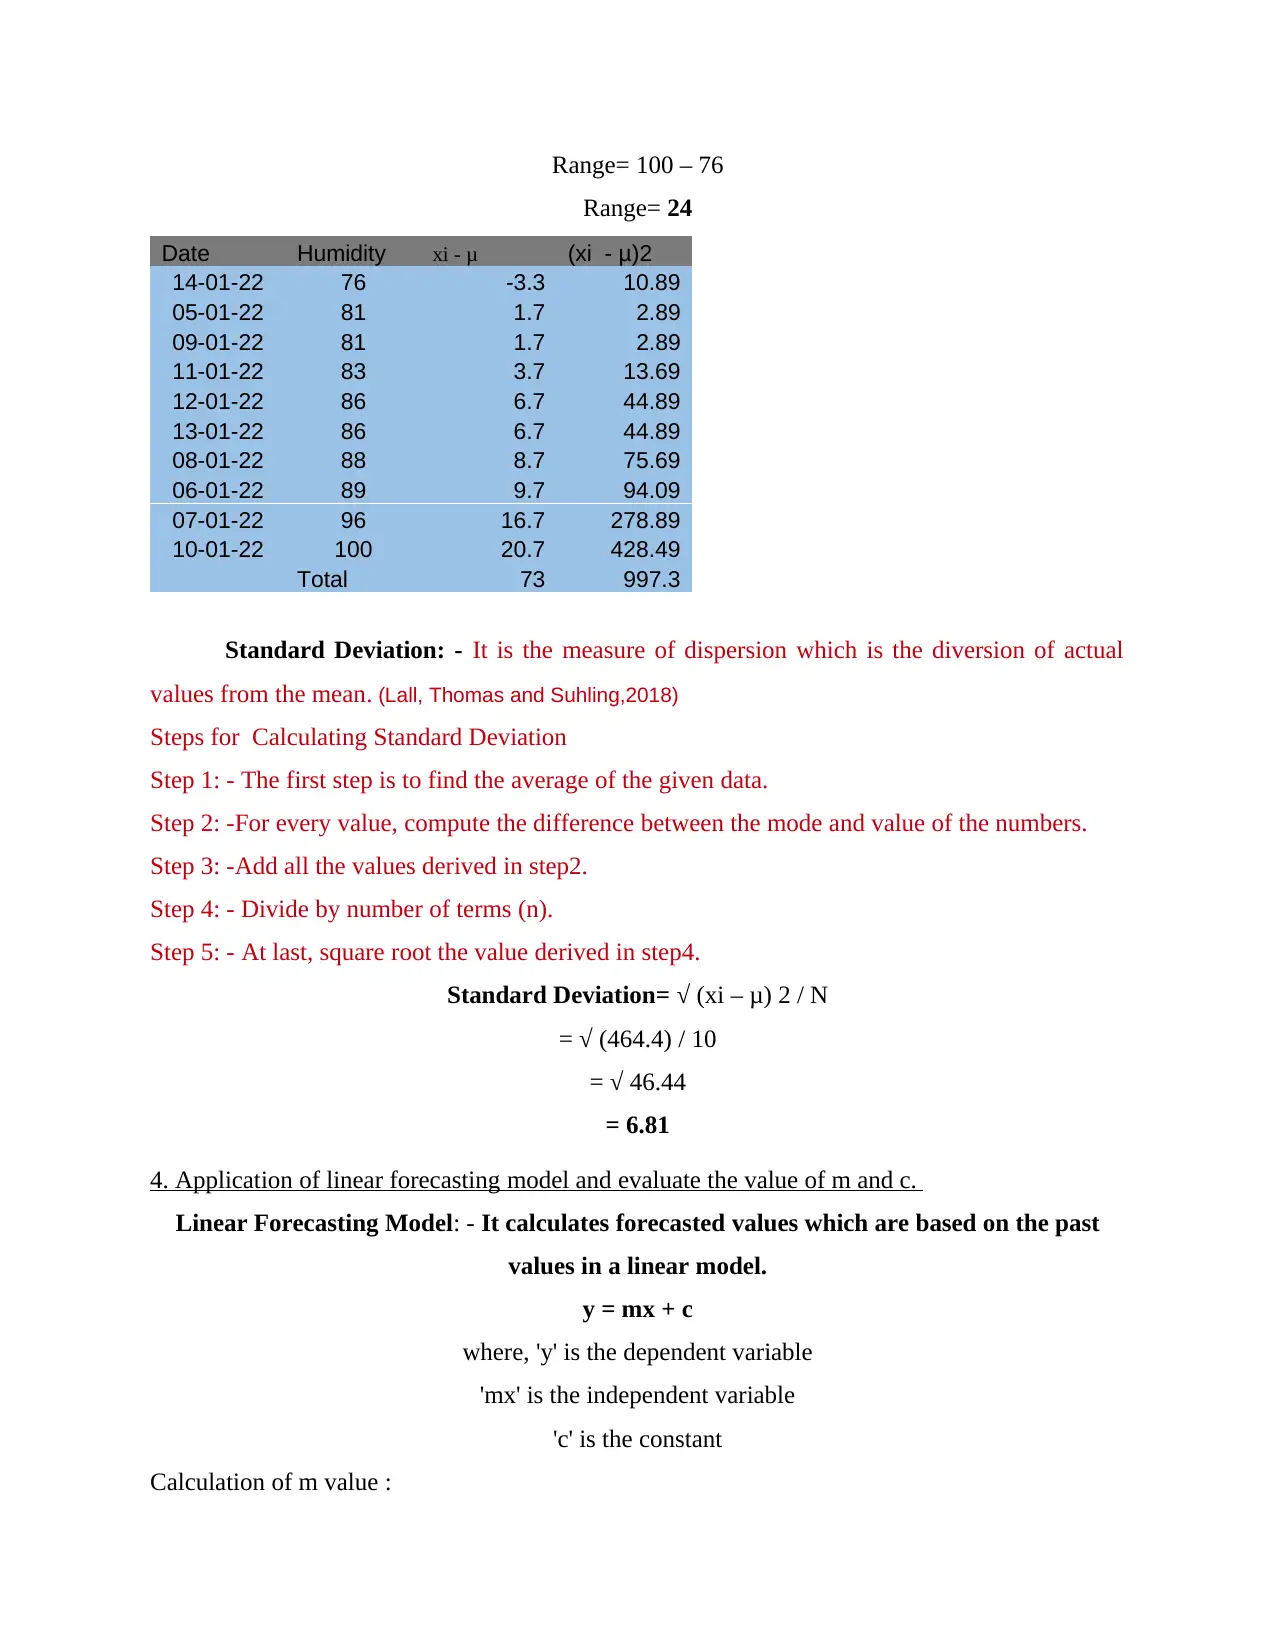
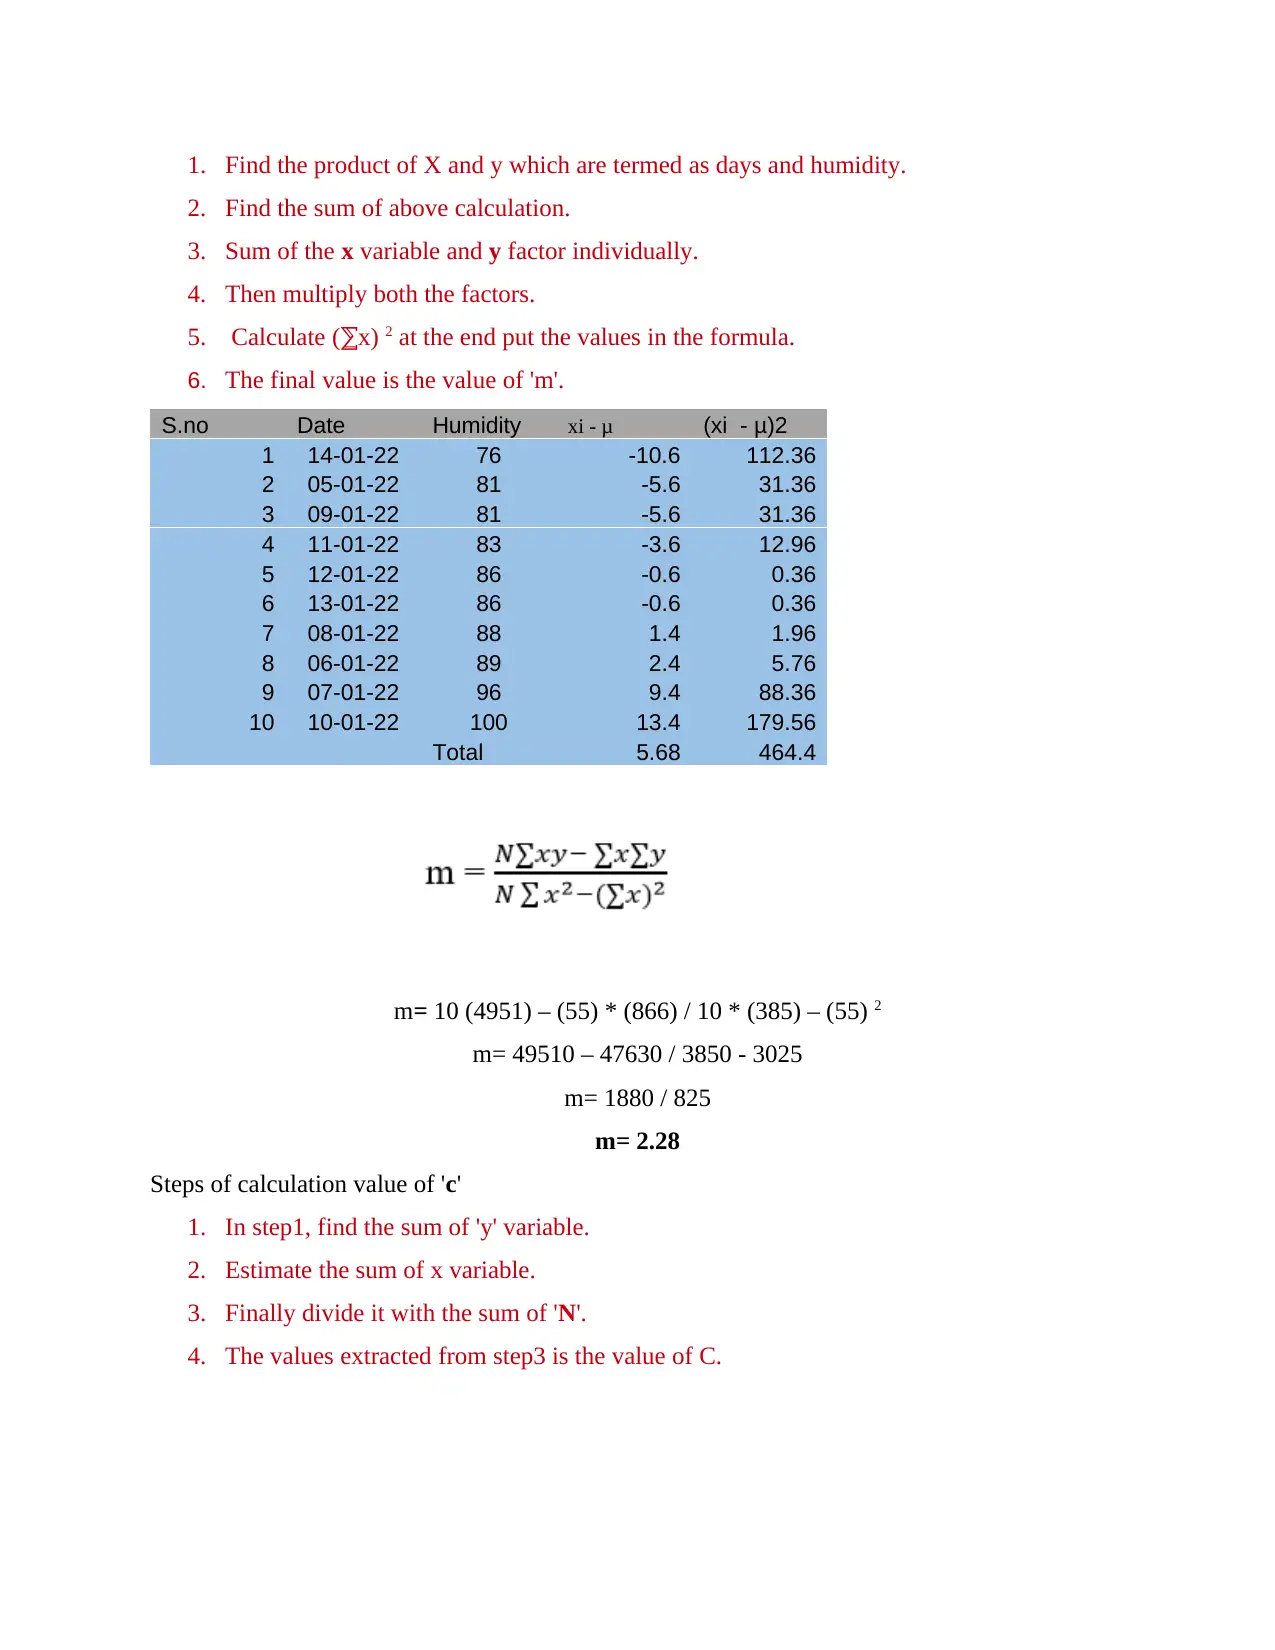
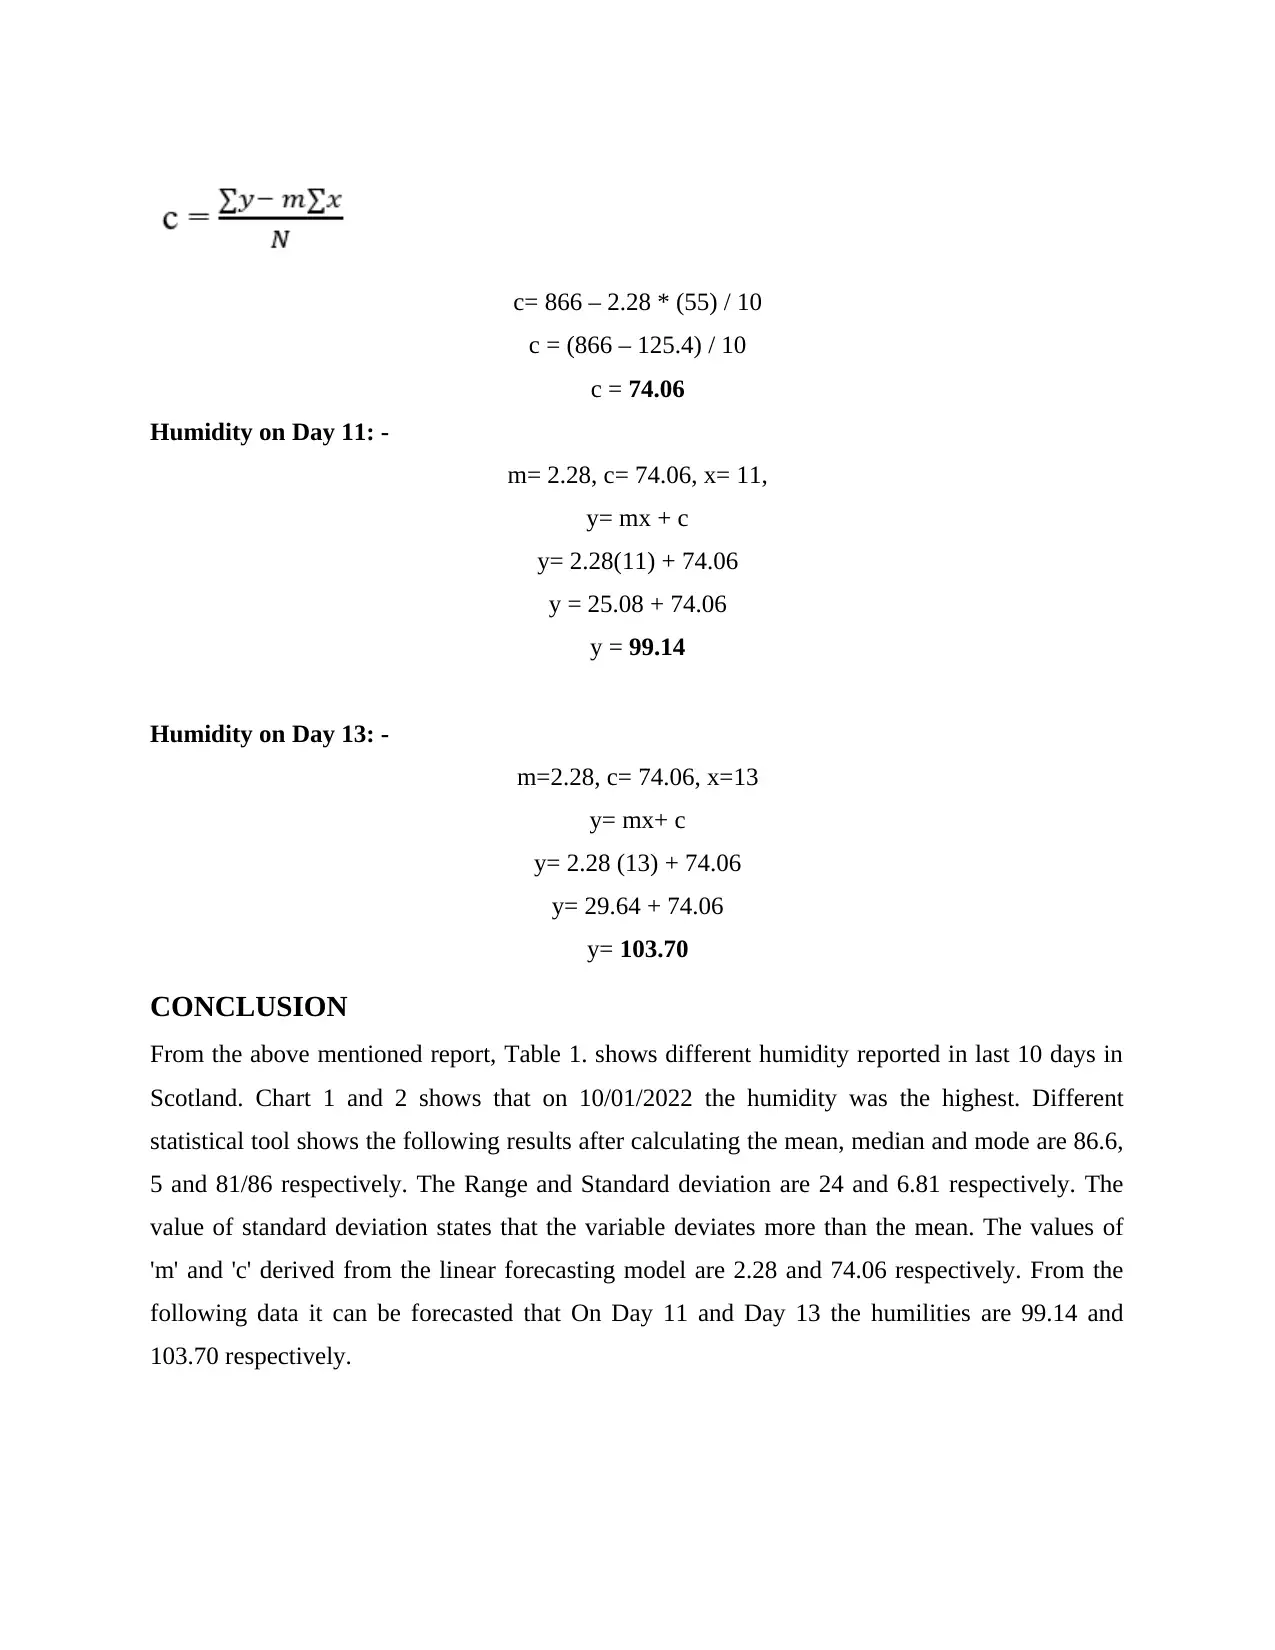
This report provides a detailed analysis of humidity data in Scotland over a 10-day period, employing various statistical tools and a linear forecasting model. The report includes the arrangement of data in table and chart formats, followed by the calculation and discussion of key statistical measures such as mean, median, mode, range, and standard deviation. Furthermore, it applies a linear forecasting model to estimate future humidity levels, calculating the values of 'm' and 'c' in the regression equation. The conclusion summarizes the findings, including the forecasted humidity for specific days, and references relevant academic sources.

Numeracy and Data
Analysis
Analysis
Paraphrase This Document
Need a fresh take? Get an instant paraphrase of this document with our AI Paraphraser

Table of Contents
INTRODUCTION...........................................................................................................................3
MAIN BODY...................................................................................................................................3
1. Arrangement of the table format.............................................................................................3
2. Present the data in chart format...............................................................................................3
3. Discuss the following by framing the step – wise calculations. ............................................4
4. Using the linear forecasting model frame the regression equation and calculate the value of
m and c........................................................................................................................................6
CONCLUSION ...............................................................................................................................8
REFERENCES................................................................................................................................9

INTRODUCTION
Numeracy means how to use and apply mathematics in our daily life. It helps in analysing charts,
read data, interpret and make decision accordingly. In the following, data is related to past 10
days of Scotland. It shows calculation of different statistical tools and Linear Forecasting Model.
MAIN BODY
1. Arrangement of the table format.
Date humidity
05-01-22 81
06-01-22 89
07-01-22 96
08-01-22 88
09-01-22 81
10-01-22 100
11-01-22 83
12-01-22 86
13-01-22 86
14-01-22 76
Table 1: Humidity data of Scotland of past 10 days
2. Present the data in chart format.
Chart 1: States different humidity level on different dates.
⊘ This is a preview!⊘
Do you want full access?
Subscribe today to unlock all pages.

Trusted by 1+ million students worldwide

Chart 2:
3. Discuss the following by framing the step – wise calculations.
Mean: - It is computed by totalling the sum of the data collected and then divided by the
total number of observations. For example, following are the marks obtained by the student in an
exam are as follows 60, 70 ,80 ,85 ,65 then the mean of the student is 72. (Dumuid and et.al., 2018)
The steps of calculation:
1.
Steps to calculate mean: -
Step 1: - Examine the data set given.
Step 2: - Sum all the numbers given.
Step 3: - Calculate the number of observations.
Step 4: - Find the division of total of observations and sum total of observations
Mean= Sum of Observation/Total Number of observations
Mean = 866 / 10
= 86.6
Median: - It is the mid value which can be estimated by filtering the data in specific
order. There is different method in even and odd series of data. (Verma, Pal and Kumar, 2019)
Steps to calculate median: -
Step 1: - In the first step, arrange the events in ascending to descending order.
Paraphrase This Document
Need a fresh take? Get an instant paraphrase of this document with our AI Paraphraser

Step 2: -Observe the series and find whether the data is even or odd.
Step 3: - When data is even, then apply the formula (n/2).
Step 4: - n+1/2 formula will be applied in case of odd observations.
Step 5: - The final outcome will be the median.
Median: - If 'n' is odd = (N+1) / 2
If 'n' is even = (N/2)
In the following case all the data are in %: -
81, 89, 96, 88, 81, 100, 83, 86, 86, 76
76, 81, 81, 83, 86, 86, 88, 89, 96, 100
Median= (N/2)
= 10/2
= 5
Mode: - It is defined as the value which is occurring highest number of times.
Steps to calculate Mode: -
Step 1: - Find the data from difference sources and filter in a proper manner.
Step 2: - Analyse the different values.
Step 3: - Calculate the occurrence of observations.
Step 4: - Most repeated value is known as mode.
76, 81, 81, 83, 86, 86, 88, 89, 96, 100
When two numbers are having same frequency , in that case it is a bimodal which is analysed
at 81 and 86.
Range: -When lowest value is subtracted from the highest value it is called range . If the
range is not having a lot of data, it represent the average values and when range is having a lot
of numbers, it does not signify the average value. (Schmidt and Burghardt, 2018)
Steps to calculate Range: -
Step 1: - Sort the given data in a specific pattern.
Step 2: - Check the highest and lowest value.
Step 3: - Take the difference of highest and lowest value.
Step 4: - The deducted value computed is termed as Range.
Range= Maximum Value – Minimum value

Range= 100 – 76
Range= 24
Date Humidity xi - μ (xi - μ)2
14-01-22 76 -3.3 10.89
05-01-22 81 1.7 2.89
09-01-22 81 1.7 2.89
11-01-22 83 3.7 13.69
12-01-22 86 6.7 44.89
13-01-22 86 6.7 44.89
08-01-22 88 8.7 75.69
06-01-22 89 9.7 94.09
07-01-22 96 16.7 278.89
10-01-22 100 20.7 428.49
Total 73 997.3
Standard Deviation: - It is the measure of dispersion which is the diversion of actual
values from the mean. (Lall, Thomas and Suhling,2018)
Steps for Calculating Standard Deviation
Step 1: - The first step is to find the average of the given data.
Step 2: -For every value, compute the difference between the mode and value of the numbers.
Step 3: -Add all the values derived in step2.
Step 4: - Divide by number of terms (n).
Step 5: - At last, square root the value derived in step4.
Standard Deviation= √ (xi – μ) 2 / N
= √ (464.4) / 10
= √ 46.44
= 6.81
4. Application of linear forecasting model and evaluate the value of m and c.
Linear Forecasting Model: - It calculates forecasted values which are based on the past
values in a linear model.
y = mx + c
where, 'y' is the dependent variable
'mx' is the independent variable
'c' is the constant
Calculation of m value :
⊘ This is a preview!⊘
Do you want full access?
Subscribe today to unlock all pages.

Trusted by 1+ million students worldwide

1. Find the product of X and y which are termed as days and humidity.
2. Find the sum of above calculation.
3. Sum of the x variable and y factor individually.
4. Then multiply both the factors.
5. Calculate ( x)⅀ 2 at the end put the values in the formula.
6. The final value is the value of 'm'.
S.no Date Humidity xi - μ (xi - μ)2
1 14-01-22 76 -10.6 112.36
2 05-01-22 81 -5.6 31.36
3 09-01-22 81 -5.6 31.36
4 11-01-22 83 -3.6 12.96
5 12-01-22 86 -0.6 0.36
6 13-01-22 86 -0.6 0.36
7 08-01-22 88 1.4 1.96
8 06-01-22 89 2.4 5.76
9 07-01-22 96 9.4 88.36
10 10-01-22 100 13.4 179.56
Total 5.68 464.4
m= 10 (4951) – (55) * (866) / 10 * (385) – (55) 2
m= 49510 – 47630 / 3850 - 3025
m= 1880 / 825
m= 2.28
Steps of calculation value of 'c'
1. In step1, find the sum of 'y' variable.
2. Estimate the sum of x variable.
3. Finally divide it with the sum of 'N'.
4. The values extracted from step3 is the value of C.
Paraphrase This Document
Need a fresh take? Get an instant paraphrase of this document with our AI Paraphraser

c= 866 – 2.28 * (55) / 10
c = (866 – 125.4) / 10
c = 74.06
Humidity on Day 11: -
m= 2.28, c= 74.06, x= 11,
y= mx + c
y= 2.28(11) + 74.06
y = 25.08 + 74.06
y = 99.14
Humidity on Day 13: -
m=2.28, c= 74.06, x=13
y= mx+ c
y= 2.28 (13) + 74.06
y= 29.64 + 74.06
y= 103.70
CONCLUSION
From the above mentioned report, Table 1. shows different humidity reported in last 10 days in
Scotland. Chart 1 and 2 shows that on 10/01/2022 the humidity was the highest. Different
statistical tool shows the following results after calculating the mean, median and mode are 86.6,
5 and 81/86 respectively. The Range and Standard deviation are 24 and 6.81 respectively. The
value of standard deviation states that the variable deviates more than the mean. The values of
'm' and 'c' derived from the linear forecasting model are 2.28 and 74.06 respectively. From the
following data it can be forecasted that On Day 11 and Day 13 the humilities are 99.14 and
103.70 respectively.

REFERENCES
Books and Journals
Dumuid, D. and et.al., 2018. Compositional data analysis for physical activity, sedentary time
and sleep research. Statistical methods in medical research. 27(12). pp.3726-3738.
Lall, P., Thomas, T. and Suhling, J., 2018, May. Feature Extraction and RUL Prediction of SAC
Solder Alloy Packages by Different Statistical and Time-frequency Analysis
Techniques under Simultaneous Temperature-Vibration Loads. In 2018 17th IEEE
Intersociety Conference on Thermal and Thermomechanical Phenomena in Electronic
Systems (ITherm) (pp. 1270-1279). IEEE.
Schmidt, T. and Burghardt, M., 2018, August. An evaluation of lexicon-based sentiment analysis
techniques for the plays of gotthold ephraim lessing. Association for Computational
Linguistics.
Verma, A. K., Pal, S. and Kumar, S., 2019. Classification of skin disease using ensemble data
mining techniques. Asian Pacific journal of cancer prevention: APJCP. 20(6). p.1887.
Yadav, S., Jain, A. and Singh, D., 2018, December. Early prediction of employee attrition using
data mining techniques. In 2018 IEEE 8th International Advance Computing
Conference (IACC) (pp. 349-354). IEEE
⊘ This is a preview!⊘
Do you want full access?
Subscribe today to unlock all pages.

Trusted by 1+ million students worldwide
1 out of 9
Related Documents

Your All-in-One AI-Powered Toolkit for Academic Success.
+13062052269
info@desklib.com
Available 24*7 on WhatsApp / Email
Unlock your academic potential
Copyright © 2020–2025 A2Z Services. All Rights Reserved. Developed and managed by ZUCOL.