Numeracy Data, IT: Applying Mathematical Skills to Real-World Data
VerifiedAdded on 2023/06/17
|22
|3826
|242
Homework Assignment
AI Summary
This assignment solution focuses on applying numeracy skills and IT fundamentals to solve mathematical problems and analyze data. It covers basic mathematical concepts such as fractions, percentages, and significant figures, demonstrating their application in real-world scenarios like calculating discounts and analyzing Olympic Games medal data. The solution also illustrates how to use Microsoft Excel to create comparison charts and highlight specific data regions. The assignment includes step-by-step explanations for performing various operations in Excel and interpreting statistical measures. It addresses questions related to data analysis, such as identifying countries with the lowest medal counts, determining the range of gold medals awarded, and comparing medal distributions among different countries. The document provides a comprehensive overview of how numeracy and IT skills can be integrated to effectively analyze and present data.
Using numeracy data
and IT FP
and IT FP
Paraphrase This Document
Need a fresh take? Get an instant paraphrase of this document with our AI Paraphraser
Contents
Contents...........................................................................................................................................2
INTRODUCTION...........................................................................................................................3
Part 1................................................................................................................................................3
Question 1....................................................................................................................................3
Question 2....................................................................................................................................4
Question 3....................................................................................................................................4
Question 4....................................................................................................................................4
Question 5....................................................................................................................................5
Question 6....................................................................................................................................5
Question 7....................................................................................................................................6
Question 8....................................................................................................................................6
Question 9....................................................................................................................................6
Question 10..................................................................................................................................7
Part 2................................................................................................................................................7
Part 3..............................................................................................................................................10
Question 13................................................................................................................................12
Question 14................................................................................................................................13
Question 15................................................................................................................................14
Question 16..................................................................................................................................1
Olympic Games Medal Table..........................................................................................................2
Olympic Games Medal Tables........................................................................................................3
Conclusion.......................................................................................................................................4
References........................................................................................................................................5
INTRODUCTION
IT proficiency is defined as the capacity to calculate and assess the relevant mathematical
and IT information, whereas mathematical knowledge is understood as the propensity to think
about and implement correct conceptual notions (Aoun and Alaaraj, 2019). Understanding
simple numerical like splits, multiplies, adding, and subtracting is crucial to gaining core
understanding of mathematics. In ordinary living, arithmetic is necessary for normal linguistic
and cognitive functioning. Consumption, obeying commands, judging invoices, and gaming are
all acts that require arithmetic. It also renders mathematics, patterning, schedule, and shape ideas
accessible. It was discovered that the principles of writing and mathematics can help people
develop the core abilities they need to succeed in life. There is a thorough strategy in place to
help kids improve their reading and numeracy skills while also assisting them in leading a happy
and satisfying life and serving to their society as an engaged and well-informed citizen. This
arithmetic program is divided into three primary activities, each of which should be completed in
a standard manner.
Part 1
Question 1
Mathematical proficiency is characterized as the capacity to understand and apply
elementary mathematical principles, as previously stated. Simple mathematics calculations such
as splitting, multiplying, adding, and deleting are required for basic logic skills. The numerator
and denominator concepts would be covered further down.
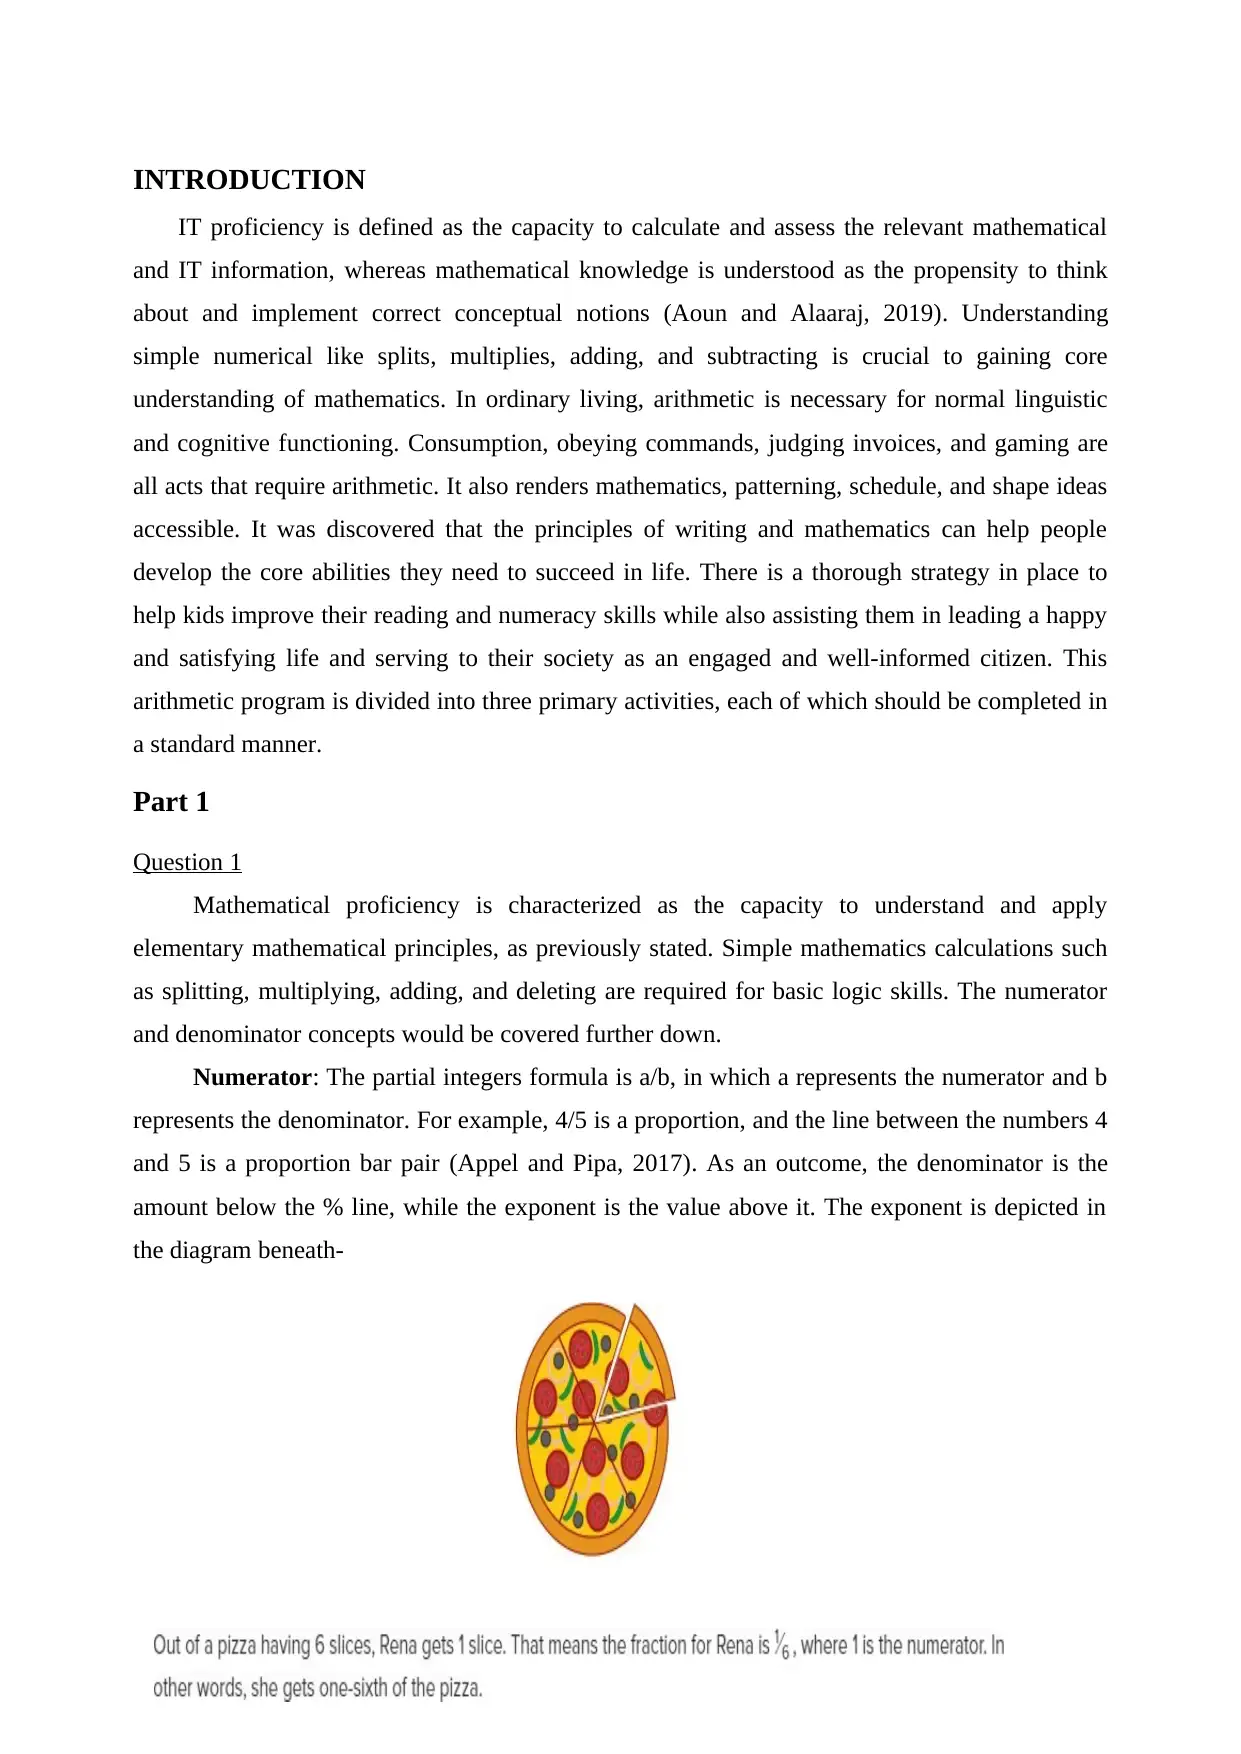
Numerator: The partial integers formula is a/b, in which a represents the numerator and b
represents the denominator. For example, 4/5 is a proportion, and the line between the numbers 4
and 5 is a proportion bar pair (Appel and Pipa, 2017). As an outcome, the denominator is the
amount below the % line, while the exponent is the value above it. The exponent is depicted in
the diagram beneath-
IT proficiency is defined as the capacity to calculate and assess the relevant mathematical
and IT information, whereas mathematical knowledge is understood as the propensity to think
about and implement correct conceptual notions (Aoun and Alaaraj, 2019). Understanding
simple numerical like splits, multiplies, adding, and subtracting is crucial to gaining core
understanding of mathematics. In ordinary living, arithmetic is necessary for normal linguistic
and cognitive functioning. Consumption, obeying commands, judging invoices, and gaming are
all acts that require arithmetic. It also renders mathematics, patterning, schedule, and shape ideas
accessible. It was discovered that the principles of writing and mathematics can help people
develop the core abilities they need to succeed in life. There is a thorough strategy in place to
help kids improve their reading and numeracy skills while also assisting them in leading a happy
and satisfying life and serving to their society as an engaged and well-informed citizen. This
arithmetic program is divided into three primary activities, each of which should be completed in
a standard manner.
Part 1
Question 1
Mathematical proficiency is characterized as the capacity to understand and apply
elementary mathematical principles, as previously stated. Simple mathematics calculations such
as splitting, multiplying, adding, and deleting are required for basic logic skills. The numerator
and denominator concepts would be covered further down.
Numerator: The partial integers formula is a/b, in which a represents the numerator and b
represents the denominator. For example, 4/5 is a proportion, and the line between the numbers 4
and 5 is a proportion bar pair (Appel and Pipa, 2017). As an outcome, the denominator is the
amount below the % line, while the exponent is the value above it. The exponent is depicted in
the diagram beneath-
⊘ This is a preview!⊘
Do you want full access?
Subscribe today to unlock all pages.
Trusted by 1+ million students worldwide
Denominator: The denominator is the lowest amount in a proportion which describes the
amount of similar elements divided into a thing (Atrill and Lindley, 2019).
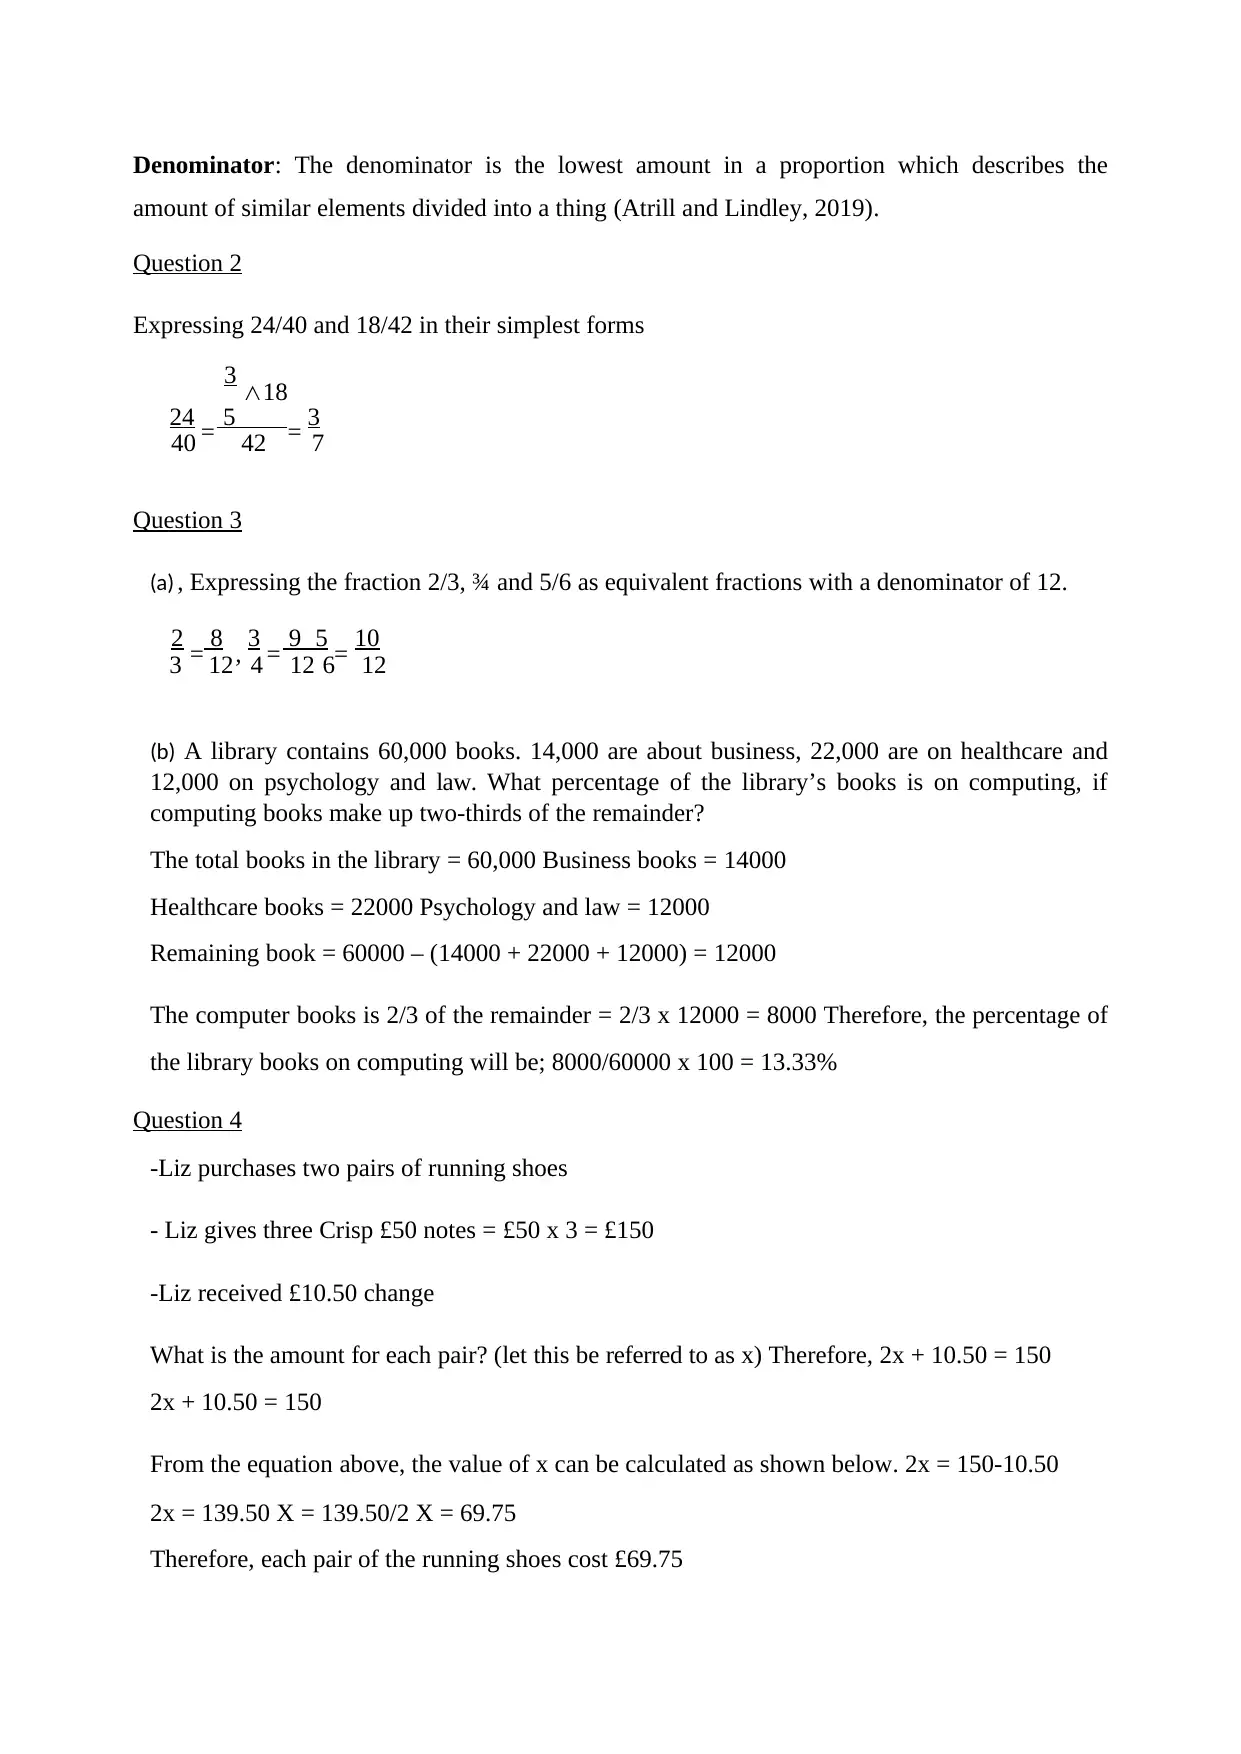
Question 2
Expressing 24/40 and 18/42 in their simplest forms
3 ∧18
24 = 5 = 3
40 42 7
Question 3
(a) , Expressing the fraction 2/3, ¾ and 5/6 as equivalent fractions with a denominator of 12.
2 = 8 , 3 = 9 5 = 10
3 12 4 12 6 12
(b) A library contains 60,000 books. 14,000 are about business, 22,000 are on healthcare and
12,000 on psychology and law. What percentage of the library’s books is on computing, if
computing books make up two-thirds of the remainder?
The total books in the library = 60,000 Business books = 14000
Healthcare books = 22000 Psychology and law = 12000
Remaining book = 60000 – (14000 + 22000 + 12000) = 12000
The computer books is 2/3 of the remainder = 2/3 x 12000 = 8000 Therefore, the percentage of
the library books on computing will be; 8000/60000 x 100 = 13.33%
Question 4
-Liz purchases two pairs of running shoes
- Liz gives three Crisp £50 notes = £50 x 3 = £150
-Liz received £10.50 change
What is the amount for each pair? (let this be referred to as x) Therefore, 2x + 10.50 = 150
2x + 10.50 = 150
From the equation above, the value of x can be calculated as shown below. 2x = 150-10.50
2x = 139.50 X = 139.50/2 X = 69.75
Therefore, each pair of the running shoes cost £69.75
amount of similar elements divided into a thing (Atrill and Lindley, 2019).
Question 2
Expressing 24/40 and 18/42 in their simplest forms
3 ∧18
24 = 5 = 3
40 42 7
Question 3
(a) , Expressing the fraction 2/3, ¾ and 5/6 as equivalent fractions with a denominator of 12.
2 = 8 , 3 = 9 5 = 10
3 12 4 12 6 12
(b) A library contains 60,000 books. 14,000 are about business, 22,000 are on healthcare and
12,000 on psychology and law. What percentage of the library’s books is on computing, if
computing books make up two-thirds of the remainder?
The total books in the library = 60,000 Business books = 14000
Healthcare books = 22000 Psychology and law = 12000
Remaining book = 60000 – (14000 + 22000 + 12000) = 12000
The computer books is 2/3 of the remainder = 2/3 x 12000 = 8000 Therefore, the percentage of
the library books on computing will be; 8000/60000 x 100 = 13.33%
Question 4
-Liz purchases two pairs of running shoes
- Liz gives three Crisp £50 notes = £50 x 3 = £150
-Liz received £10.50 change
What is the amount for each pair? (let this be referred to as x) Therefore, 2x + 10.50 = 150
2x + 10.50 = 150
From the equation above, the value of x can be calculated as shown below. 2x = 150-10.50
2x = 139.50 X = 139.50/2 X = 69.75
Therefore, each pair of the running shoes cost £69.75
Paraphrase This Document
Need a fresh take? Get an instant paraphrase of this document with our AI Paraphraser
Question 5
(a). 240.50 x 19.54 (2 significant)
From the above expression, there is a total of four decimal places from the two numbers 24050
x 1954 = 46993700
240.50 x 19.54 = 4699. 3700
= 4699.37 (2 decimal places)
(b) Rewriting 52100 to the power of 10
5.21 x 10⁴
Question 6
(a). A new gym offers 30% discount to individuals who sign up in the first month
-Patty and 2 siblings (which is 3 individuals in total)
-The 3 people paid a total amount of £210
-Let the total amount without the 30% discount be p
-Let the total discount be y Therefore
30/100 x P = y---------Eqn 1
P – y = 210...........Eqn 2
To solve for P, we substitute the value of y in equation 2
P – (30/100 x P) = 210 P – (30P/100) = 210
100P – 30P = 21000
70P = 21000 P = 21000/70 P = 300
We can now substitute the value of P in equation 2 to find y 300 – y = 210
y = 300- 210 = 90
Therefore, the total savings made was £90
(b) The total savings made was £90 There are 3 individuals involved
Therefore, the average savings per person can be calculated as
£90/3 = £30
Question 7
(a). ¾ - 7/9 + 2/3
(27-28+24)/36 = 23/36
(b) Which is the largest of the following numbers? 0.1, 0.02, 0.003, 0.0004, 0.00005
Since the considerable integer one is at the tenth spot, which would be the greatest stance after
the decimal point, the greatest number is 0.1.
Question 8
-90 men and 60 women were asked whether they had watched the latest ‘Expendables’ movie.
- The fraction of people that said yes = 3/5
-Fraction of women that said yes = 3/10
-Fraction of men that said yes = 3/5 – 3/10 = 3/10
-Fraction of men that said no = 1 – 3/10 = 7/10
-Number of men that said no = 7/10 x 90 = 63
-Percentage of men that said no = 63/90 x 100 = 70%
Question 9
-Annabelle lives at Bermondsey in London.
-She is required to speak in Birmingham at 10:30 am
-It will take her an hour (1 hr) to get to from her house to Euston Station, where she gets the
train to Birmingham
-The train journey from Euston Station to Birmingham is an hour and 10 minutes (7/6 hrs)
- The meeting venue In Birmingham is a 5-minute (1/6hr) walk from the station.
Therefore, total time it will take Annabelle to journey from her house to the meeting venue is =
1 hrs + 7/6 hrs + 1/12 hr = 27/12 hrs = 2 hours 15 minutes
In order to calculate the time, the total time needed to get the meeting venue from the
scheduled time
=(10hrs 30minutes) – (2hrs 15 minutes) = 8hr 15minutes
Even though the train that runs from Euston to Birmingham comes at 5 minutes past the hour,
25 minutes past the hour and 45 minutes past the hour.
⊘ This is a preview!⊘
Do you want full access?
Subscribe today to unlock all pages.
Trusted by 1+ million students worldwide
Therefore, the latest time that Annabelle can leave the house is at 8 : 15am
Question 10
The weight of Shredded Wheat = 0.35 = 35/100 The weight of Weetabix box = 9/25
Now we need to convert them into numbers (35,36)/100
From the above, the value of the Shredded Wheat is 35, while that of the Weetabix is 36
Therefore, the Weetabix is heavier
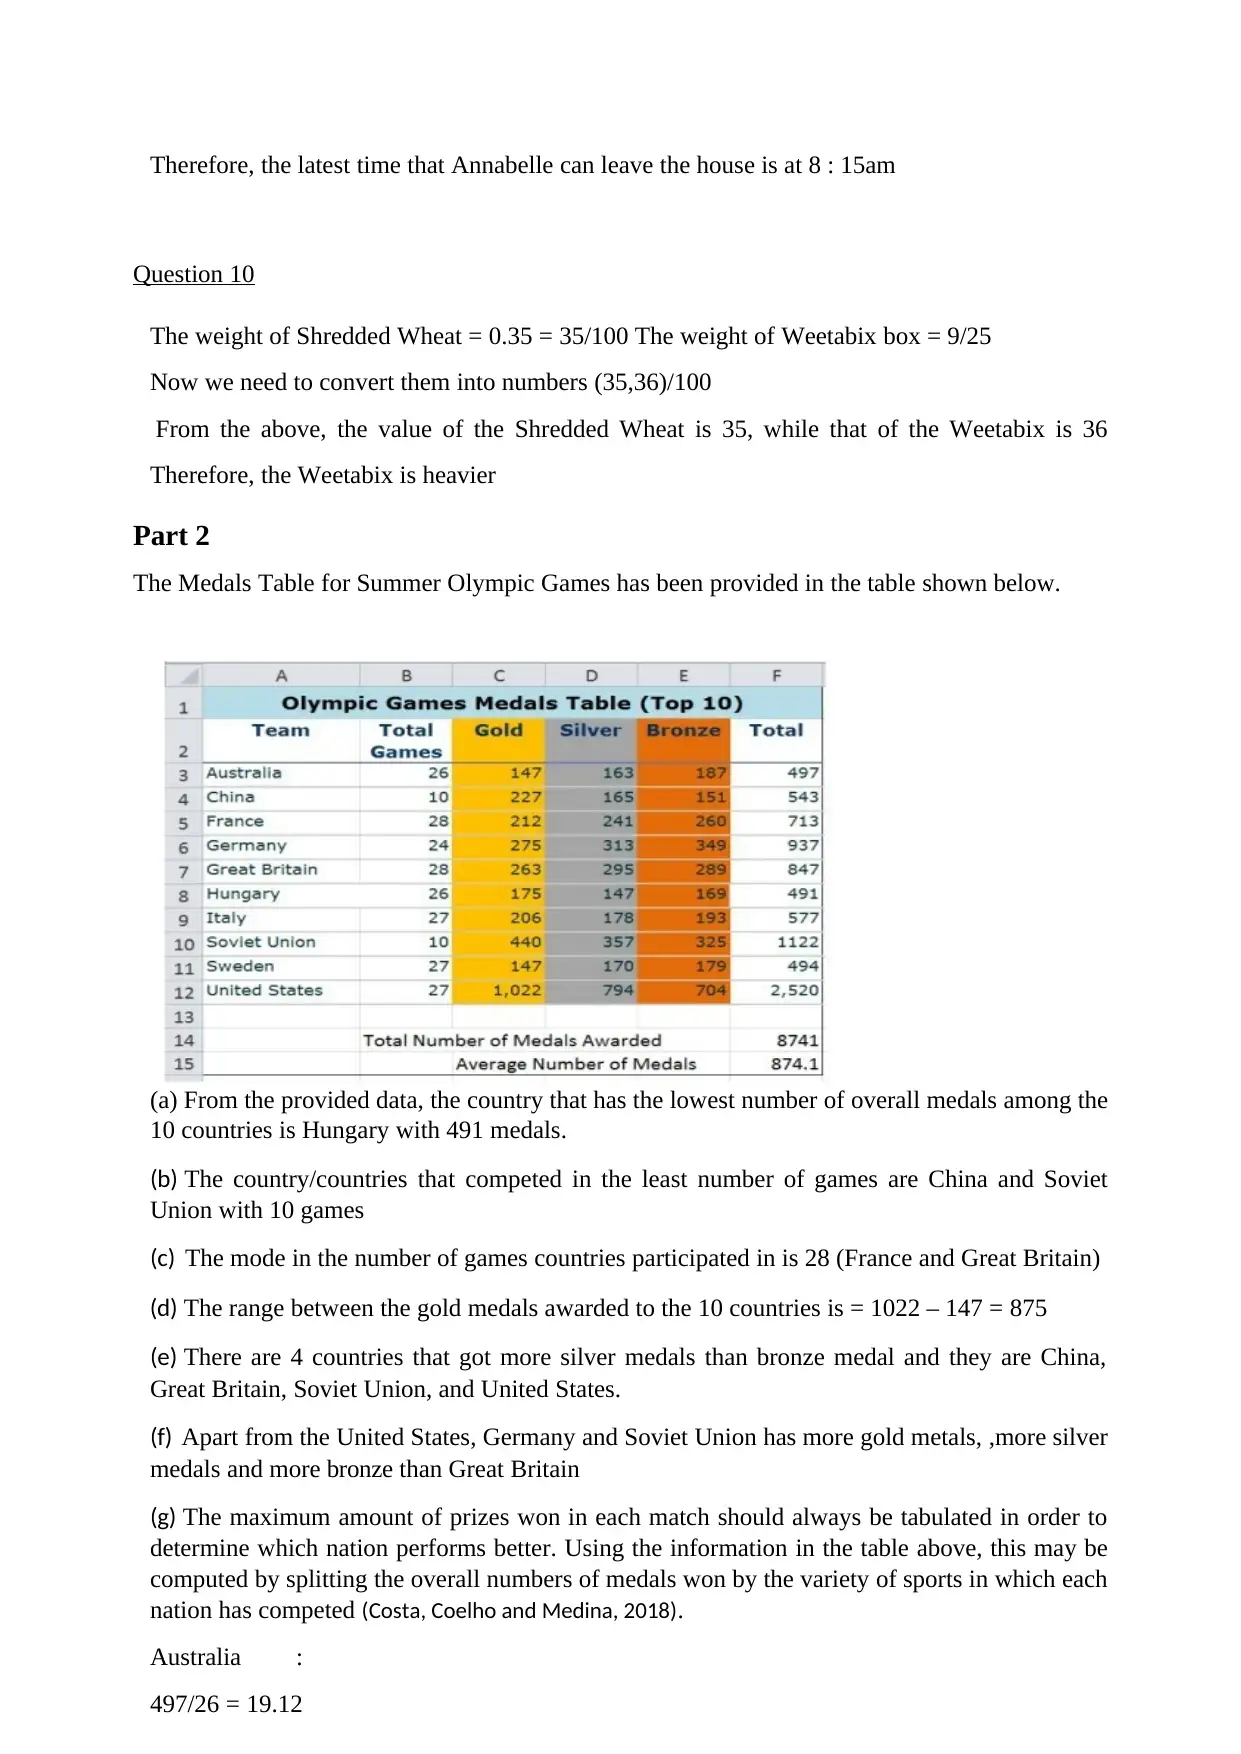
Part 2
The Medals Table for Summer Olympic Games has been provided in the table shown below.
(a) From the provided data, the country that has the lowest number of overall medals among the
10 countries is Hungary with 491 medals.
(b) The country/countries that competed in the least number of games are China and Soviet
Union with 10 games
(c) The mode in the number of games countries participated in is 28 (France and Great Britain)
(d) The range between the gold medals awarded to the 10 countries is = 1022 – 147 = 875
(e) There are 4 countries that got more silver medals than bronze medal and they are China,
Great Britain, Soviet Union, and United States.
(f) Apart from the United States, Germany and Soviet Union has more gold metals, ,more silver
medals and more bronze than Great Britain
(g) The maximum amount of prizes won in each match should always be tabulated in order to
determine which nation performs better. Using the information in the table above, this may be
computed by splitting the overall numbers of medals won by the variety of sports in which each
nation has competed (Costa, Coelho and Medina, 2018).
Australia :
497/26 = 19.12
Question 10
The weight of Shredded Wheat = 0.35 = 35/100 The weight of Weetabix box = 9/25
Now we need to convert them into numbers (35,36)/100
From the above, the value of the Shredded Wheat is 35, while that of the Weetabix is 36
Therefore, the Weetabix is heavier
Part 2
The Medals Table for Summer Olympic Games has been provided in the table shown below.
(a) From the provided data, the country that has the lowest number of overall medals among the
10 countries is Hungary with 491 medals.
(b) The country/countries that competed in the least number of games are China and Soviet
Union with 10 games
(c) The mode in the number of games countries participated in is 28 (France and Great Britain)
(d) The range between the gold medals awarded to the 10 countries is = 1022 – 147 = 875
(e) There are 4 countries that got more silver medals than bronze medal and they are China,
Great Britain, Soviet Union, and United States.
(f) Apart from the United States, Germany and Soviet Union has more gold metals, ,more silver
medals and more bronze than Great Britain
(g) The maximum amount of prizes won in each match should always be tabulated in order to
determine which nation performs better. Using the information in the table above, this may be
computed by splitting the overall numbers of medals won by the variety of sports in which each
nation has competed (Costa, Coelho and Medina, 2018).
Australia :
497/26 = 19.12
Paraphrase This Document
Need a fresh take? Get an instant paraphrase of this document with our AI Paraphraser
China : 543/10
= 54.3
France : 713/28 = 25.46
Germany: 937/24
=39.04 Great
Britain : 847/28
=30.25 Hungary :
491/26 = 18.88
Italy : 577/27 =
21.37
Soviet Union:
1122/10 = 112.2
Sweden : 494/27=
18.30 United States:
2520/27 = 93.33
Depending on the statistics provided, it is clear that the Soviet Union is the country that
executes the best, as seen by the fact that they receive the most honours each encounter (112.2
medals per match).
(h) There could be a multitude of factors why a nation like Jamaica that is famed for its
athletes, does not rank in the top 10. The fact that they have a low demographic density in
comparison to other nations may be the main explanation for their lack of participation in
numerous events. The larger a nation's population, the more likely it is to participate in more
events and, as a result, to rank from among top 10 winning nations. Furthermore, when
compared to other sports, such as group sports, where individuals are seldom involved, the
physical duties done in Olympic games are little (Dai and Jiang, 2016).
(i) According to the chart, the Soviet Union is the United States' nearest rival, thus every award
class in the United States will be contrasted to the Soviet Union's.
Gold medal US = 1022
Soviet Union = 440
The difference = 1022 – 440 = 582
Silver medal US = 794
Soviet Union = 357
The difference = 794 – 357 = 437
Bronze medal
US = 704
Soviet Union = 325
The difference = 704 – 325 = 379
From the above calculation, the medal category in which the United States far outperformed
its closest competitor Soviet Union is the Gold medal category
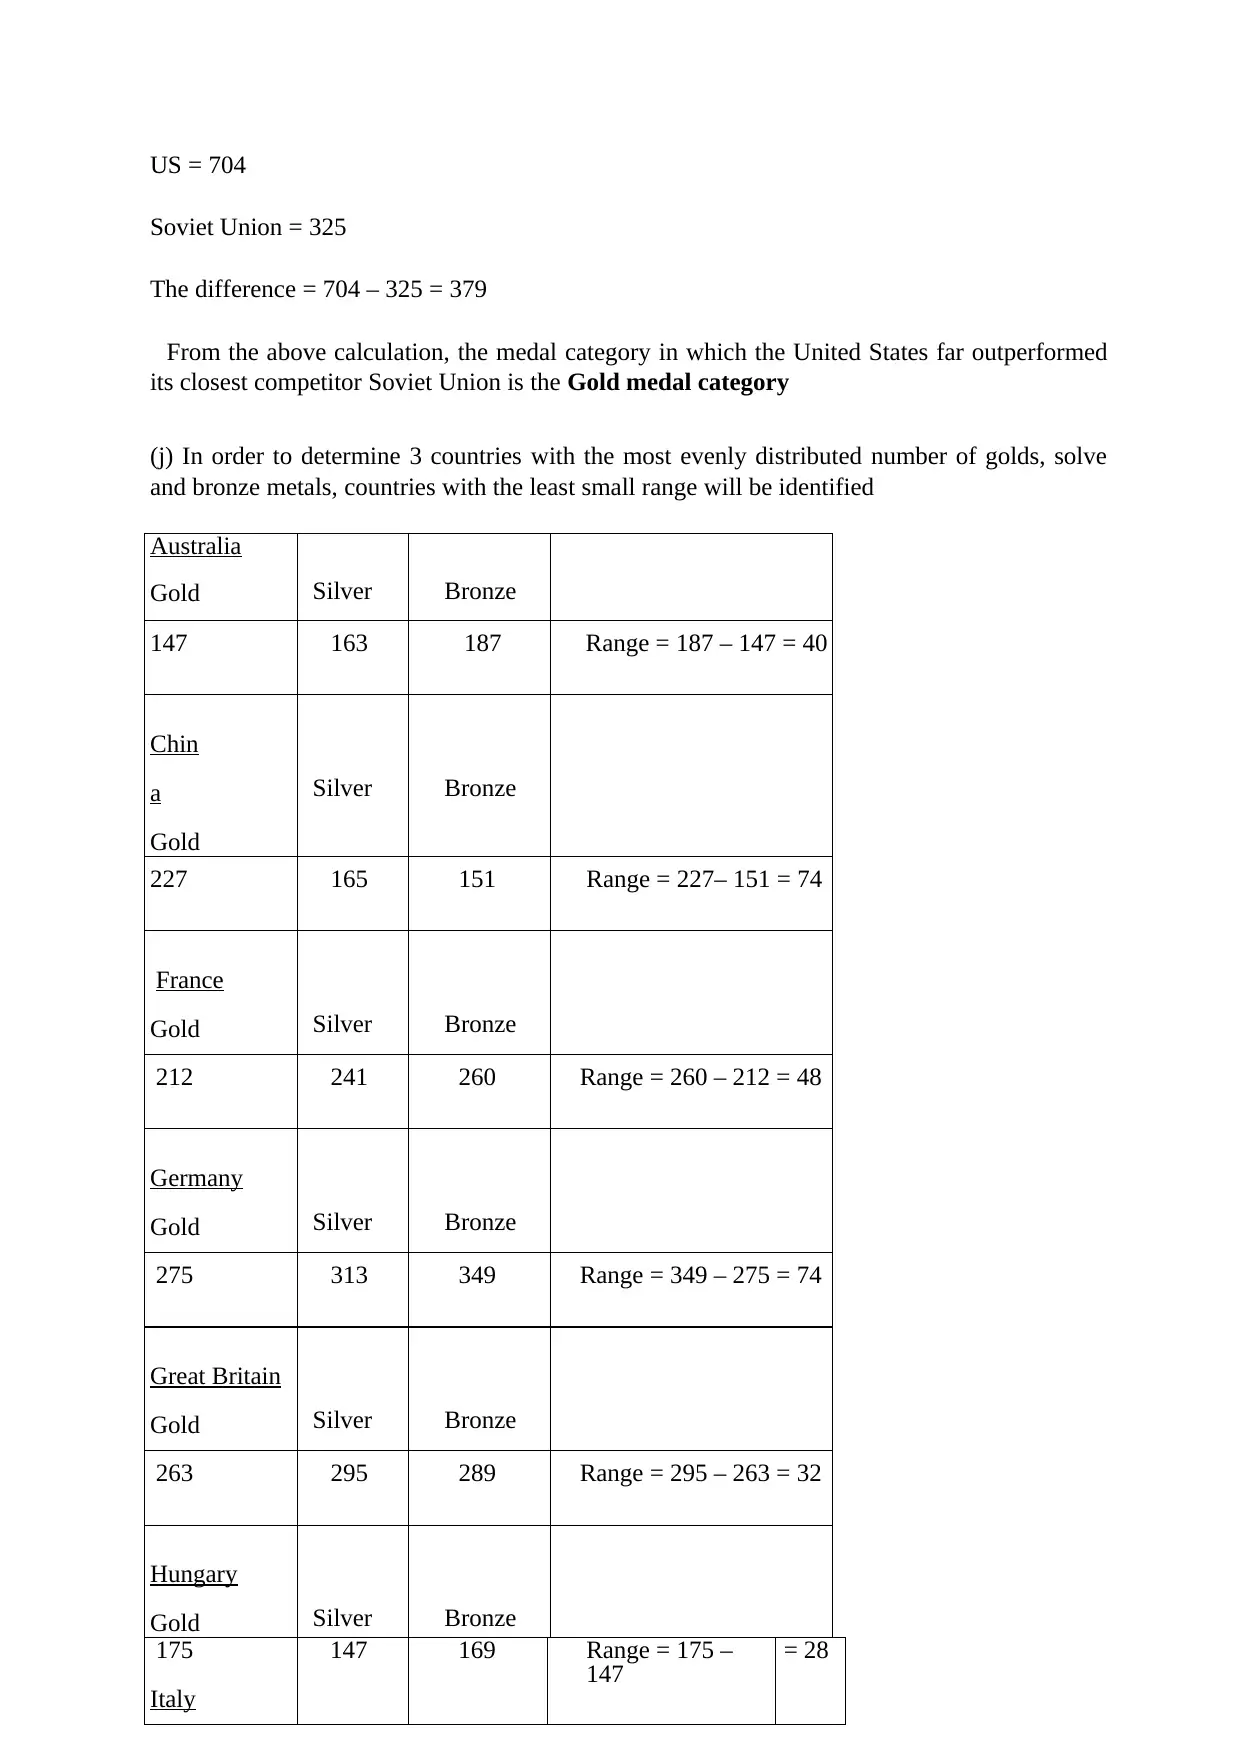
(j) In order to determine 3 countries with the most evenly distributed number of golds, solve
and bronze metals, countries with the least small range will be identified
Australia
Gold Silver Bronze
147 163 187 Range = 187 – 147 = 40
Chin
a
Gold
Silver Bronze
227 165 151 Range = 227– 151 = 74
France
Gold Silver Bronze
212 241 260 Range = 260 – 212 = 48
Germany
Gold Silver Bronze
275 313 349 Range = 349 – 275 = 74
Great Britain
Gold Silver Bronze
263 295 289 Range = 295 – 263 = 32
Hungary
Gold Silver Bronze
175
Italy
147 169 Range = 175 –
147 = 28
Soviet Union = 325
The difference = 704 – 325 = 379
From the above calculation, the medal category in which the United States far outperformed
its closest competitor Soviet Union is the Gold medal category
(j) In order to determine 3 countries with the most evenly distributed number of golds, solve
and bronze metals, countries with the least small range will be identified
Australia
Gold Silver Bronze
147 163 187 Range = 187 – 147 = 40
Chin
a
Gold
Silver Bronze
227 165 151 Range = 227– 151 = 74
France
Gold Silver Bronze
212 241 260 Range = 260 – 212 = 48
Germany
Gold Silver Bronze
275 313 349 Range = 349 – 275 = 74
Great Britain
Gold Silver Bronze
263 295 289 Range = 295 – 263 = 32
Hungary
Gold Silver Bronze
175
Italy
147 169 Range = 175 –
147 = 28
⊘ This is a preview!⊘
Do you want full access?
Subscribe today to unlock all pages.
Trusted by 1+ million students worldwide
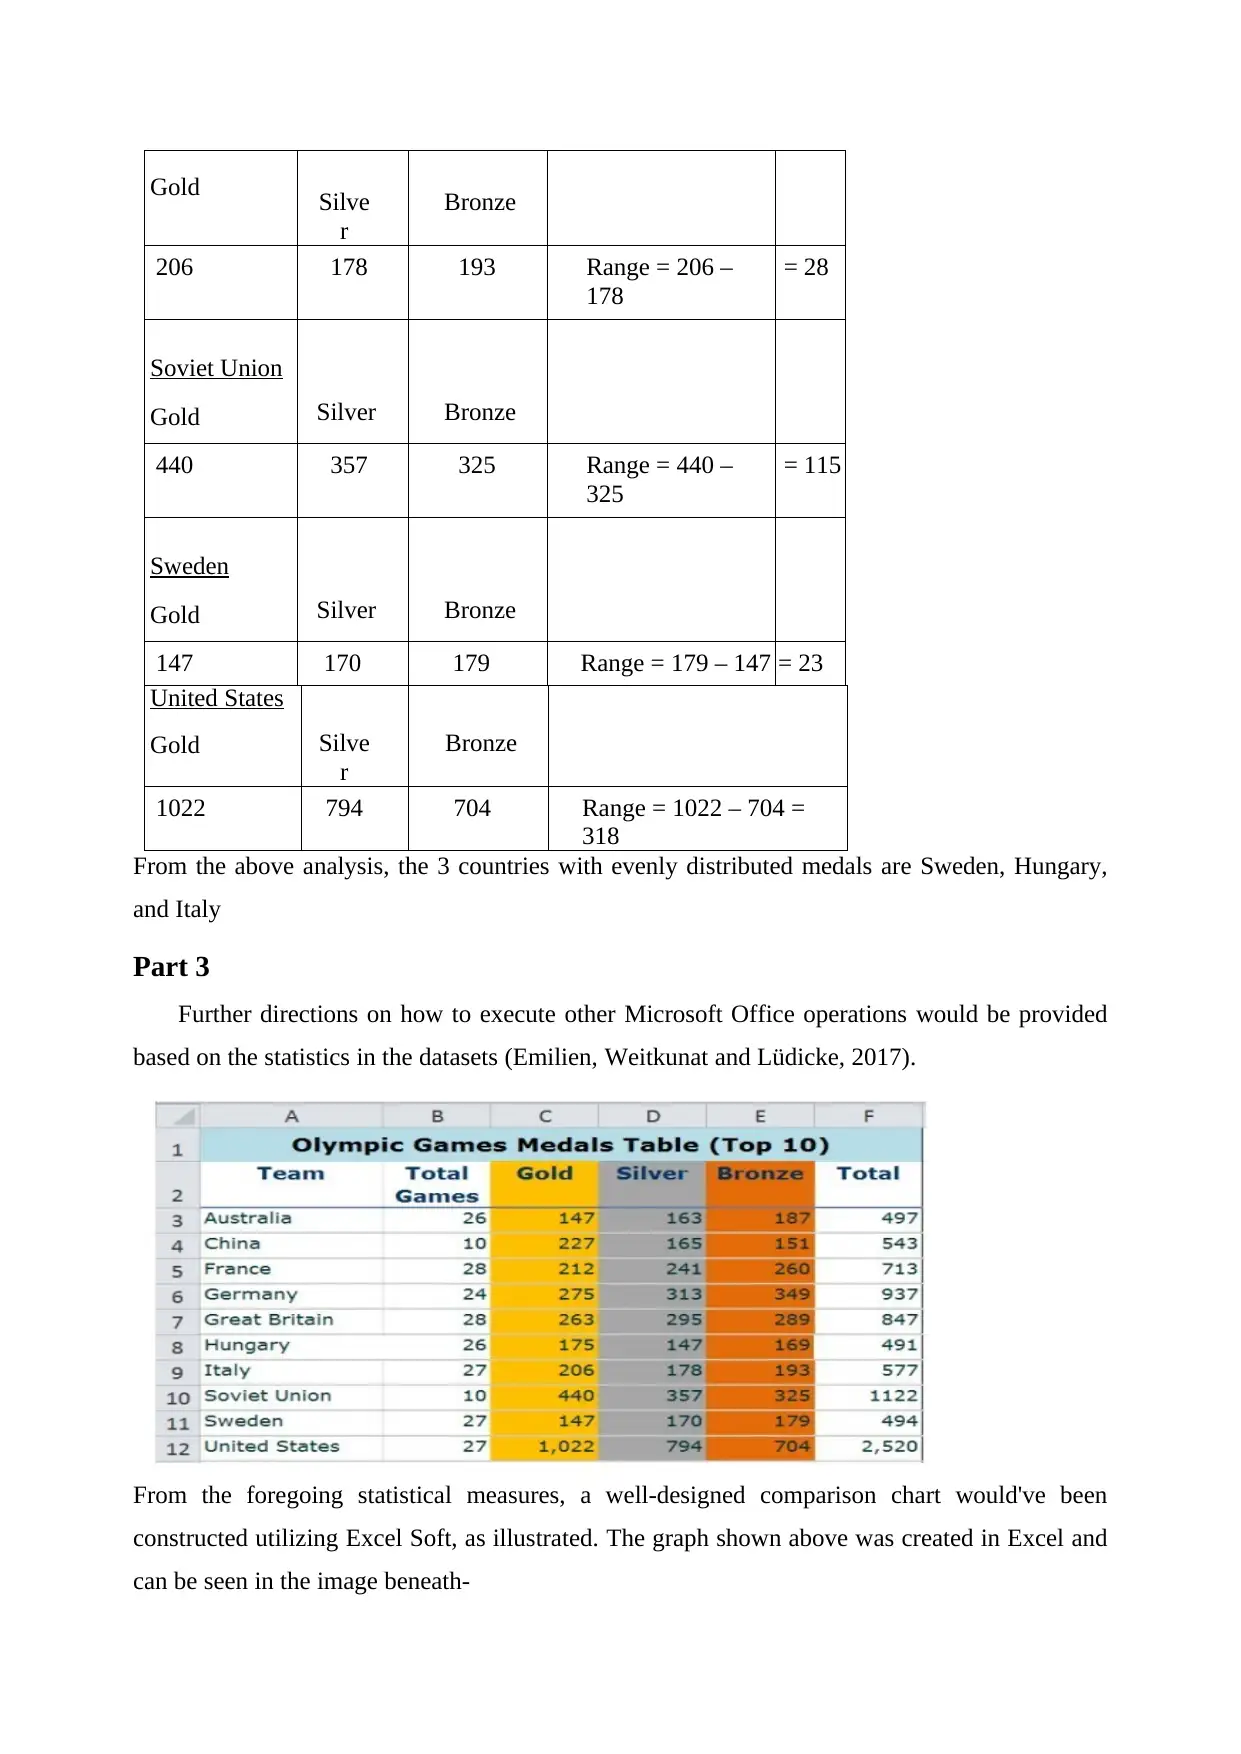
Gold Silve
r
Bronze
206 178 193 Range = 206 –
178
= 28
Soviet Union
Gold Silver Bronze
440 357 325 Range = 440 –
325
= 115
Sweden
Gold Silver Bronze
147 170 179 Range = 179 – 147 = 23
United States
Gold Silve
r
Bronze
1022 794 704 Range = 1022 – 704 =
318
From the above analysis, the 3 countries with evenly distributed medals are Sweden, Hungary,
and Italy
Part 3
Further directions on how to execute other Microsoft Office operations would be provided
based on the statistics in the datasets (Emilien, Weitkunat and Lüdicke, 2017).
From the foregoing statistical measures, a well-designed comparison chart would've been
constructed utilizing Excel Soft, as illustrated. The graph shown above was created in Excel and
can be seen in the image beneath-
r
Bronze
206 178 193 Range = 206 –
178
= 28
Soviet Union
Gold Silver Bronze
440 357 325 Range = 440 –
325
= 115
Sweden
Gold Silver Bronze
147 170 179 Range = 179 – 147 = 23
United States
Gold Silve
r
Bronze
1022 794 704 Range = 1022 – 704 =
318
From the above analysis, the 3 countries with evenly distributed medals are Sweden, Hungary,
and Italy
Part 3
Further directions on how to execute other Microsoft Office operations would be provided
based on the statistics in the datasets (Emilien, Weitkunat and Lüdicke, 2017).
From the foregoing statistical measures, a well-designed comparison chart would've been
constructed utilizing Excel Soft, as illustrated. The graph shown above was created in Excel and
can be seen in the image beneath-
Paraphrase This Document
Need a fresh take? Get an instant paraphrase of this document with our AI Paraphraser
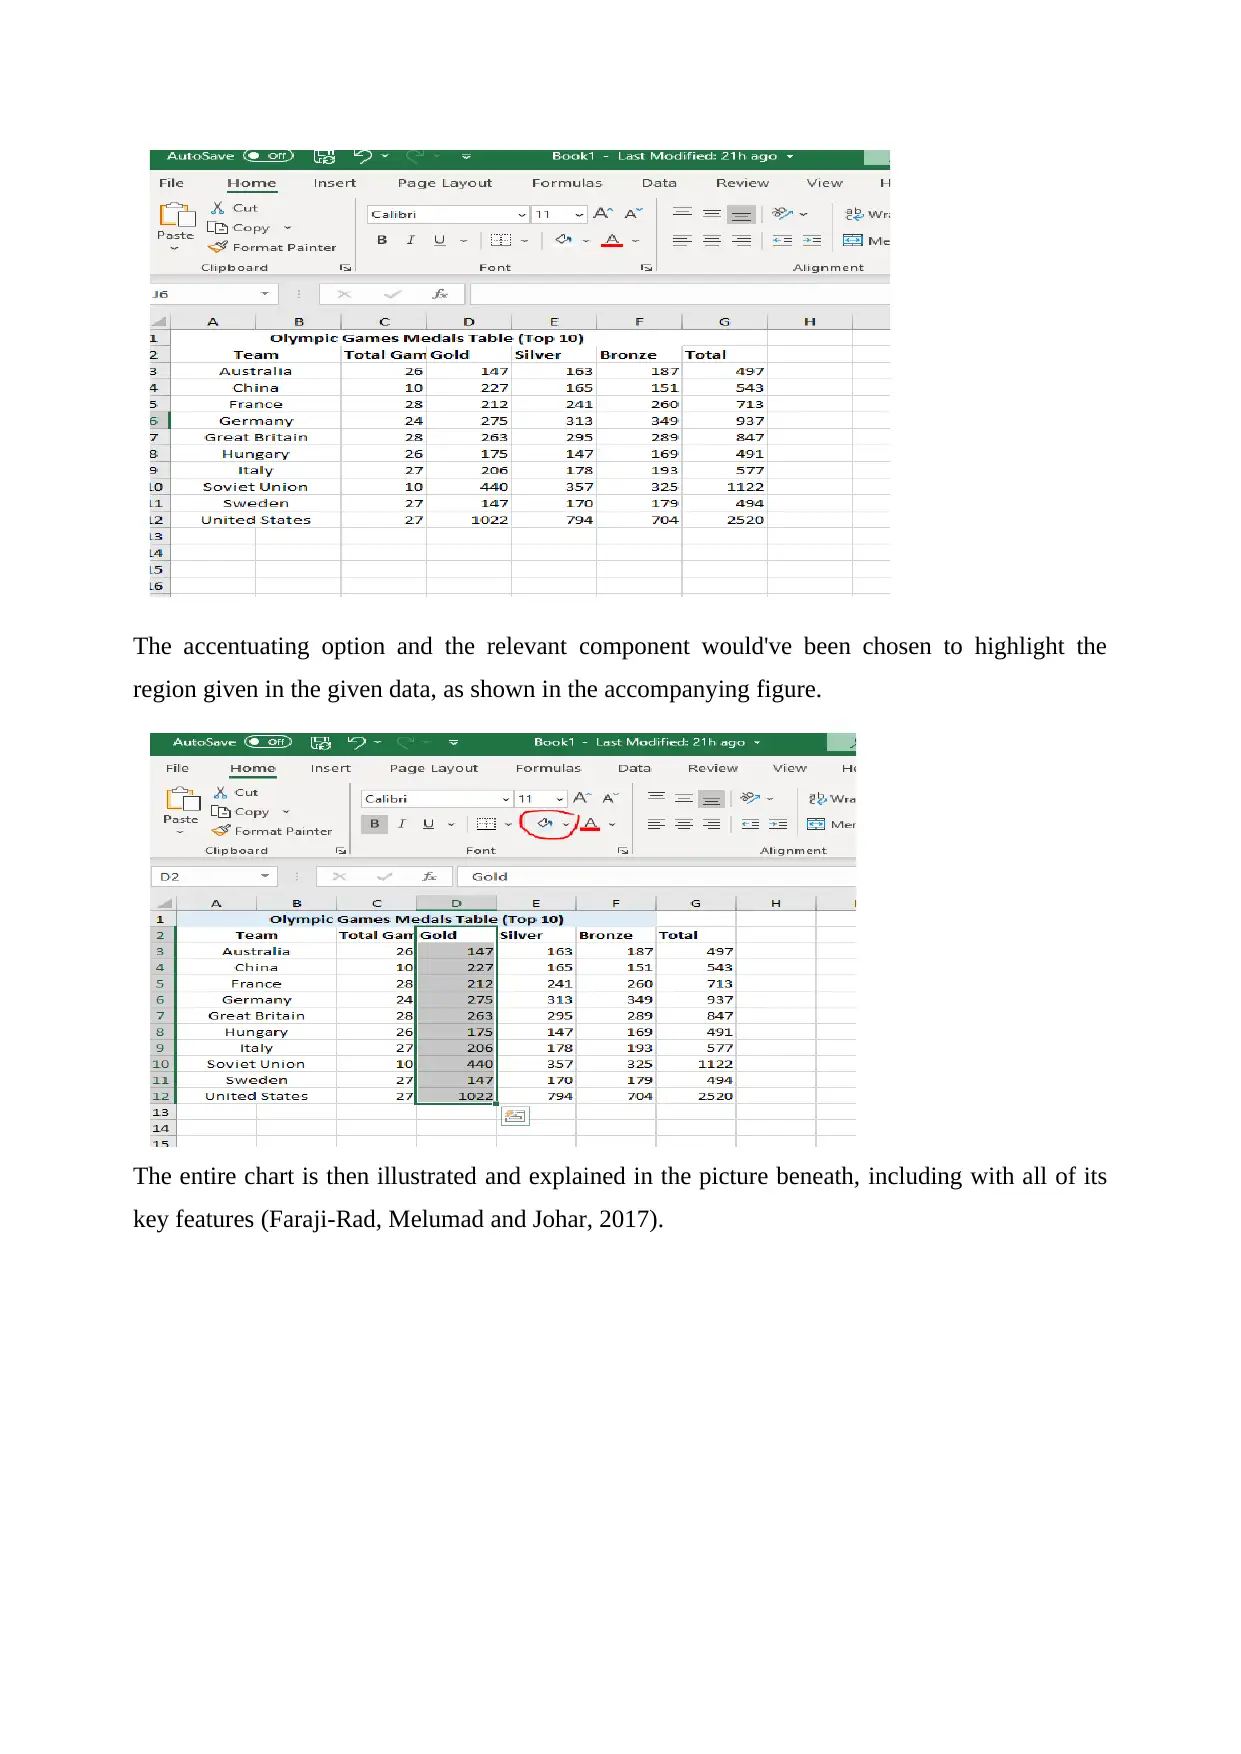
The accentuating option and the relevant component would've been chosen to highlight the
region given in the given data, as shown in the accompanying figure.
The entire chart is then illustrated and explained in the picture beneath, including with all of its
key features (Faraji-Rad, Melumad and Johar, 2017).
region given in the given data, as shown in the accompanying figure.
The entire chart is then illustrated and explained in the picture beneath, including with all of its
key features (Faraji-Rad, Melumad and Johar, 2017).
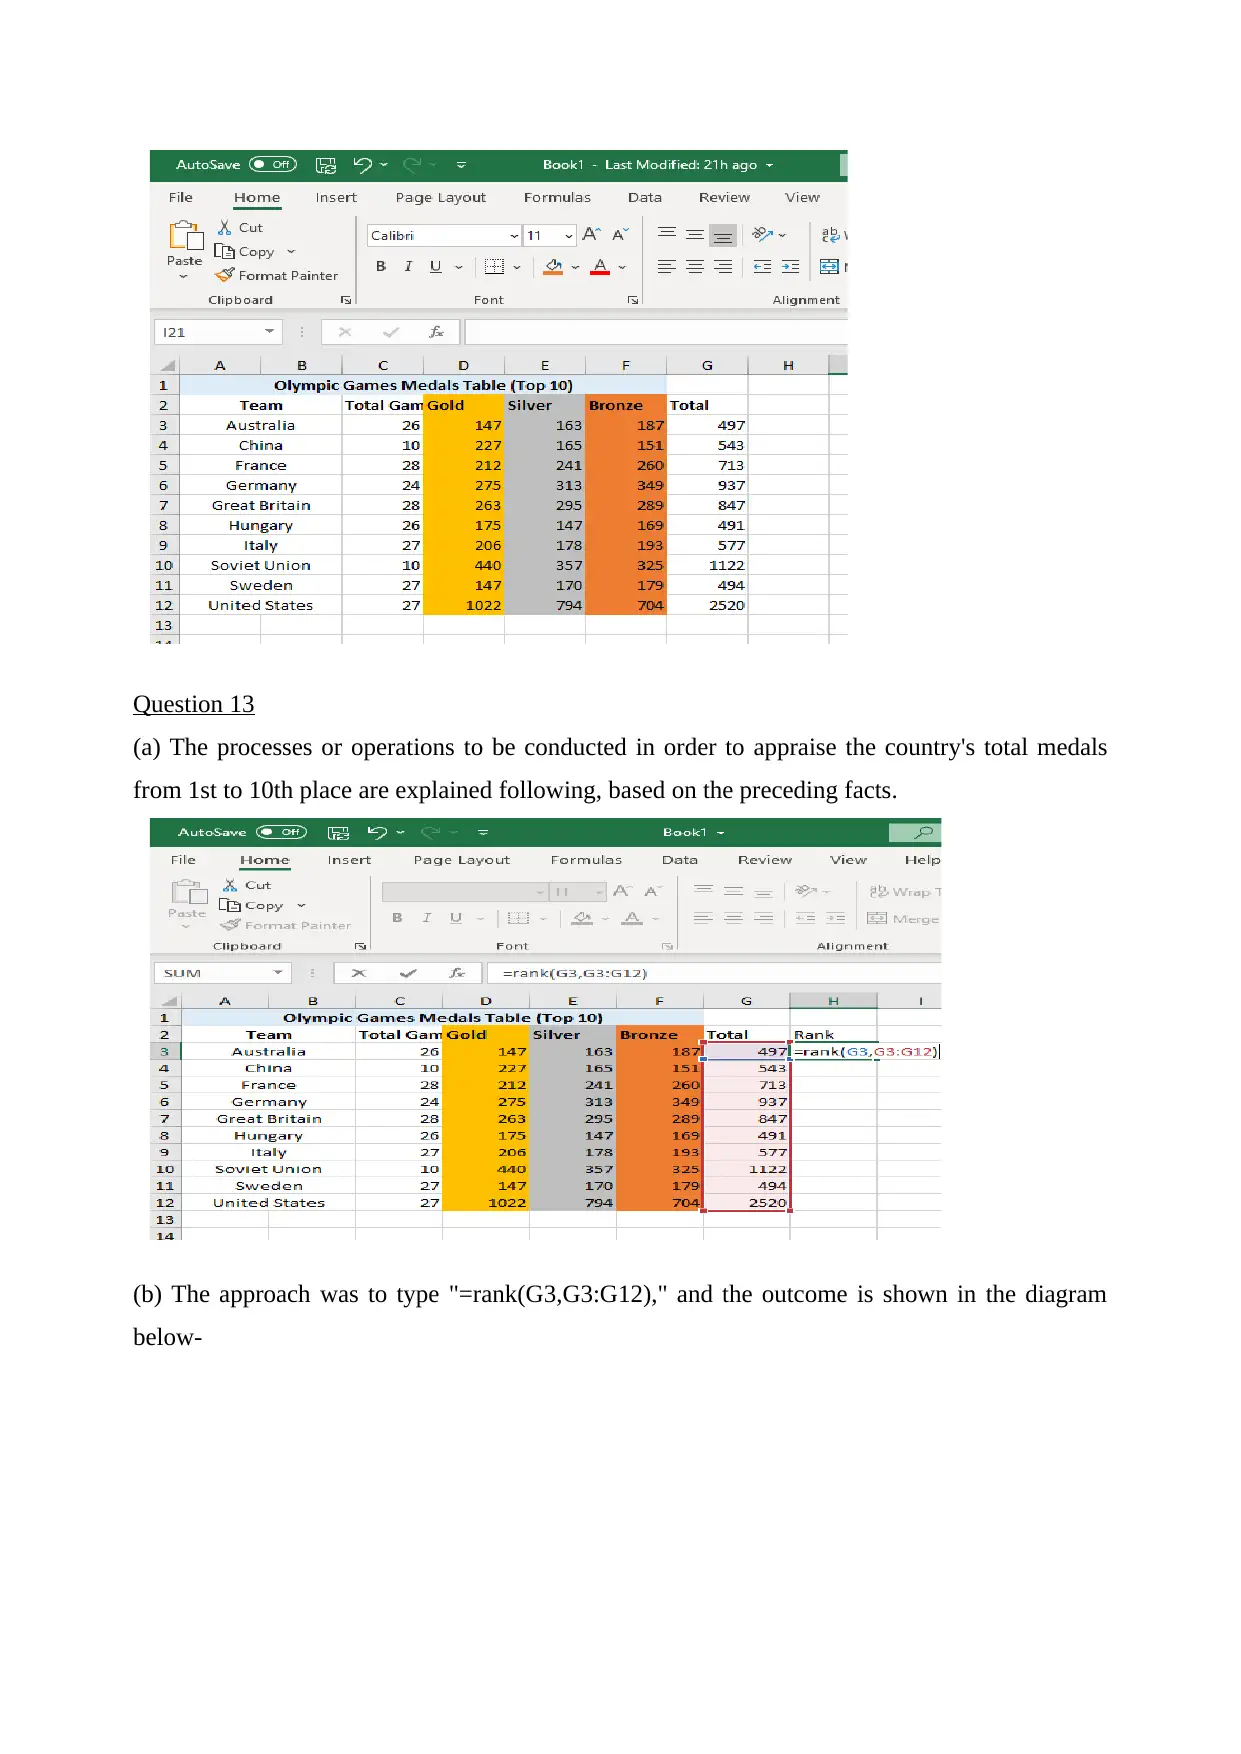
Question 13
(a) The processes or operations to be conducted in order to appraise the country's total medals
from 1st to 10th place are explained following, based on the preceding facts.
(b) The approach was to type "=rank(G3,G3:G12)," and the outcome is shown in the diagram
below-
(a) The processes or operations to be conducted in order to appraise the country's total medals
from 1st to 10th place are explained following, based on the preceding facts.
(b) The approach was to type "=rank(G3,G3:G12)," and the outcome is shown in the diagram
below-
⊘ This is a preview!⊘
Do you want full access?
Subscribe today to unlock all pages.
Trusted by 1+ million students worldwide
1 out of 22
Related Documents


Your All-in-One AI-Powered Toolkit for Academic Success.
+13062052269
info@desklib.com
Available 24*7 on WhatsApp / Email
![[object Object]](/_next/static/media/star-bottom.7253800d.svg)
Unlock your academic potential
Copyright © 2020–2026 A2Z Services. All Rights Reserved. Developed and managed by ZUCOL.