Numeracy and Data Analysis Report: Humidity Study in Southampton

Verified

Added on  2023/06/06

|12
|1844
|341
Report
AI Summary
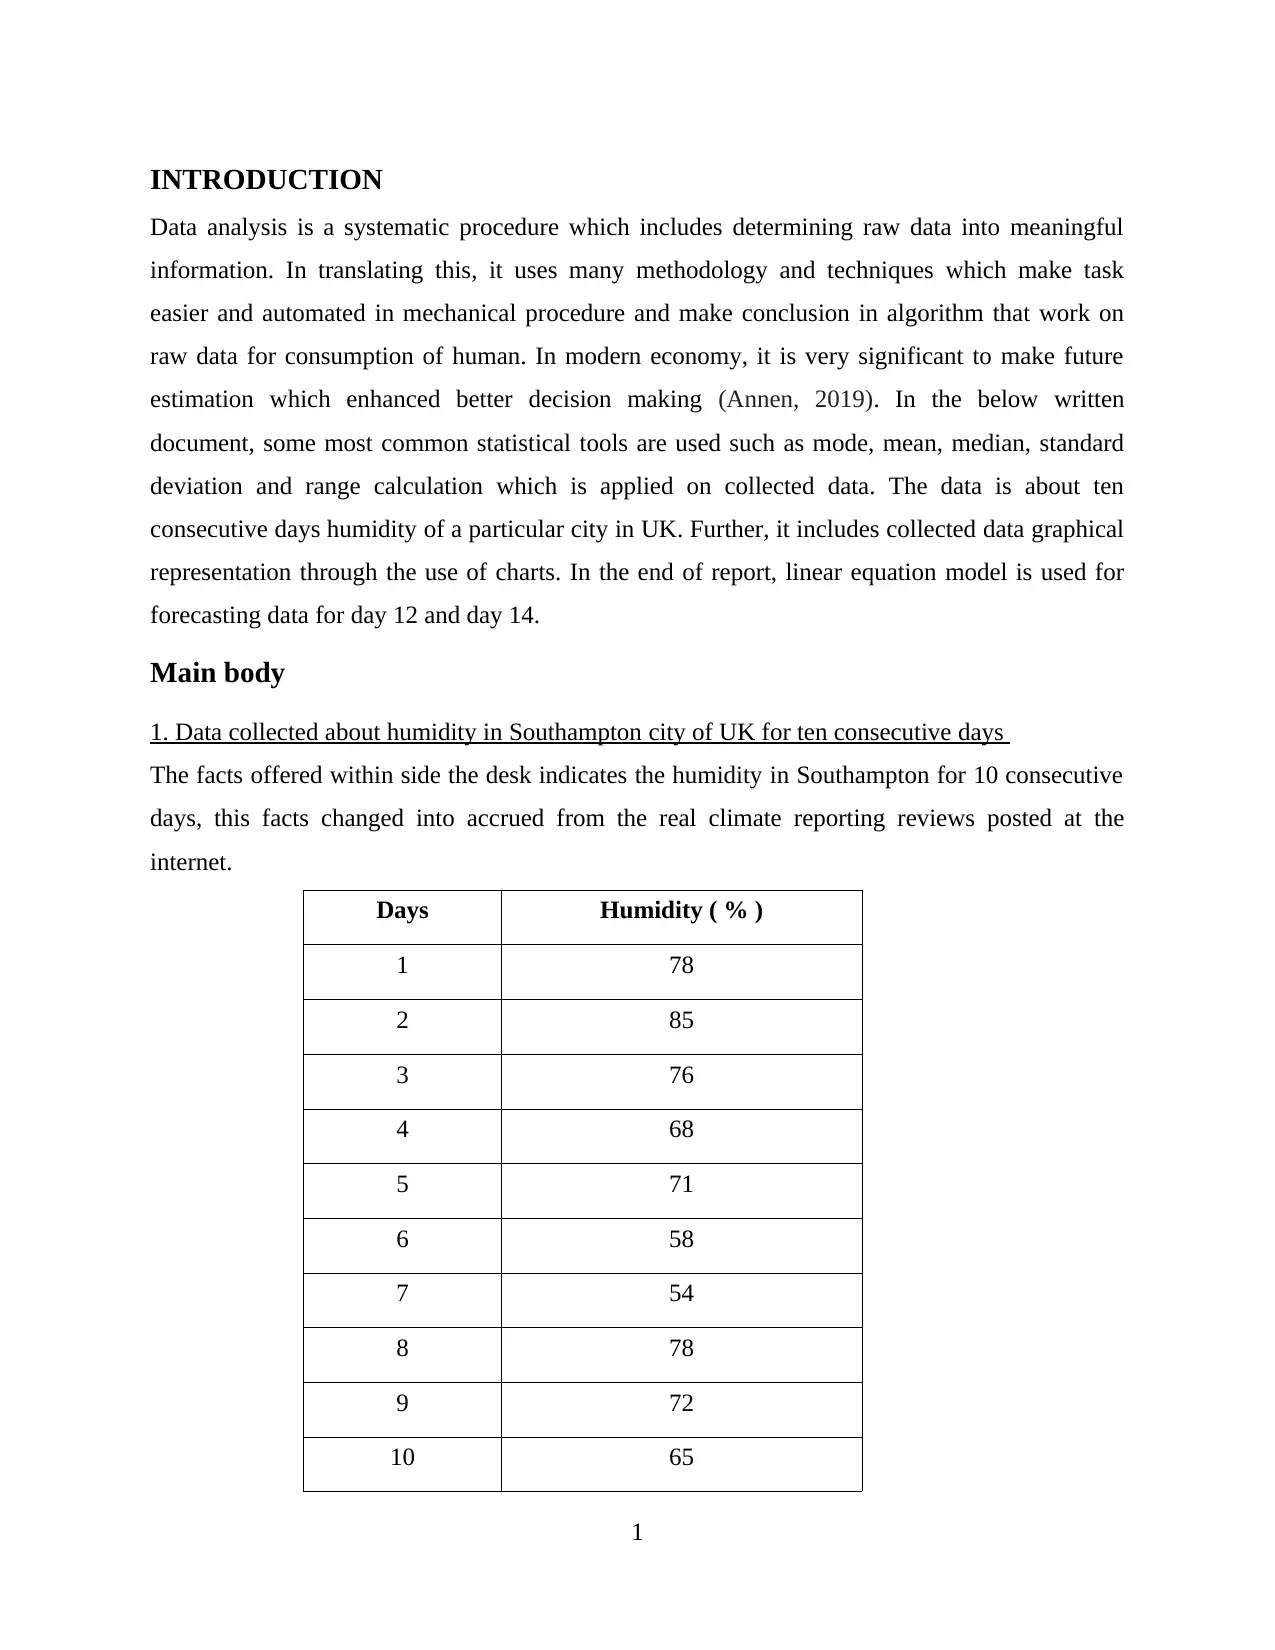
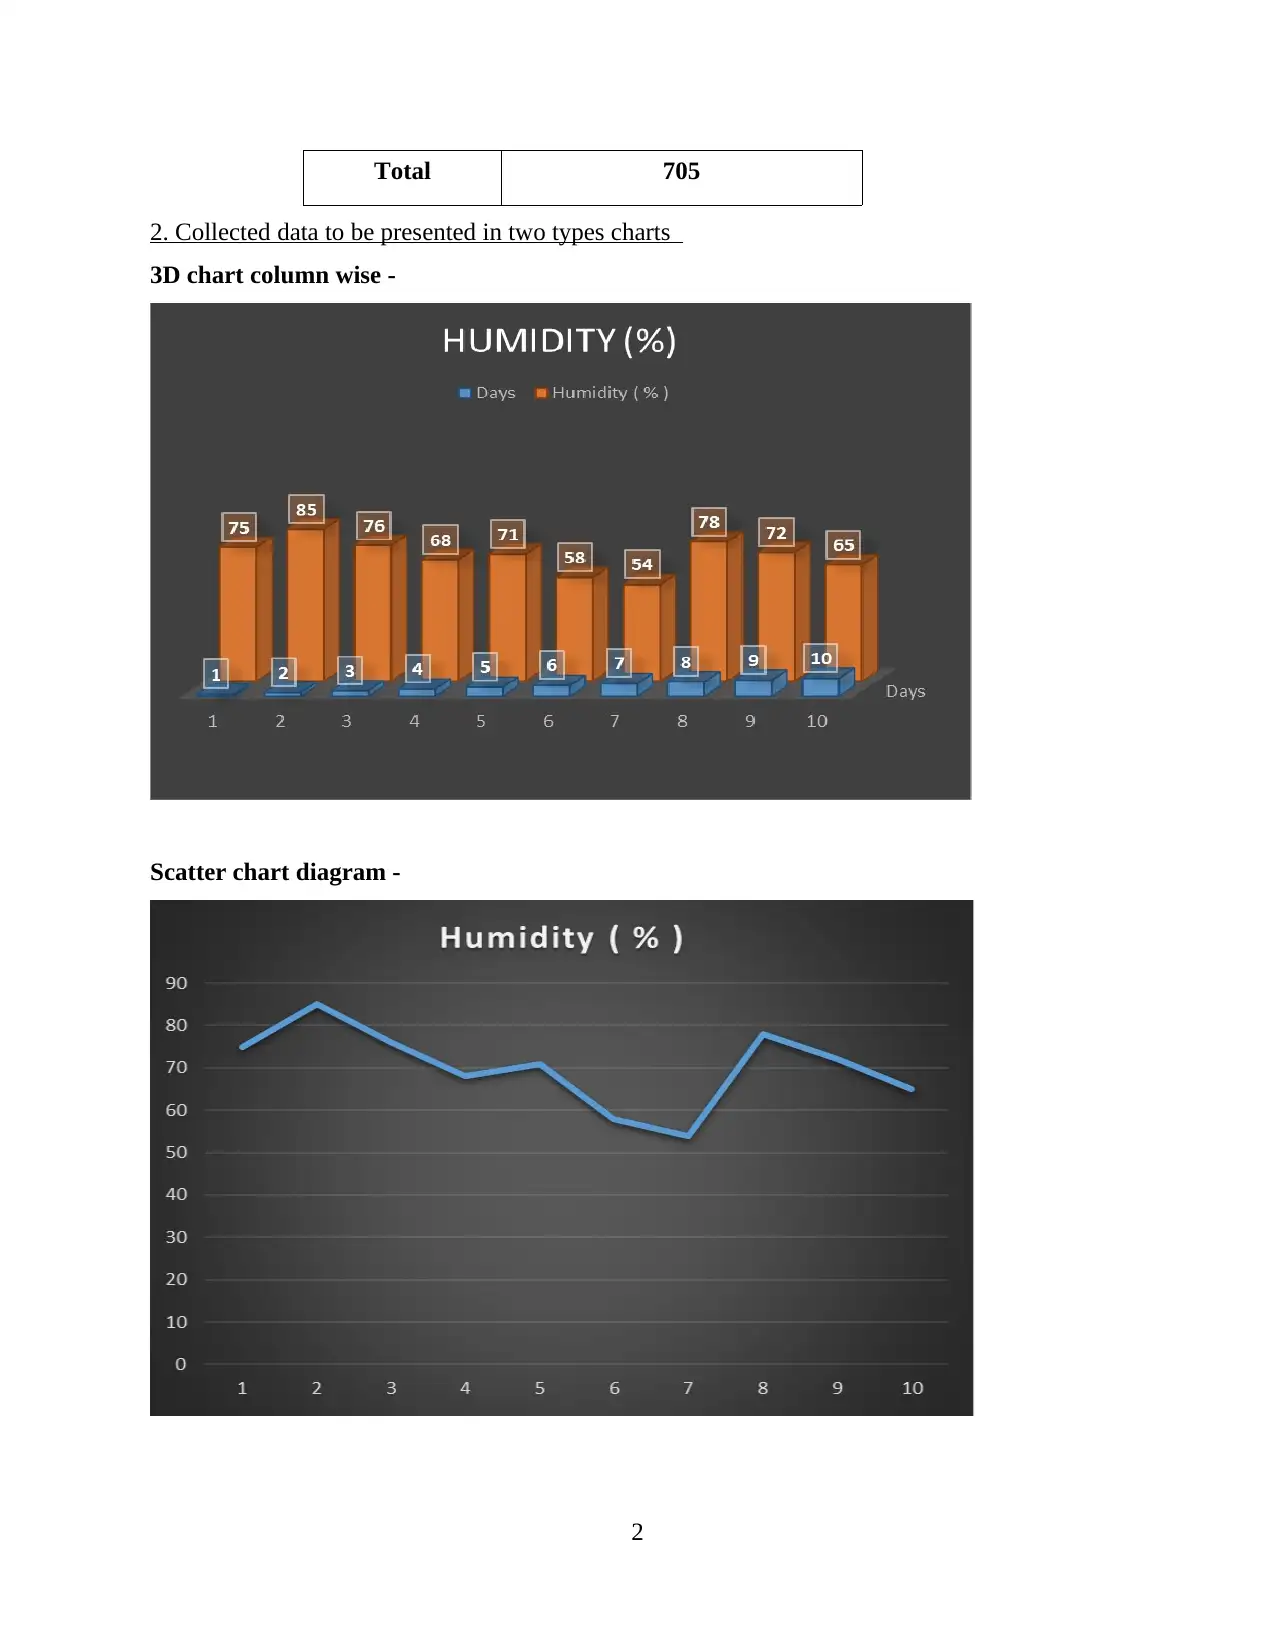
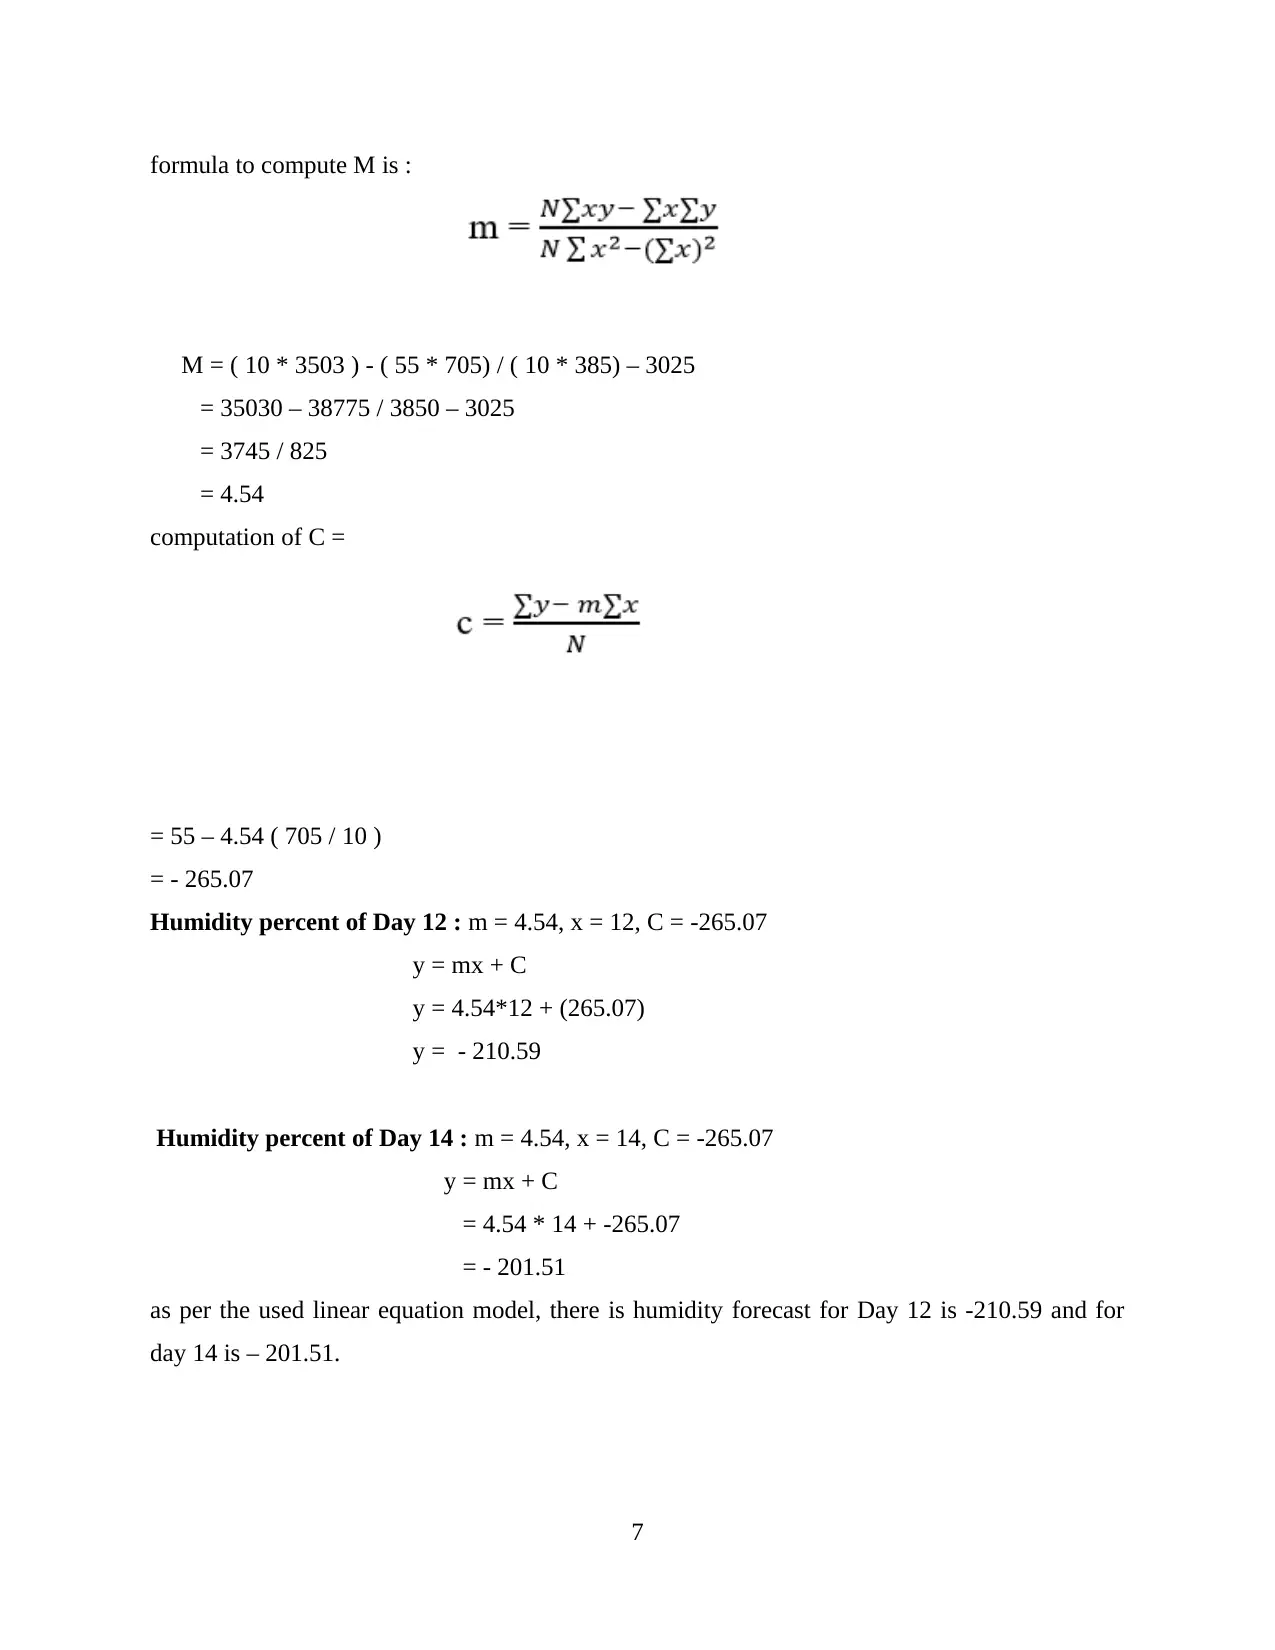
This report presents a comprehensive analysis of humidity data collected over ten consecutive days in Southampton, UK. The analysis includes graphical representations using charts and scatter diagrams, followed by statistical computations of mean, mode, median, range, and standard deviation to simplify and provide accurate insights into the collected data. A linear equation model is then applied for forecasting future humidity percentages, specifically for days 12 and 14. The report concludes by summarizing the findings and highlighting the effectiveness of statistical tools in data analysis and future prediction. Desklib provides access to similar solved assignments and past papers for students.
tabler-icon-diamond-filled.svg

Contribute Materials

Your contribution can guide someone’s learning journey. Share your documents today.
Document Page
Numeracy and Data
analysis
tabler-icon-diamond-filled.svg

Secure Best Marks with AI Grader

Need help grading? Try our AI Grader for instant feedback on your assignments.
Document Page
Contents
INTRODUCTION...........................................................................................................................1
Main body .......................................................................................................................................1
1. Data collected about humidity in Southampton city of UK for ten consecutive days ............1
2. Collected data to be presented in two types charts ................................................................1
3. Computation of mean, mode, median, range and standard deviation of collected data .........2
4. Calculate the value of 'm' and 'c' and note down the steps to be used. Compute the humidity
percentage of day 12 and 14 by using linear equation model......................................................5
CONCLUSION ...............................................................................................................................7
REFERENCES................................................................................................................................8
Document Page
Document Page
INTRODUCTION
Data analysis is a systematic procedure which includes determining raw data into meaningful
information. In translating this, it uses many methodology and techniques which make task
easier and automated in mechanical procedure and make conclusion in algorithm that work on
raw data for consumption of human. In modern economy, it is very significant to make future
estimation which enhanced better decision making (Annen, 2019). In the below written
document, some most common statistical tools are used such as mode, mean, median, standard
deviation and range calculation which is applied on collected data. The data is about ten
consecutive days humidity of a particular city in UK. Further, it includes collected data graphical
representation through the use of charts. In the end of report, linear equation model is used for
forecasting data for day 12 and day 14.
Main body
1. Data collected about humidity in Southampton city of UK for ten consecutive days
The facts offered within side the desk indicates the humidity in Southampton for 10 consecutive
days, this facts changed into accrued from the real climate reporting reviews posted at the
internet.
Days Humidity ( % )
1 78
2 85
3 76
4 68
5 71
6 58
7 54
8 78
9 72
10 65
1
tabler-icon-diamond-filled.svg

Secure Best Marks with AI Grader

Need help grading? Try our AI Grader for instant feedback on your assignments.
Document Page
Total 705
2. Collected data to be presented in two types charts
3D chart column wise -
Scatter chart diagram -
2
Document Page
3. Computation of mean, mode, median, range and standard deviation of collected data
Mean: It is a simple mathematical technique which is used to collect most common number
from set of numbers(Bharucha, 2019). The calculated average number which represent whole
column data. It assists in comparison of given data set.
Steps to calculate mean :
1. From the given data set, add all the values to find out total.
2. After adding up all data values then have to divide with number of values.
Formula for calculating mean :
sum of all data in table
Mean = ----------------------------
number in value in data table
Calculation of mean in given data set -
total humidity in given data = 705 %
Total number of days in value = 10
Mean = 705 / 10
Hence, the given mean is = 70.5 %
Mode
Mode may be a really useful degree of critical tendency. One of its largest benefit is that it could
be carried out to any sort of data, while each of the suggest and median can not be calculated for
nominal data. In statistics, the mode is the price which is again and again happening in a given
set(Choi and et.al., 2019). It can say that the price or variety in a statistics set, which has a
excessive frequency or seems greater frequently is referred to as mode or modal price.
Steps to calculate Mode:
1. Take the given data set in ascending order or descending order
2. Calculate how usually every variety of number occur
Now, computation of mode in given data set -
Total number of given observation – 10 days
humidity (%) = 78,85,76,68,71,58,54,78,72,65
mode = 78%
Thus, as in keeping with the records given within side the set approximately the percent of wind
in Southampton, commonly 78% is the humidity.
3
Document Page
Median
The median is the middle quantity in a taken care for listing of numbers and may be extra
descriptive of that facts set than the common. The median is on occasion used in place of the
suggest while there are outliers within side the series that would skew the common of the values
(Ding, 2022).
Steps to calculate median -
1. Arrange the statistical data in ascending order (from the bottom to the biggest value).
2. Determine whether or not there's a fair or an ordinary quantity of values within side the
dataset.
3. Considering the consequences of the preceding step.
Median calculation formula = number of terms + 1 / 2
key observation
Days Humidity ( % )
1st 78
2nd 85
3rd 76
4th 68
5th 71
6th 58
7th 54
8th 78
9th 72
10th 65
Total number of days = 10
Median value of days = 10 / 2
= 5th term which is 71 %
Average median = (upper value + lower value) / 2 = ( 85 + 58 ) / 2 = 71.5 %
4
tabler-icon-diamond-filled.svg

Paraphrase This Document

Need a fresh take? Get an instant paraphrase of this document with our AI Paraphraser
Document Page
Thus, it can be concluded that median of this data set is 72 %.
Range
It is the intense values of the records set,
Steps for calculating range:
Step 1. Computation the given set of record.
2. Select the bottom or maximum range.
3. Deduct the best range from lowest range.
Range formula = Biggest value - lowest value
key observation
largest value of Humidity in Southampton = 85 %
smallest value of humidity = 58 %
Range = (85 – 58) % = 27 %
Standard deviation
It is measurable tool which tells about amount of variation in given data value set. It includes
data related to sample variable, population data set and distribution of probability (Kaye, 2018).
If the given data value set is square root then it is termed as variance.
Standard deviation formula (σ) =√∑ (xi – μ) ^ 2 / N
Days Humidity ( % ) Mean (μ) (x-μ) (x-μ)^2
1st 78 70.5 (78 – 70.5)=7.5 56.25
2nd 85 70.5 (85-70.5)=14.5 210.25
3rd 76 70.5 (76-70.5)=5.5 30.25
4th 68 70.5 (68-70.5)=-2.5 6.25
5th 71 70.5 (71-70.5)=0.5 0.25
6th 58 70.5 (58-70.5)=-12.5 156.25
7th 54 70.5 (54-70.5)=-16.5 272.25
8th 78 70.5 (78-70.5)= 7.5 56.25
9th 72 70.5 (72-70.5)=1.5 2.25
5
Document Page
10th 65 70.5 (65-70.5)= -5.5 30.25
Total Gross 705 -0.5 820.5
= √820.5/10
= √82.05
= 9.058
key observation = by applying the standard deviation formula the results are 9.058
4. Calculate the value of 'm' and 'c' and note down the steps to be used. Compute the humidity
percentage of day 12 and 14 by using linear equation model.
Days Humidity (%)
1st 78
2nd 85
3rd 76
4th 68
5th 71
6th 58
7th 54
8th 78
9th 72
10th 65
Linear forecasting formula= (y = mx + c)
Linear prediction model: It is a tool which used to solve the problems of statistical that is to
predict the future values when in contrast of past observations (Rottmann and et.al., 2020).
Some steps in examining this model:
1. determine the issue face.
2. Data set should be scurtinised when collected.
3. Select the most feasible method.
4. Proper analysis of issue after ascertaining many other things.
Calculation of M:
6
Document Page
formula to compute M is :
M = ( 10 * 3503 ) - ( 55 * 705) / ( 10 * 385) – 3025
= 35030 – 38775 / 3850 – 3025
= 3745 / 825
= 4.54
computation of C =
= 55 – 4.54 ( 705 / 10 )
= - 265.07
Humidity percent of Day 12 : m = 4.54, x = 12, C = -265.07
y = mx + C
y = 4.54*12 + (265.07)
y = - 210.59
Humidity percent of Day 14 : m = 4.54, x = 14, C = -265.07
y = mx + C
= 4.54 * 14 + -265.07
= - 201.51
as per the used linear equation model, there is humidity forecast for Day 12 is -210.59 and for
day 14 is – 201.51.
7
tabler-icon-diamond-filled.svg

Secure Best Marks with AI Grader

Need help grading? Try our AI Grader for instant feedback on your assignments.
Document Page
CONCLUSION
From the above report, it can be concluded that humidity of Southampton, UK for ten
consecutive days were accumulated. Further, using chart and scatter diagram graph were
represented. Standard of principal tendency become then implemented to the records. That is
mean, mode, median, variety and deviation. These all equipment simplified the records and gave
extra exact records approximately the records collected. Linear equation version become then
used for destiny projection and implemented to the records for accumulate the estimation of
humidity percent on day 12 and day 14.
8
Document Page
REFERENCES
Annen, S., 2019. Measuring labour market success: a comparison between immigrants and
native-born Canadians using PIAAC. Journal of Vocational Education &
Training. 71(2). pp.218-238.
Bharucha, J. P., 2019. Determinants of financial literacy among Indian youth. In Dynamic
Perspectives on Globalization and Sustainable Business in Asia .(pp. 154-167). IGI
Global.
Choi, S. J., and et.al., 2019. Impact of vocational education and training on adult skills and
employment: An applied multilevel analysis. International Journal of Educational
Development. 66. pp.129-138.
Ding, L., 2022, February. Data Mining in the University English Teaching Quality Analysis and
Research. In 2022 11th International Conference of Information and Communication
Technology (ICTech)). (pp. 292-297). IEEE.
Kaye, D., 2018. Defining adult and numeracy: An academic and political investigation.
In Contemporary Research in Adult and Lifelong Learning of Mathematics. (pp. 11-37).
Springer, Cham.s
Rottmann, T. and et.al., 2020. Inclusive assessment of whole number knowledge—development
and evaluation of an assessment interview for children with visual impairments in the
primary grades. Mathematics Education Research Journal. 32(1). pp.147-170.
9
chevron_up_icon
1 out of 12
circle_padding
hide_on_mobile
zoom_out_icon
logo.png

Your All-in-One AI-Powered Toolkit for Academic Success.

Available 24*7 on WhatsApp / Email

[object Object]