Numeracy and Data Analysis: Forecasting London Humidity Levels
VerifiedAdded on 2023/06/14
|9
|1392
|462
Homework Assignment
AI Summary
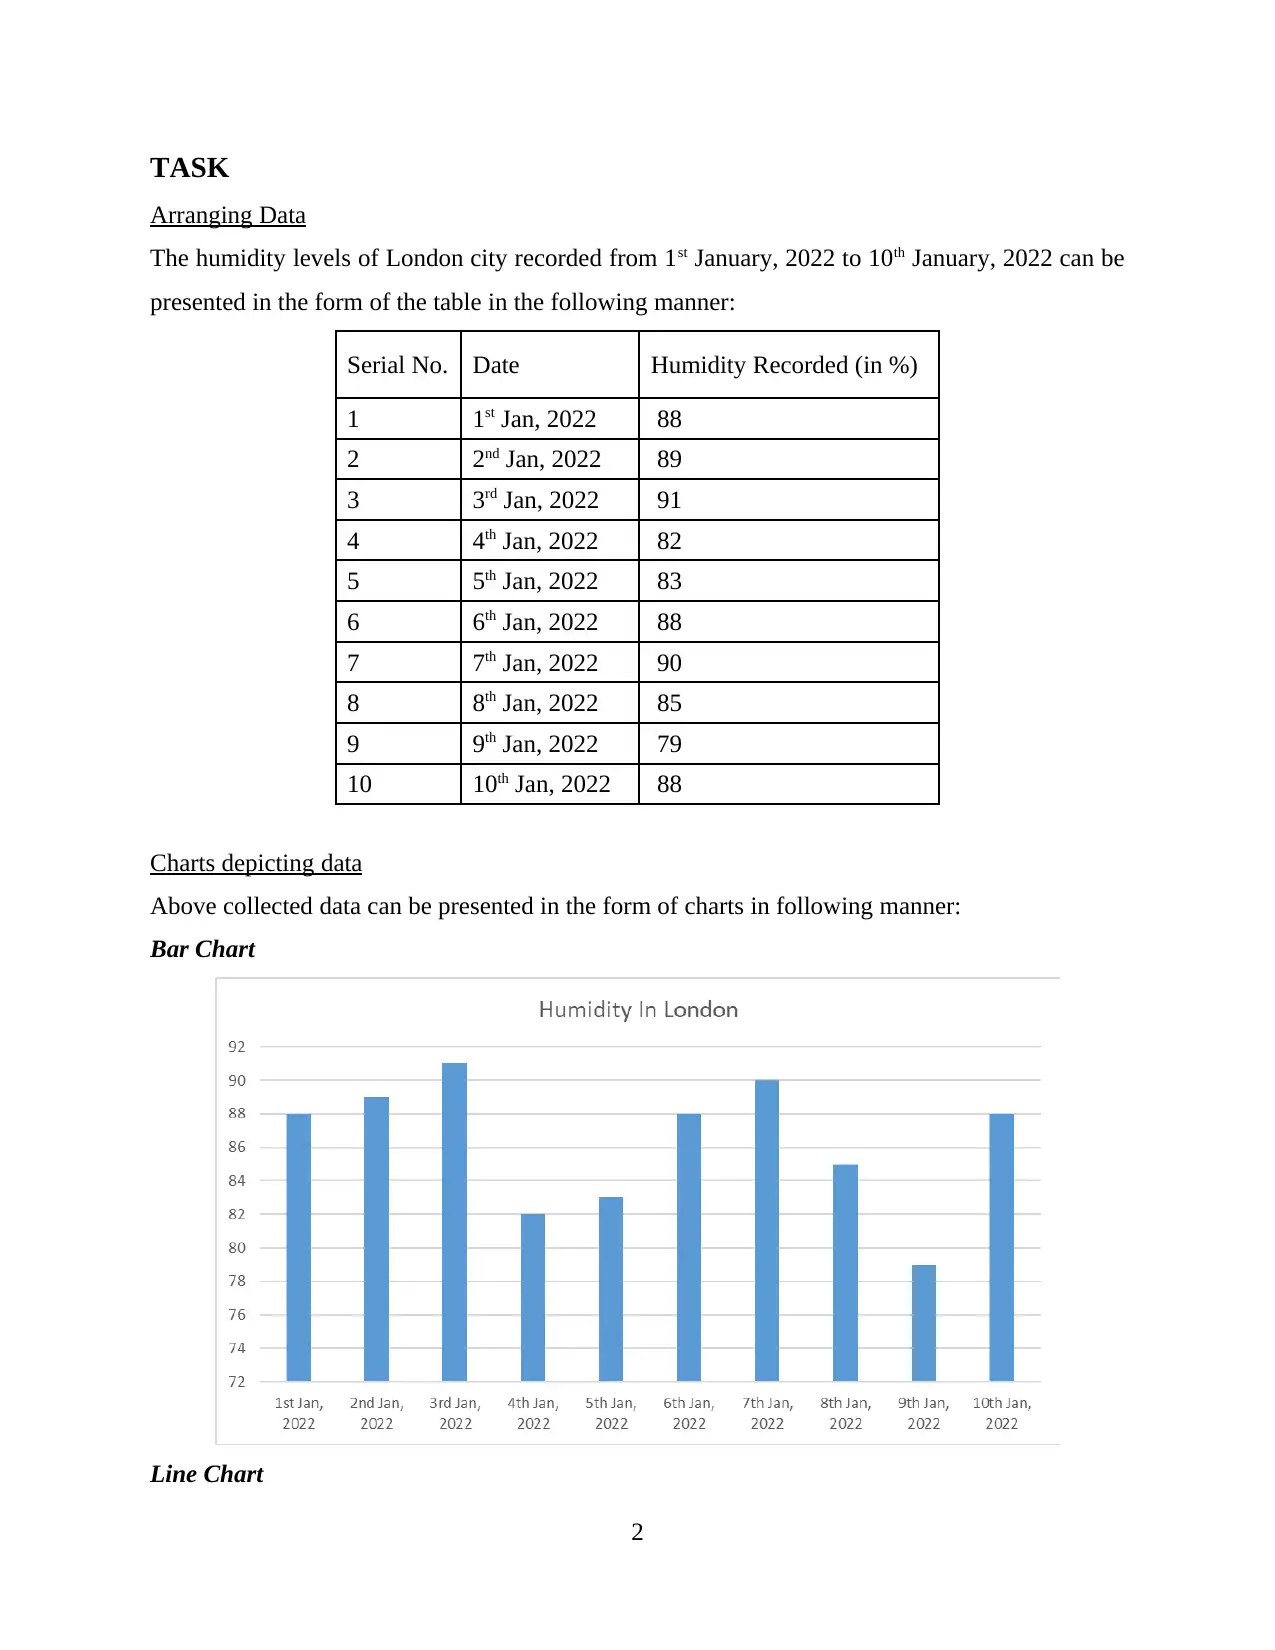
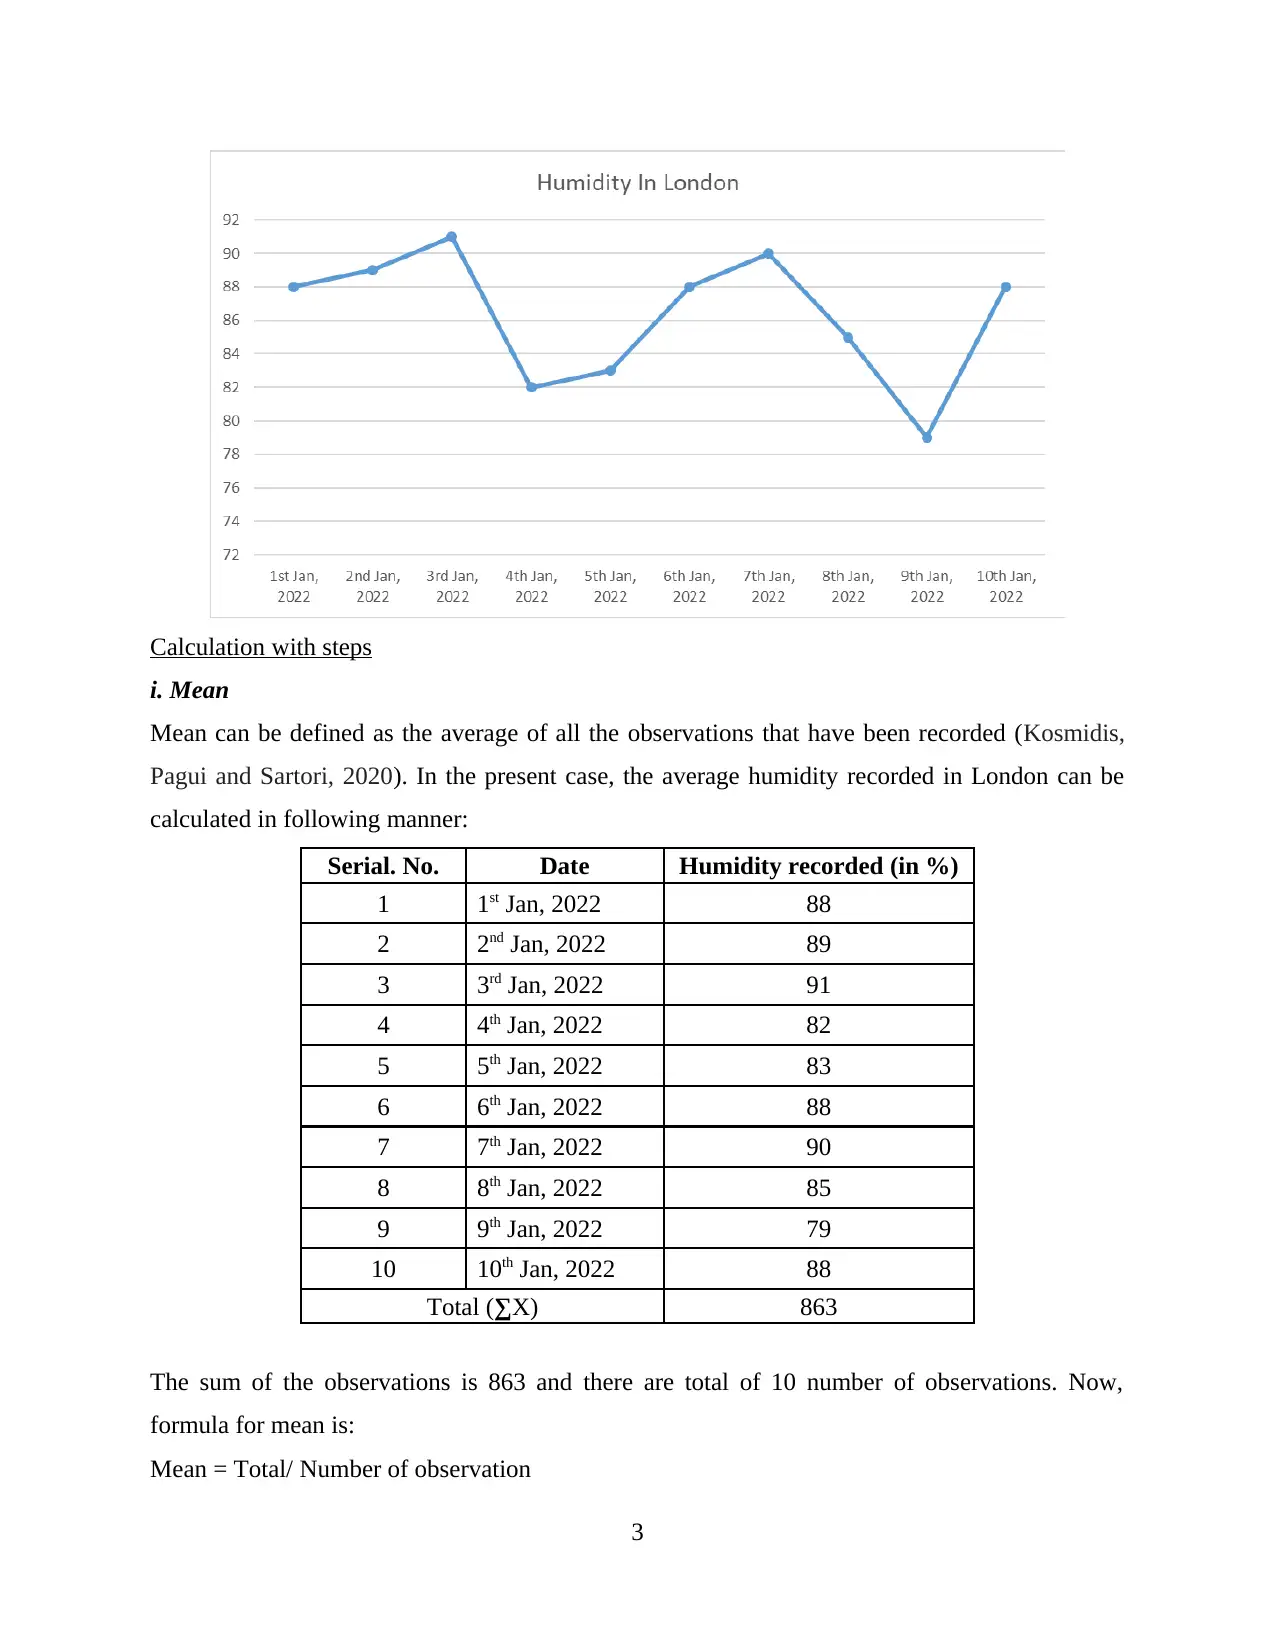
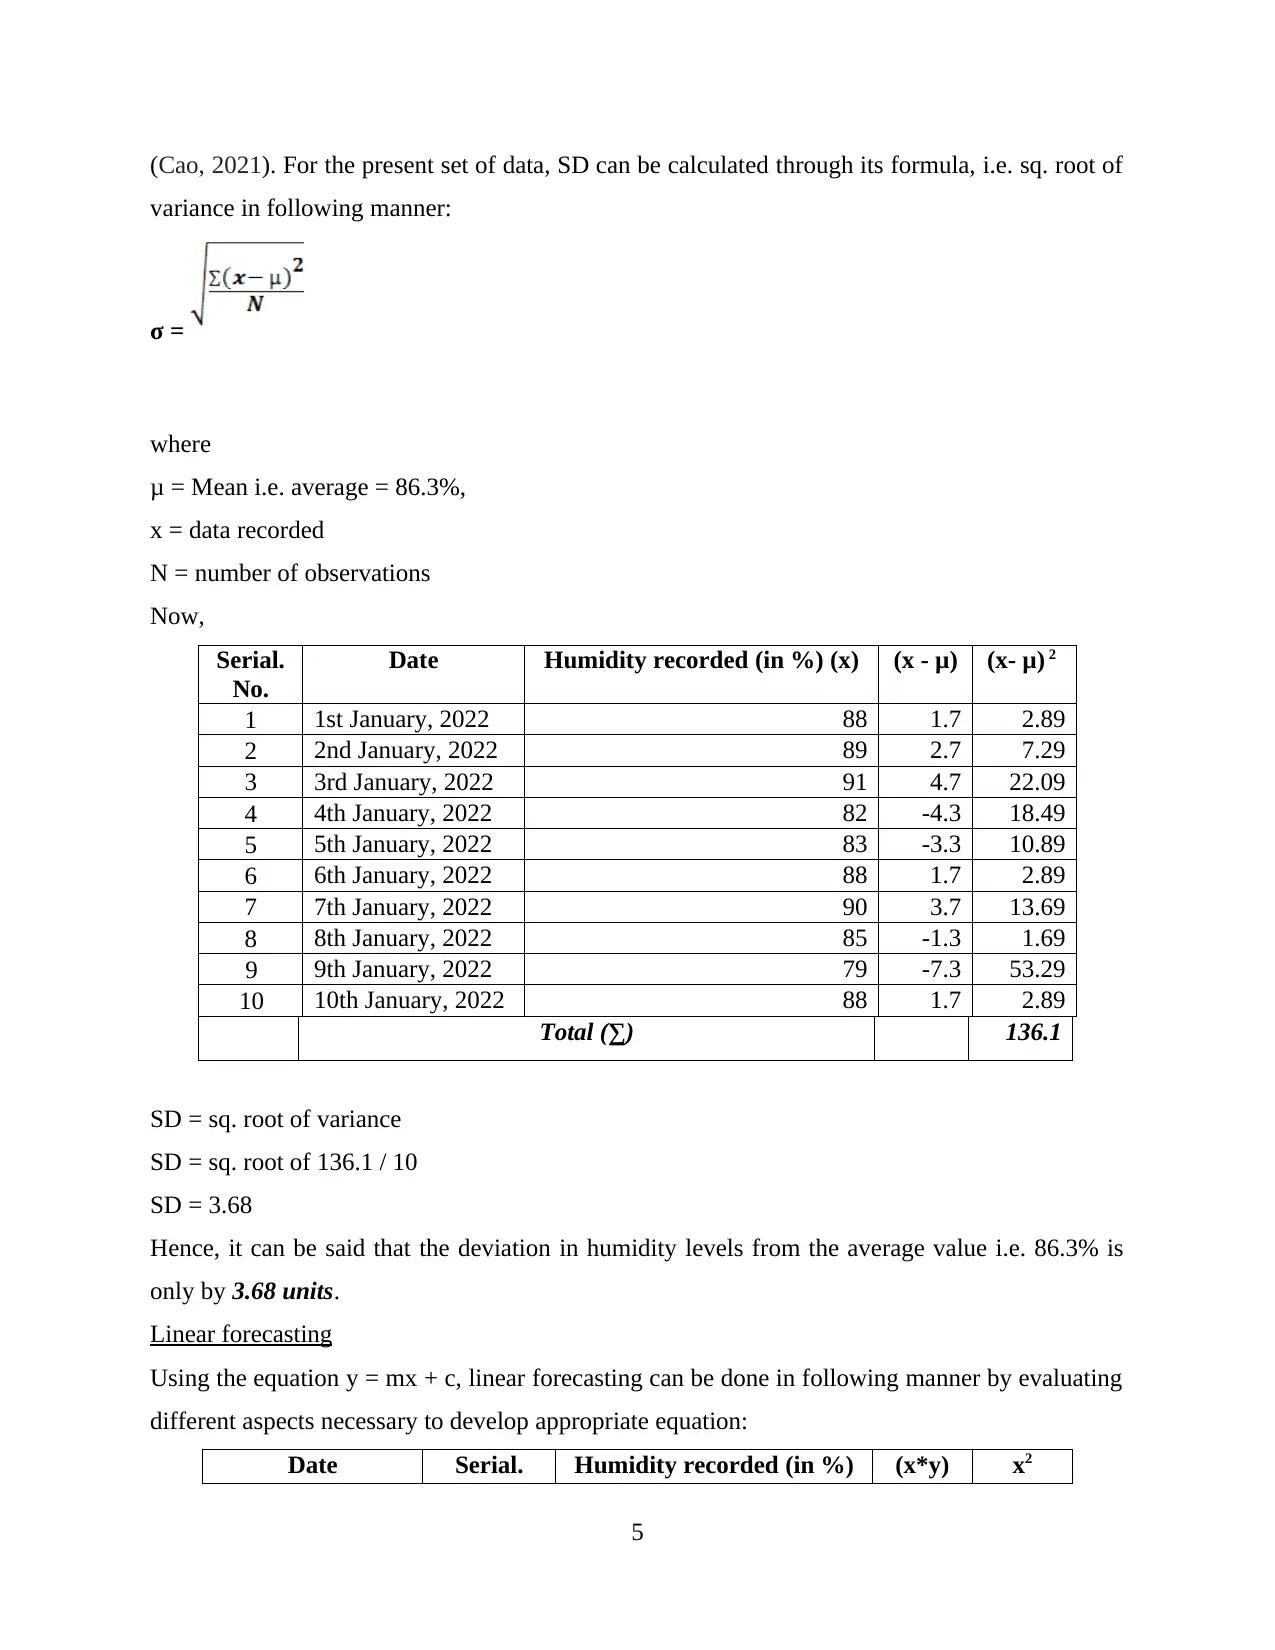
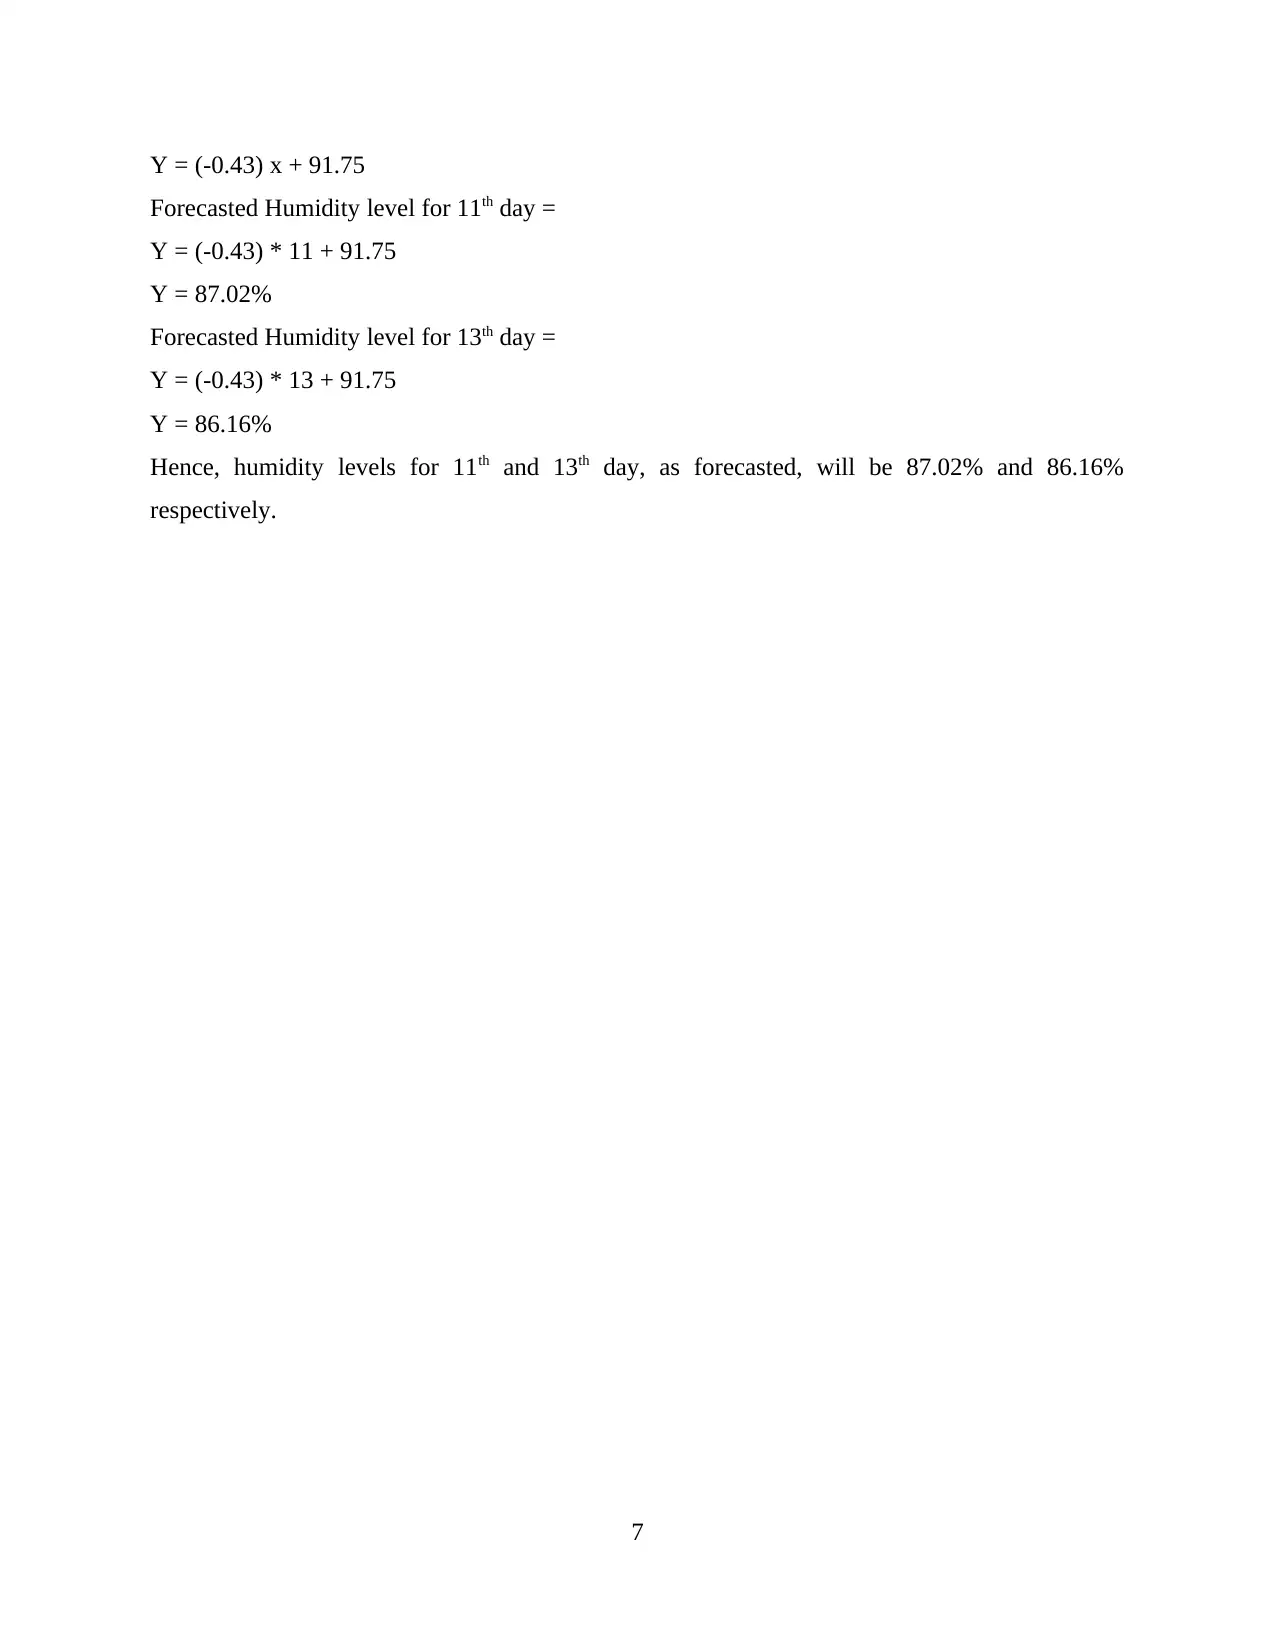
This assignment focuses on the numerical and data analysis of humidity levels recorded in London from January 1st to January 10th, 2022. The data is arranged in a table and presented using bar and line charts. Key statistical measures, including mean (86.3%), median (88%), mode (88%), range (12), and standard deviation (3.68), are calculated to describe the central tendency and variability of the humidity levels. Linear forecasting, using the equation y = mx + c, is applied to predict humidity levels for the 11th and 13th days, resulting in forecasts of 87.02% and 86.16%, respectively. The assignment provides a step-by-step calculation of each statistical measure and the forecasting process.


1 out of 9
Related Documents


Your All-in-One AI-Powered Toolkit for Academic Success.
+13062052269
info@desklib.com
Available 24*7 on WhatsApp / Email
![[object Object]](/_next/static/media/star-bottom.7253800d.svg)
Copyright © 2020–2026 A2Z Services. All Rights Reserved. Developed and managed by ZUCOL.