Numeracy and Data Analysis: Step-wise Calculations & Forecasting
VerifiedAdded on 2023/06/14
|8
|1260
|479
Homework Assignment
AI Summary
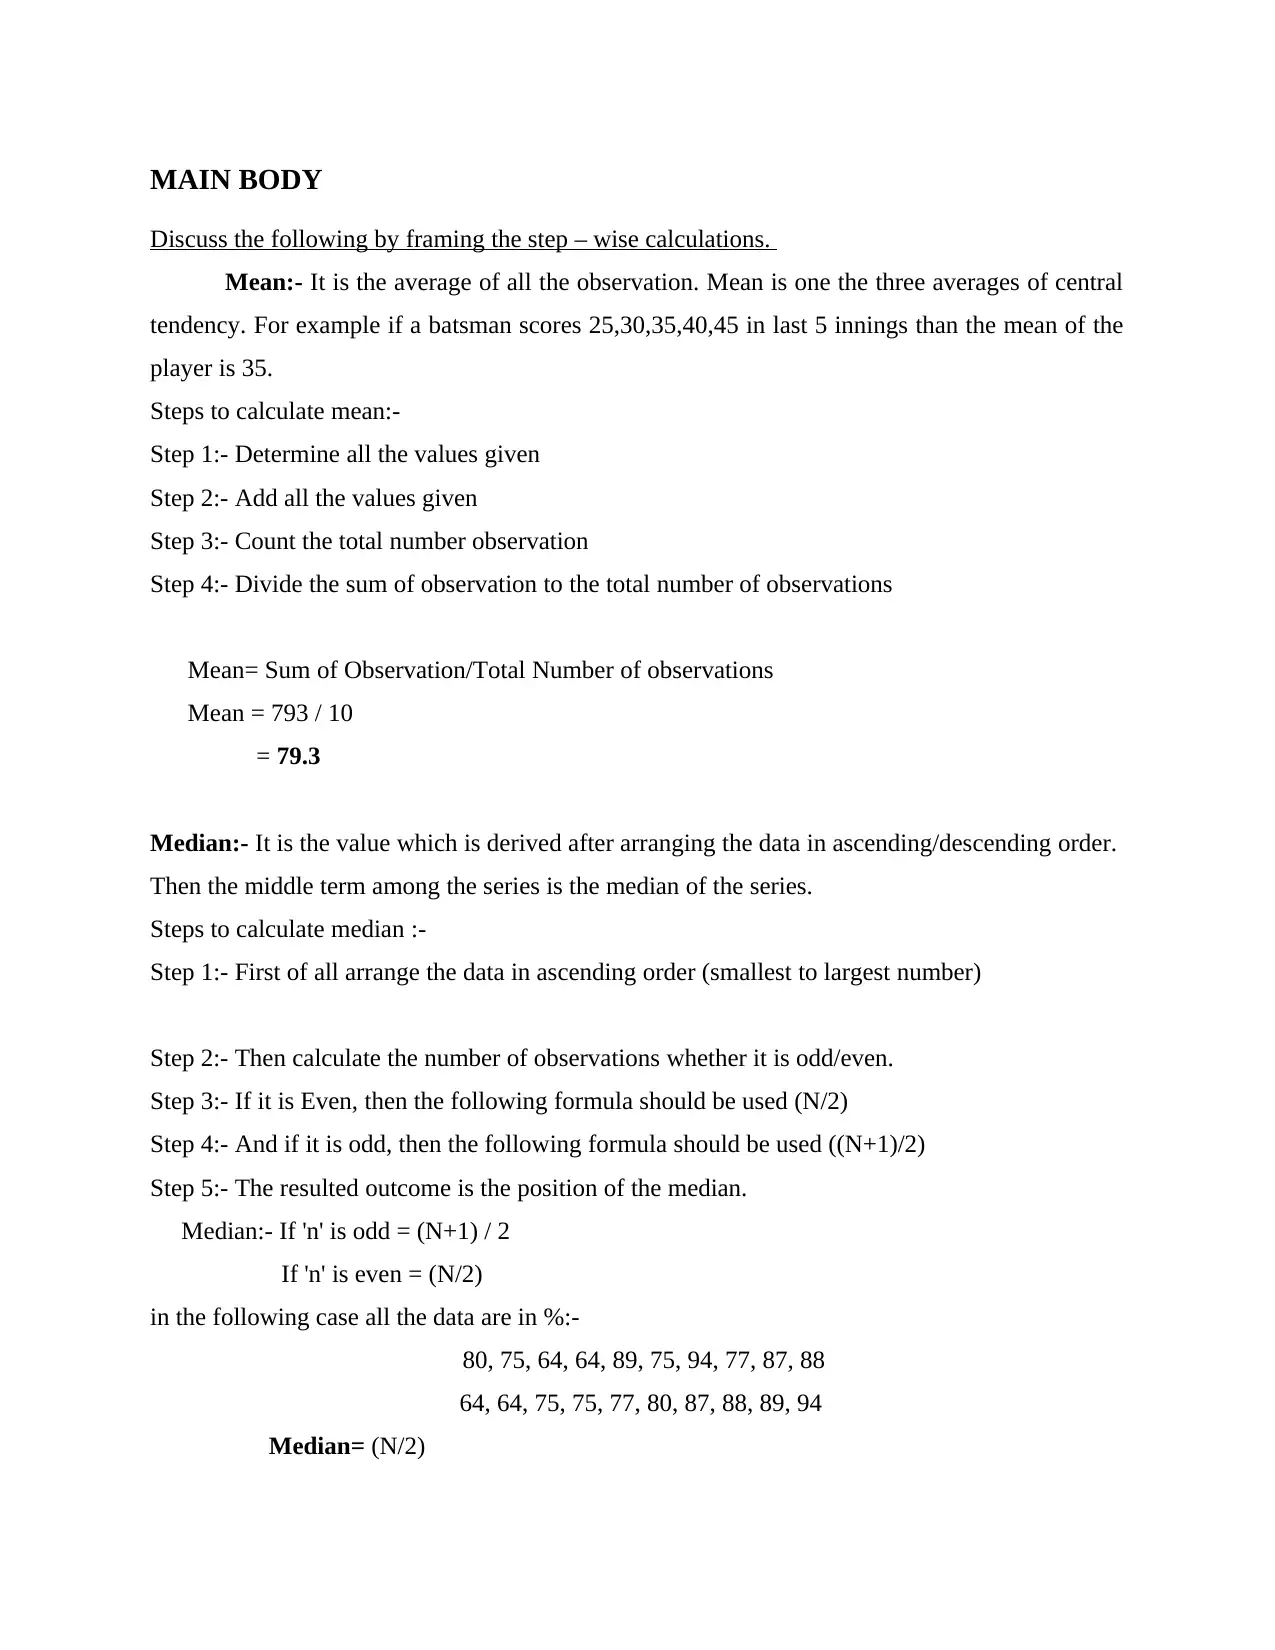
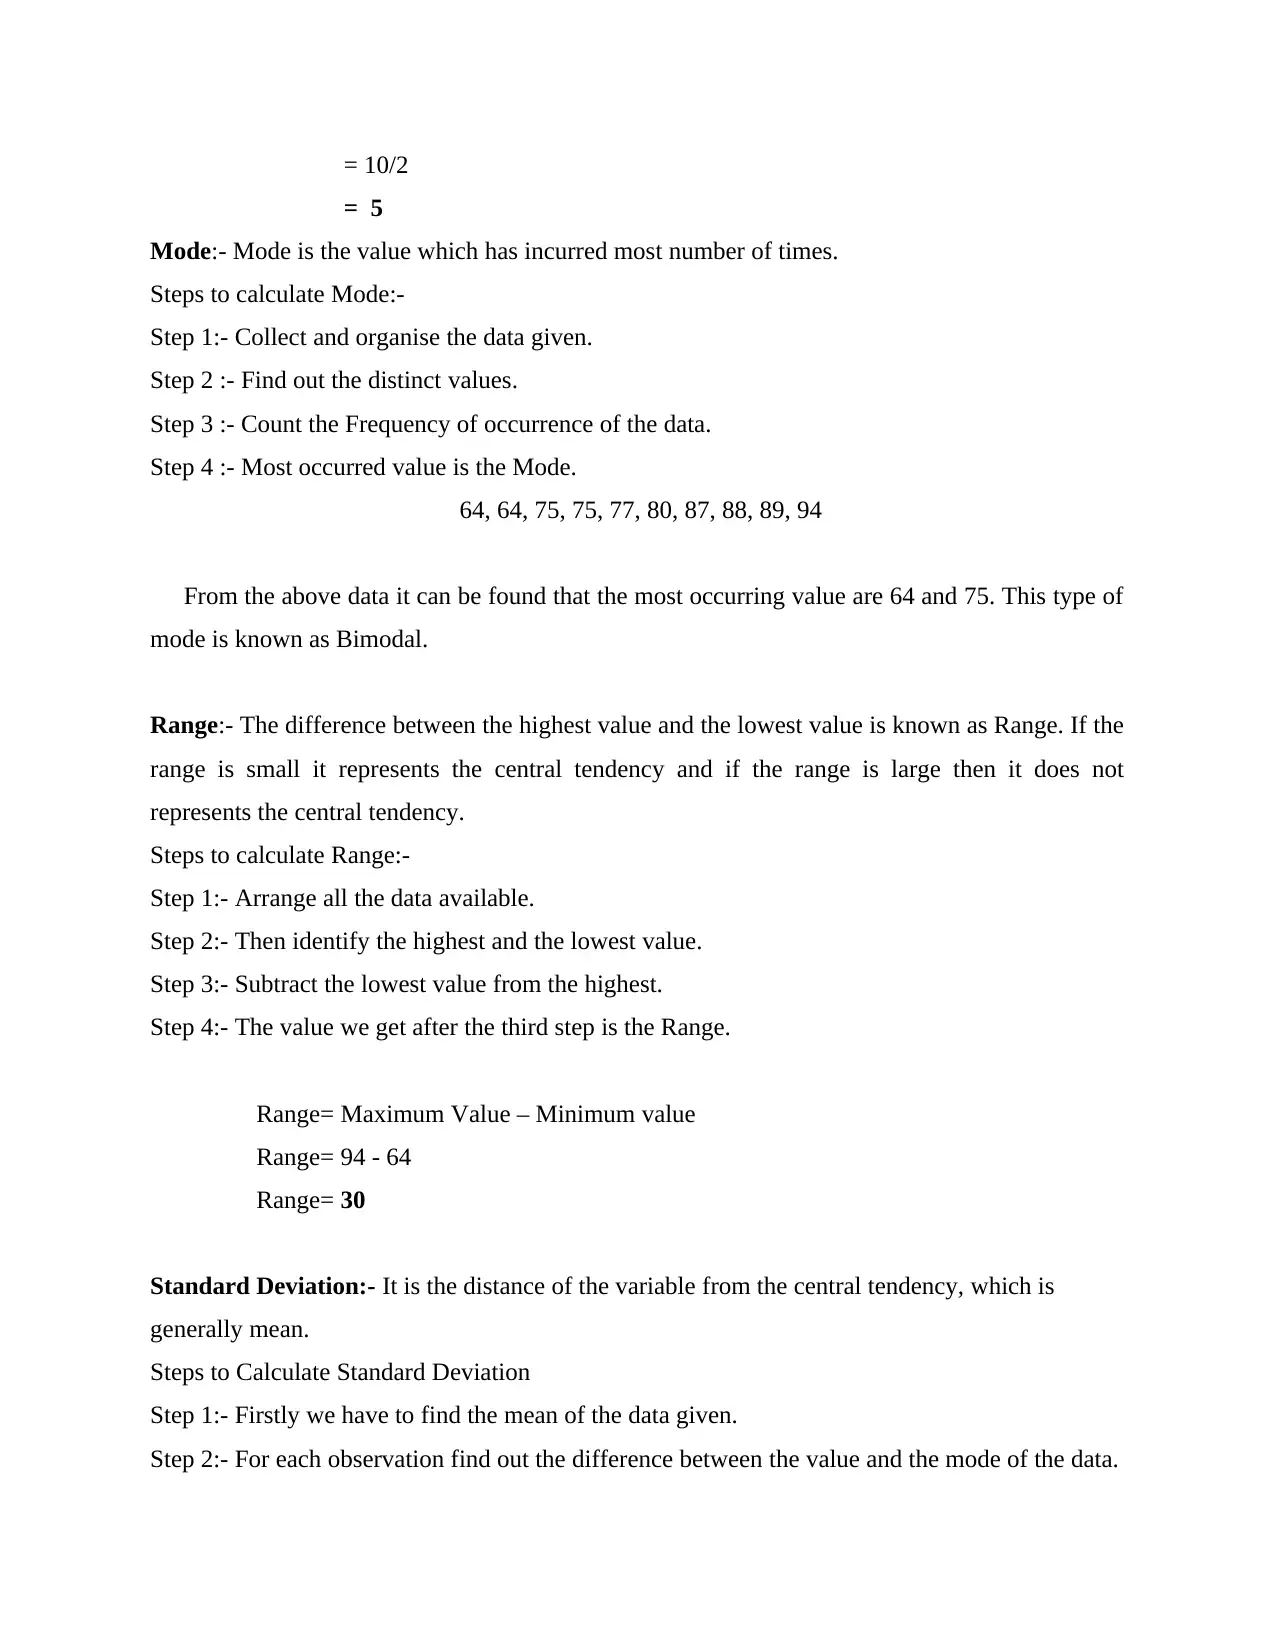
This assignment provides a detailed exploration of numeracy and data analysis, including step-by-step calculations for mean, median, mode, range, and standard deviation. It also covers the application of a linear forecasting model, framing the regression equation and calculating the values of 'm' and 'c'. The calculations are demonstrated with a specific dataset, and the results are interpreted to draw conclusions about the data's central tendency and variability. The assignment concludes by forecasting humidity values for future days using the derived linear model. Desklib offers this assignment as a resource for students, alongside a wealth of other solved assignments and past papers.

Numeracy and Data
Analysis
Analysis
Paraphrase This Document
Need a fresh take? Get an instant paraphrase of this document with our AI Paraphraser

Contents
MAIN BODY..................................................................................................................................3
Discuss the following by framing the step – wise calculations...................................................3
4. using the linear forecasting model frame the regression equation and calculate the value of
m and c.........................................................................................................................................5
CONCLUSION................................................................................................................................7
REFERENCES................................................................................................................................8

MAIN BODY
Discuss the following by framing the step – wise calculations.
Mean:- It is the average of all the observation. Mean is one the three averages of central
tendency. For example if a batsman scores 25,30,35,40,45 in last 5 innings than the mean of the
player is 35.
Steps to calculate mean:-
Step 1:- Determine all the values given
Step 2:- Add all the values given
Step 3:- Count the total number observation
Step 4:- Divide the sum of observation to the total number of observations
Mean= Sum of Observation/Total Number of observations
Mean = 793 / 10
= 79.3
Median:- It is the value which is derived after arranging the data in ascending/descending order.
Then the middle term among the series is the median of the series.
Steps to calculate median :-
Step 1:- First of all arrange the data in ascending order (smallest to largest number)
Step 2:- Then calculate the number of observations whether it is odd/even.
Step 3:- If it is Even, then the following formula should be used (N/2)
Step 4:- And if it is odd, then the following formula should be used ((N+1)/2)
Step 5:- The resulted outcome is the position of the median.
Median:- If 'n' is odd = (N+1) / 2
If 'n' is even = (N/2)
in the following case all the data are in %:-
80, 75, 64, 64, 89, 75, 94, 77, 87, 88
64, 64, 75, 75, 77, 80, 87, 88, 89, 94
Median= (N/2)
⊘ This is a preview!⊘
Do you want full access?
Subscribe today to unlock all pages.

Trusted by 1+ million students worldwide

= 10/2
= 5
Mode:- Mode is the value which has incurred most number of times.
Steps to calculate Mode:-
Step 1:- Collect and organise the data given.
Step 2 :- Find out the distinct values.
Step 3 :- Count the Frequency of occurrence of the data.
Step 4 :- Most occurred value is the Mode.
64, 64, 75, 75, 77, 80, 87, 88, 89, 94
From the above data it can be found that the most occurring value are 64 and 75. This type of
mode is known as Bimodal.
Range:- The difference between the highest value and the lowest value is known as Range. If the
range is small it represents the central tendency and if the range is large then it does not
represents the central tendency.
Steps to calculate Range:-
Step 1:- Arrange all the data available.
Step 2:- Then identify the highest and the lowest value.
Step 3:- Subtract the lowest value from the highest.
Step 4:- The value we get after the third step is the Range.
Range= Maximum Value – Minimum value
Range= 94 - 64
Range= 30
Standard Deviation:- It is the distance of the variable from the central tendency, which is
generally mean.
Steps to Calculate Standard Deviation
Step 1:- Firstly we have to find the mean of the data given.
Step 2:- For each observation find out the difference between the value and the mode of the data.
Paraphrase This Document
Need a fresh take? Get an instant paraphrase of this document with our AI Paraphraser

Step 3:-Sum of all the values of step 2.
Step 4:- Divide by number of terms (n).
Step 5:- Finally, Square root the result of step 4.
Standard Deviation= √ (xi – μ) 2 / N
= √ (956.1) / 10
= √ 95.61
= 9.78
4. using the linear forecasting model frame the regression equation and calculate the value of m
and c.
Linear Forecasting Model:- It predicts ' future values' based on the 'past values' in a linear
y = mx + c
where, 'y' is the dependent variable
'mx' is the independent variable
'c' is the constant
Steps of Calculating m is :
1. Multiply both the variables X and Y which are named as days and humidity.
2. Do the sum of the above calculation
3. Sum of the x variable and y factor individually.
4. Then multiply both the factors.
5. Calculate ( x)⅀ 2 at the end put the values in the formula.
6. The resultant value is the value of 'm'.
m= 10 (4636) – (55) * (793) / 10 * (385) – (55) 2

m= 46360 – 43615 / 3850 - 3025
m= 2745 / 825
m= 3.33
Steps of calculation value of 'c'
1. First of all calculate the sum of 'y' variable.
2. Then calculate the sum of 'x' variable.
3. Finally divide it with the sum of 'N'.
4. The value derived from Step 3 is the value of 'c'.
c= 793 – 3.33 * (55)
c = 793 – 183.15
c = 609.85
humidity on Day 11 :-
m= 3.33, c= 609.85 x= 11,
y= mx + c
y= 3.33(11) + 609.85
y = 36.63 +
y = 646.48
Humidity on Day 13 :-
m=3.33, c= 609.85, x=13
y= mx+ c
y= 3.33 (13) + 609.85
y= 43.29 + 609.85
y= 653.14
⊘ This is a preview!⊘
Do you want full access?
Subscribe today to unlock all pages.

Trusted by 1+ million students worldwide

CONCLUSION
From the above calculated data it can be concluded that the mean, median and mode are 79.3, 5
and 64/75 respectively. The Range and Standard deviation are 30 and 9.78 respectively. The
value of standard deviation states that the variable deviates more than the mean. The values of
'm' and 'c' derived from the linear forecasting model are 3.33 and 609.85 respectively.
Paraphrase This Document
Need a fresh take? Get an instant paraphrase of this document with our AI Paraphraser

REFERENCES
Books and Journals
Larsen, S.A., Little, C.W. and Coventry, W.L., 2021. Exploring the associations between delayed
school entry and achievement in primary and secondary school. Child Development,
92(2), pp.774-792.
McMaster, H.J., Preston, C., Wang, H. and Perivolarellis, M., 2021. The case for a sub-element
‘measuring matter’within the Australian national numeracy learning progression.
Australian Journal of Education. 65(3). pp.280-298.
Yang, Zhang, Huo, and Zhang, 2020. Differential contributions of cognitive precursors to
symbolic versus non-symbolic numeracy in young Chinese children. Early Childhood
Research Quarterly. 53. pp.208-216.
Logan, 2020. A practical, iterative framework for secondary data analysis in educational
research. The Australian Educational Researcher. 47(1). pp.129-148.
1 out of 8
Related Documents

Your All-in-One AI-Powered Toolkit for Academic Success.
+13062052269
info@desklib.com
Available 24*7 on WhatsApp / Email
Unlock your academic potential
Copyright © 2020–2025 A2Z Services. All Rights Reserved. Developed and managed by ZUCOL.