BABS Foundation Level Numeracy and Data Analysis Report: Forecasting

Verified

Added on  2023/01/16

|11
|1575
|49
Report
AI Summary
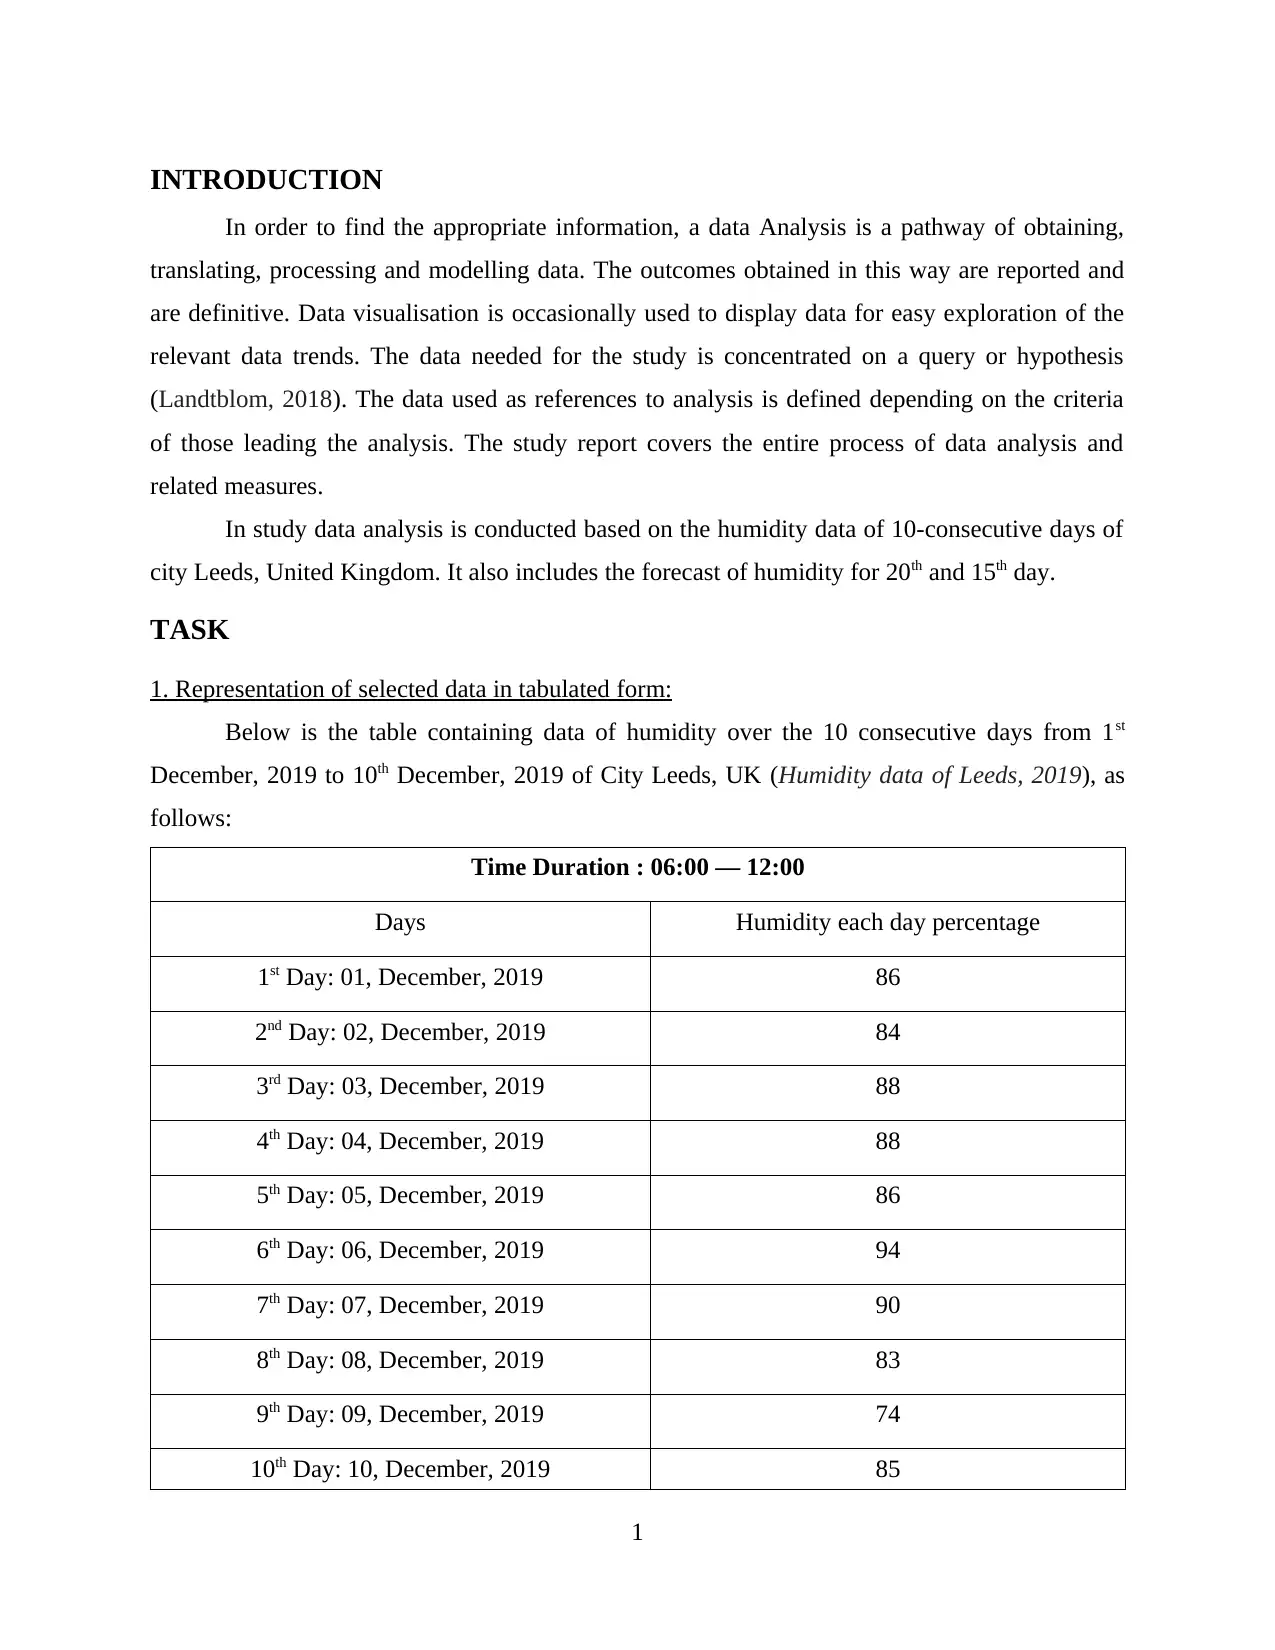
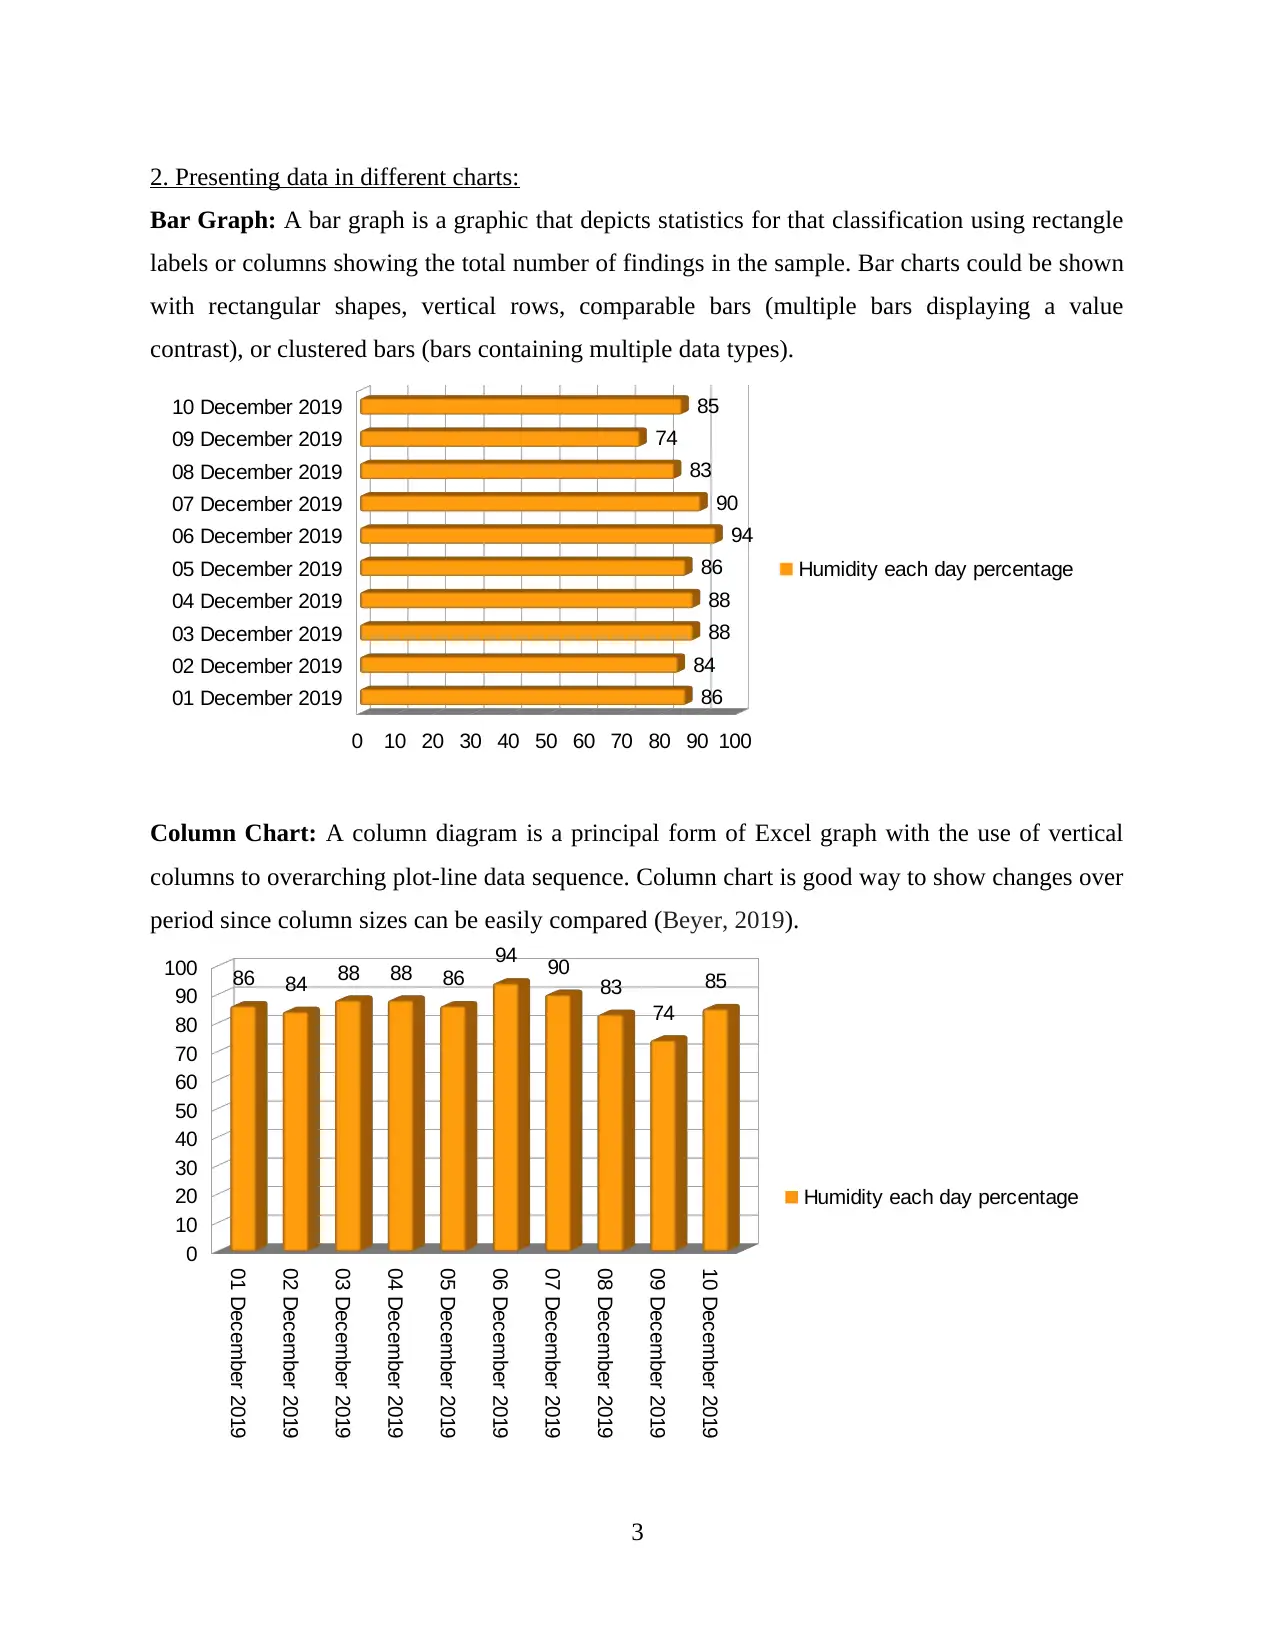
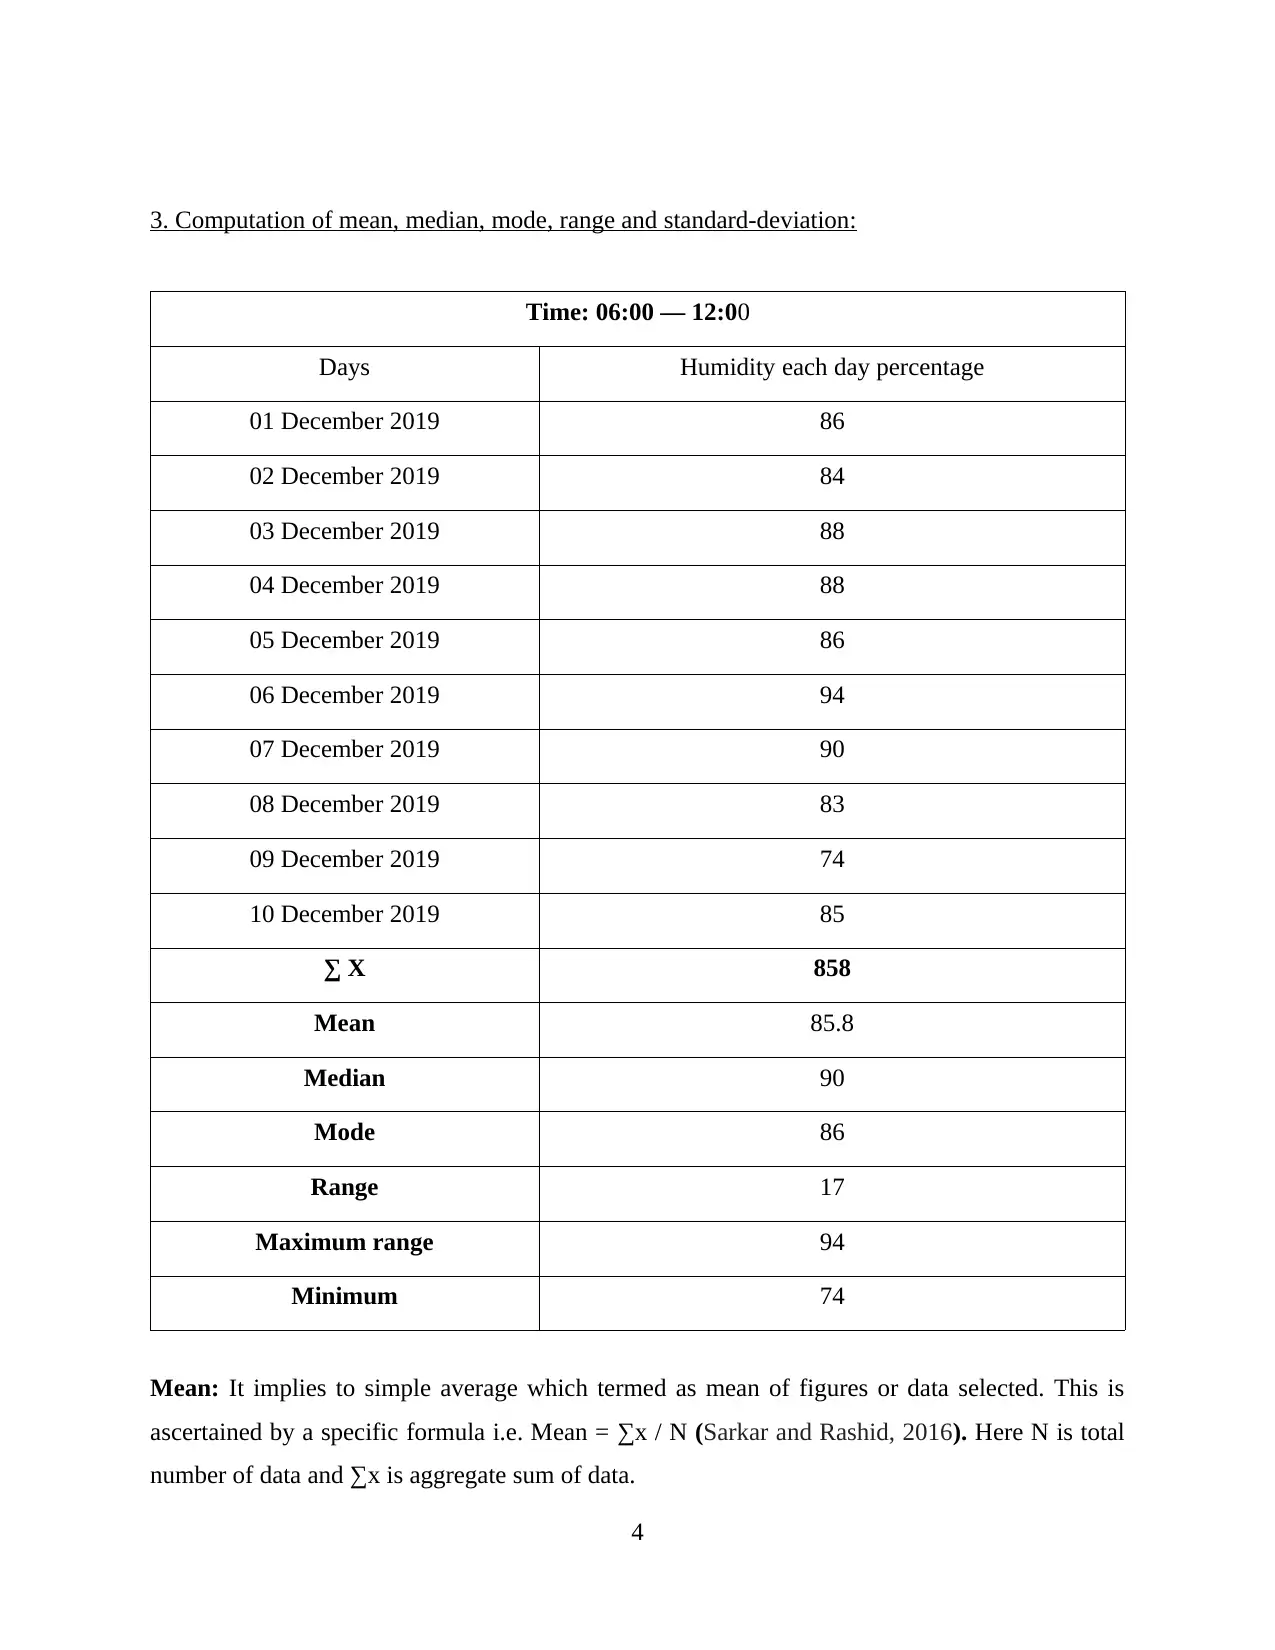
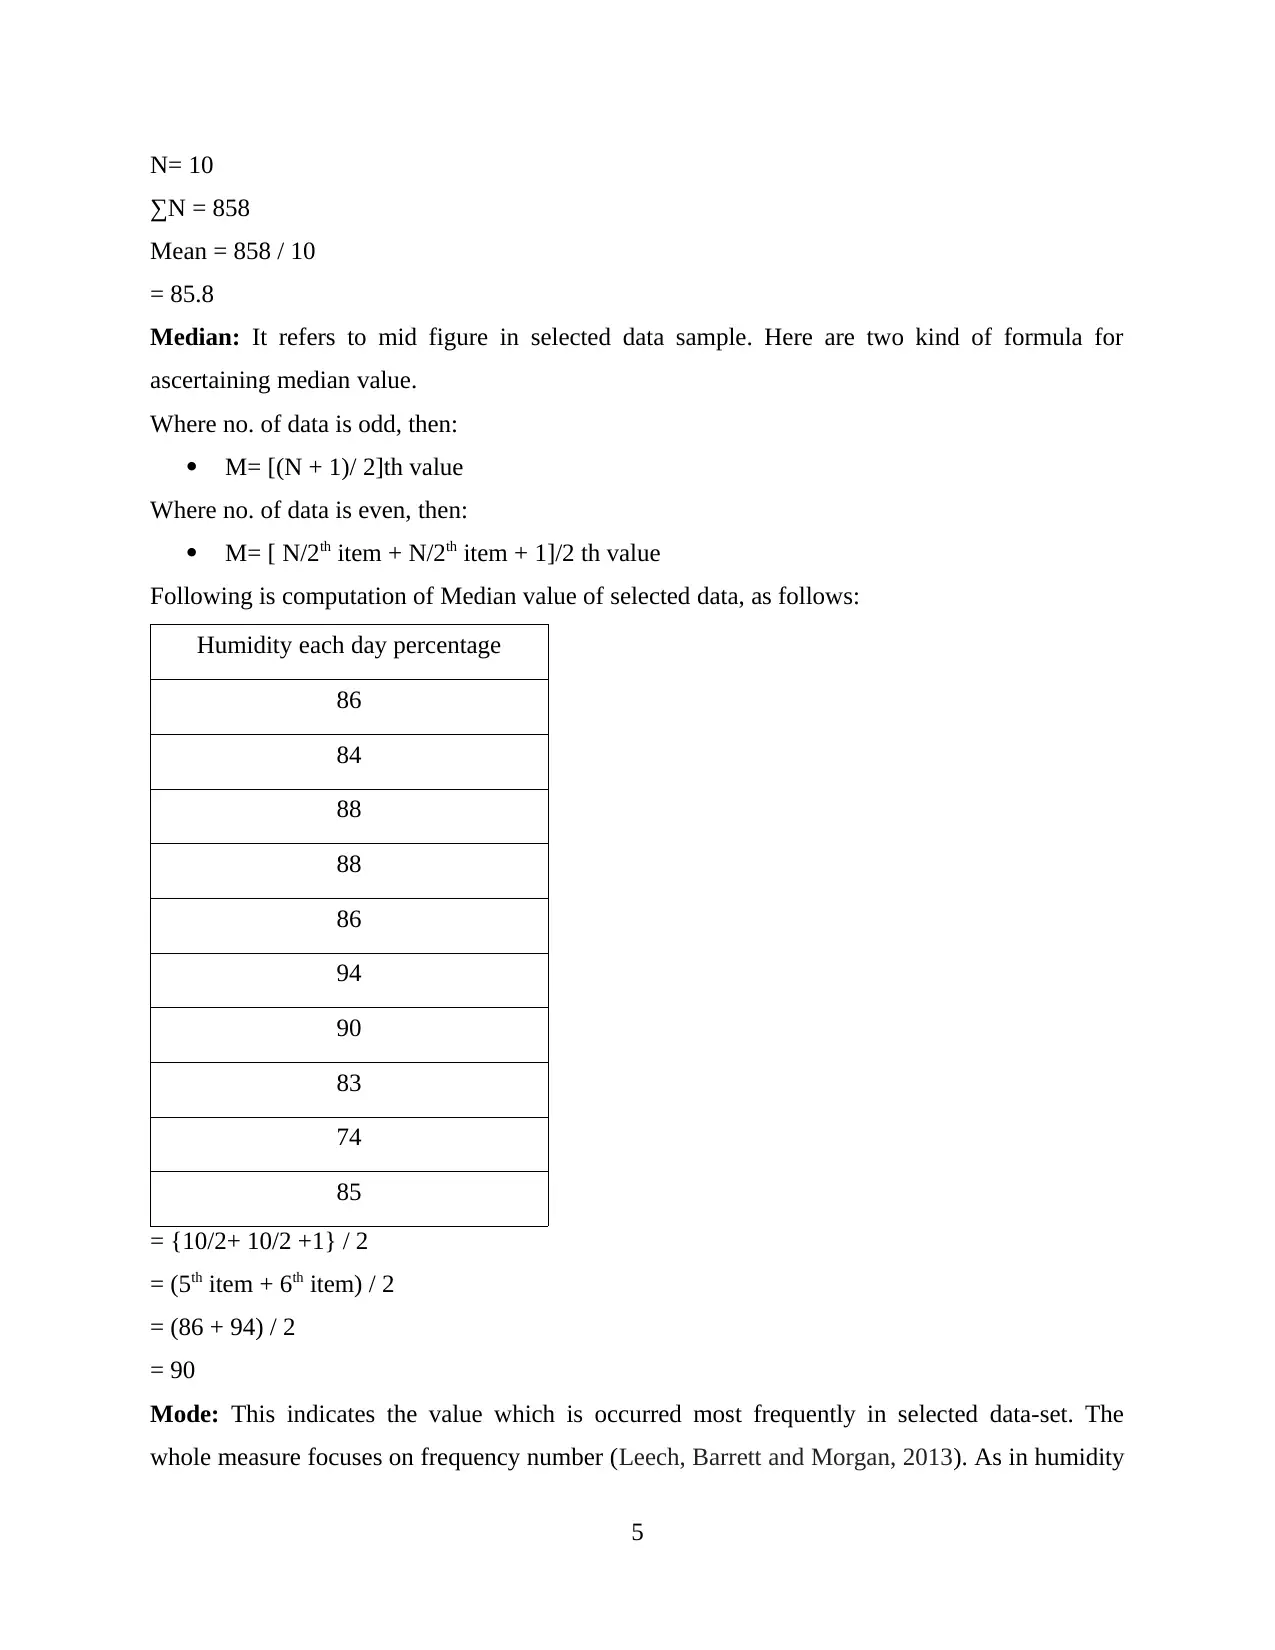
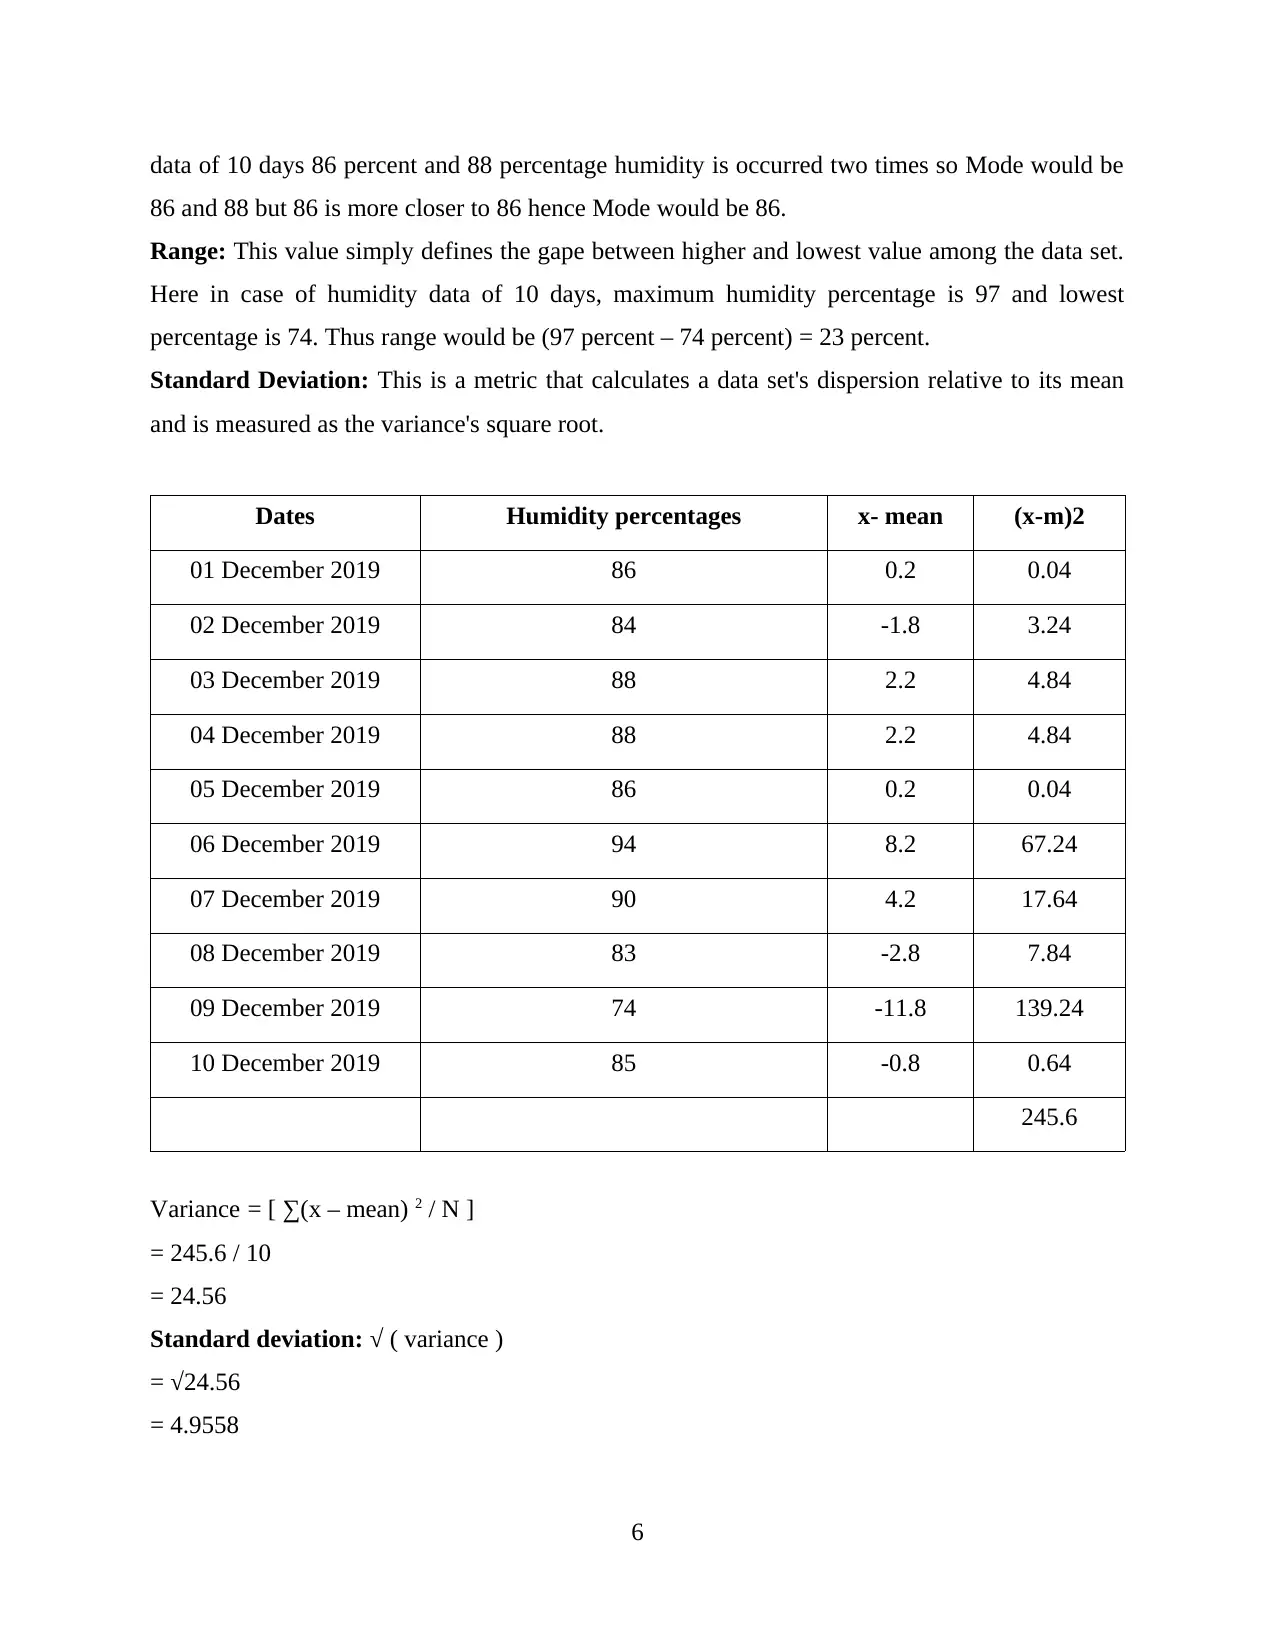
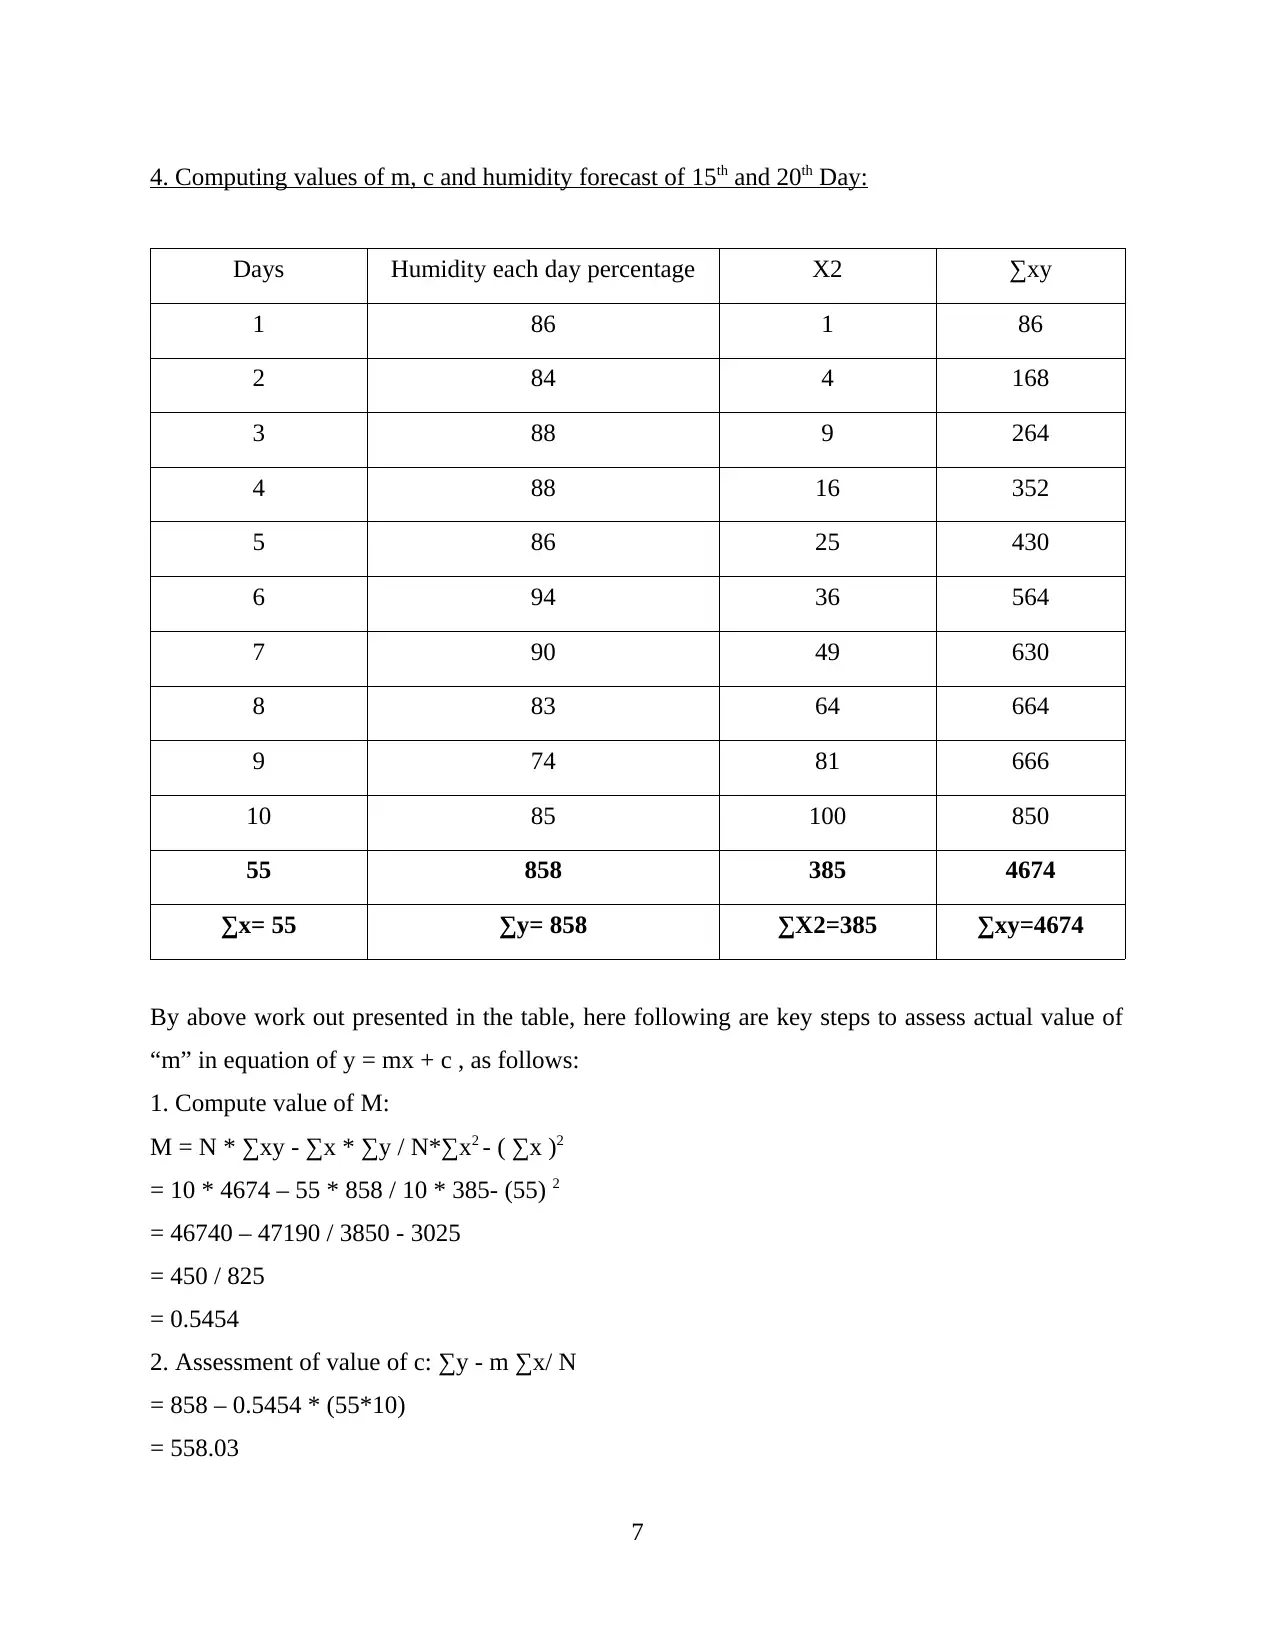
This report provides a detailed analysis of humidity data for Leeds, UK, over a ten-day period in December 2019. The analysis begins with the representation of the data in a tabulated form, followed by its visualization using bar and column charts. The report then computes key statistical measures, including the mean, median, mode, range, and standard deviation, to provide a comprehensive understanding of the data's characteristics. Furthermore, the report delves into forecasting, computing the values of 'm' and 'c' in a linear equation to predict humidity levels for the 15th and 20th days. The conclusion summarizes the importance of data analysis and forecasting in providing comprehensive insights and supporting predictive models. The report uses referenced data and statistical methods to analyze the data provided.
tabler-icon-diamond-filled.svg

Contribute Materials

Your contribution can guide someone’s learning journey. Share your documents today.
Document Page
Numeracy
And
Data Analysis
tabler-icon-diamond-filled.svg

Secure Best Marks with AI Grader

Need help grading? Try our AI Grader for instant feedback on your assignments.
Document Page
Table of Contents
INTRODUCTION...........................................................................................................................1
TASK...............................................................................................................................................1
1. Representation of selected data in tabulated form:..................................................................1
2. Presenting data in different charts:..........................................................................................2
3. Computation of mean, median, mode, range and standard-deviation:....................................3
4. Computing values of m, c and humidity forecast of 15th and 20th Day:................................6
CONCLUSION................................................................................................................................7
REFERENCES................................................................................................................................8
Document Page
INTRODUCTION
In order to find the appropriate information, a data Analysis is a pathway of obtaining,
translating, processing and modelling data. The outcomes obtained in this way are reported and
are definitive. Data visualisation is occasionally used to display data for easy exploration of the
relevant data trends. The data needed for the study is concentrated on a query or hypothesis
(Landtblom, 2018). The data used as references to analysis is defined depending on the criteria
of those leading the analysis. The study report covers the entire process of data analysis and
related measures.
In study data analysis is conducted based on the humidity data of 10-consecutive days of
city Leeds, United Kingdom. It also includes the forecast of humidity for 20th and 15th day.
TASK
1. Representation of selected data in tabulated form:
Below is the table containing data of humidity over the 10 consecutive days from 1st
December, 2019 to 10th December, 2019 of City Leeds, UK (Humidity data of Leeds, 2019), as
follows:
Time Duration : 06:00 — 12:00
Days Humidity each day percentage
1st Day: 01, December, 2019 86
2nd Day: 02, December, 2019 84
3rd Day: 03, December, 2019 88
4th Day: 04, December, 2019 88
5th Day: 05, December, 2019 86
6th Day: 06, December, 2019 94
7th Day: 07, December, 2019 90
8th Day: 08, December, 2019 83
9th Day: 09, December, 2019 74
10th Day: 10, December, 2019 85
1
Document Page
2
tabler-icon-diamond-filled.svg

Secure Best Marks with AI Grader

Need help grading? Try our AI Grader for instant feedback on your assignments.
Document Page
2. Presenting data in different charts:
Bar Graph: A bar graph is a graphic that depicts statistics for that classification using rectangle
labels or columns showing the total number of findings in the sample. Bar charts could be shown
with rectangular shapes, vertical rows, comparable bars (multiple bars displaying a value
contrast), or clustered bars (bars containing multiple data types).
Column Chart: A column diagram is a principal form of Excel graph with the use of vertical
columns to overarching plot-line data sequence. Column chart is good way to show changes over
period since column sizes can be easily compared (Beyer, 2019).
3
01 December 2019
02 December 2019
03 December 2019
04 December 2019
05 December 2019
06 December 2019
07 December 2019
08 December 2019
09 December 2019
10 December 2019
0 10 20 30 40 50 60 70 80 90 100
86
84
88
88
86
94
90
83
74
85
Humidity each day percentage
01 December 2019
02 December 2019
03 December 2019
04 December 2019
05 December 2019
06 December 2019
07 December 2019
08 December 2019
09 December 2019
10 December 2019
0
10
20
30
40
50
60
70
80
90
100 86 84 88 88 86
94 90 83
74
85
Humidity each day percentage
Document Page
3. Computation of mean, median, mode, range and standard-deviation:
Time: 06:00 — 12:00
Days Humidity each day percentage
01 December 2019 86
02 December 2019 84
03 December 2019 88
04 December 2019 88
05 December 2019 86
06 December 2019 94
07 December 2019 90
08 December 2019 83
09 December 2019 74
10 December 2019 85
X 858
Mean 85.8
Median 90
Mode 86
Range 17
Maximum range 94
Minimum 74
Mean: It implies to simple average which termed as mean of figures or data selected. This is
ascertained by a specific formula i.e. Mean = ∑x / N (Sarkar and Rashid, 2016). Here N is total
number of data and ∑x is aggregate sum of data.
4
Document Page
N= 10
∑N = 858
Mean = 858 / 10
= 85.8
Median: It refers to mid figure in selected data sample. Here are two kind of formula for
ascertaining median value.
Where no. of data is odd, then:
M= [(N + 1)/ 2]th value
Where no. of data is even, then:
M= [ N/2th item + N/2th item + 1]/2 th value
Following is computation of Median value of selected data, as follows:
Humidity each day percentage
86
84
88
88
86
94
90
83
74
85
= {10/2+ 10/2 +1} / 2
= (5th item + 6th item) / 2
= (86 + 94) / 2
= 90
Mode: This indicates the value which is occurred most frequently in selected data-set. The
whole measure focuses on frequency number (Leech, Barrett and Morgan, 2013). As in humidity
5
tabler-icon-diamond-filled.svg

Paraphrase This Document

Need a fresh take? Get an instant paraphrase of this document with our AI Paraphraser
Document Page
data of 10 days 86 percent and 88 percentage humidity is occurred two times so Mode would be
86 and 88 but 86 is more closer to 86 hence Mode would be 86.
Range: This value simply defines the gape between higher and lowest value among the data set.
Here in case of humidity data of 10 days, maximum humidity percentage is 97 and lowest
percentage is 74. Thus range would be (97 percent – 74 percent) = 23 percent.
Standard Deviation: This is a metric that calculates a data set's dispersion relative to its mean
and is measured as the variance's square root.
Dates Humidity percentages x- mean (x-m)2
01 December 2019 86 0.2 0.04
02 December 2019 84 -1.8 3.24
03 December 2019 88 2.2 4.84
04 December 2019 88 2.2 4.84
05 December 2019 86 0.2 0.04
06 December 2019 94 8.2 67.24
07 December 2019 90 4.2 17.64
08 December 2019 83 -2.8 7.84
09 December 2019 74 -11.8 139.24
10 December 2019 85 -0.8 0.64
245.6
Variance = [ ∑(x – mean) 2 / N ]
= 245.6 / 10
= 24.56
Standard deviation: √ ( variance )
= √24.56
= 4.9558
6
Document Page
4. Computing values of m, c and humidity forecast of 15th and 20th Day:
Days Humidity each day percentage X2 ∑xy
1 86 1 86
2 84 4 168
3 88 9 264
4 88 16 352
5 86 25 430
6 94 36 564
7 90 49 630
8 83 64 664
9 74 81 666
10 85 100 850
55 858 385 4674
∑x= 55 ∑y= 858 ∑X2=385 ∑xy=4674
By above work out presented in the table, here following are key steps to assess actual value of
“m” in equation of y = mx + c , as follows:
1. Compute value of M:
M = N * ∑xy - ∑x * ∑y / N*∑x2 - ( ∑x )2
= 10 * 4674 – 55 * 858 / 10 * 385- (55) 2
= 46740 – 47190 / 3850 - 3025
= 450 / 825
= 0.5454
2. Assessment of value of c: ∑y - m ∑x/ N
= 858 – 0.5454 * (55*10)
= 558.03
7
Document Page
3. Through above computed/assessed data, prediction of humidity has been done here, as follows
Forecast humidity for 15 day Y= mx+c
Y= 0.5454 * 15 + 558.03
= 566.211
= 56.62%
Forecast humidity for 20 day Y= mx+c
= 0.5454 * 20 + 558.03
= 568.938
= 56.89%
CONCLUSION
From above report it has been concluded that data analysis is wider aspect which
provides comprehensive details about any selected data set. It also combines different techniques
to evaluate the outcomes and findings. Moreover this supports forecasting model and help to
make precise forecast.
8
tabler-icon-diamond-filled.svg

Secure Best Marks with AI Grader

Need help grading? Try our AI Grader for instant feedback on your assignments.
Document Page
REFERENCES
Books and Journals:
Beyer, W. H., 2019. Handbook of tables for probability and statistics. Crc Press.
Landtblom, K. K., 2018. Prospective Teachers’ Conceptions of the Concepts Mean, Median and
Mode. In Students' and Teachers' Values, Attitudes, Feelings and Beliefs in
Mathematics Classrooms (pp. 43-52). Springer, Cham.
Leech, N., Barrett, K. and Morgan, G. A., 2013. SPSS for intermediate statistics: Use and
interpretation. Routledge.
Sarkar, J. and Rashid, M., 2016. Visualizing mean, median, mean deviation, and standard
deviation of a set of numbers. The American Statistician. 70(3). pp.304-312.
Online
Humidity data of Leeds. 2019. [Online]. Available through:
<https://www.timeanddate.com/weather/uk/leeds/historic?month=12&year=2019>
9
chevron_up_icon
1 out of 11
circle_padding
hide_on_mobile
zoom_out_icon
logo.png

Your All-in-One AI-Powered Toolkit for Academic Success.

Available 24*7 on WhatsApp / Email

[object Object]