Numeracy and Data Analysis Report: Foundation Year, Level 0

Verified

Added on  2023/06/10

|11
|649
|497
Report
AI Summary
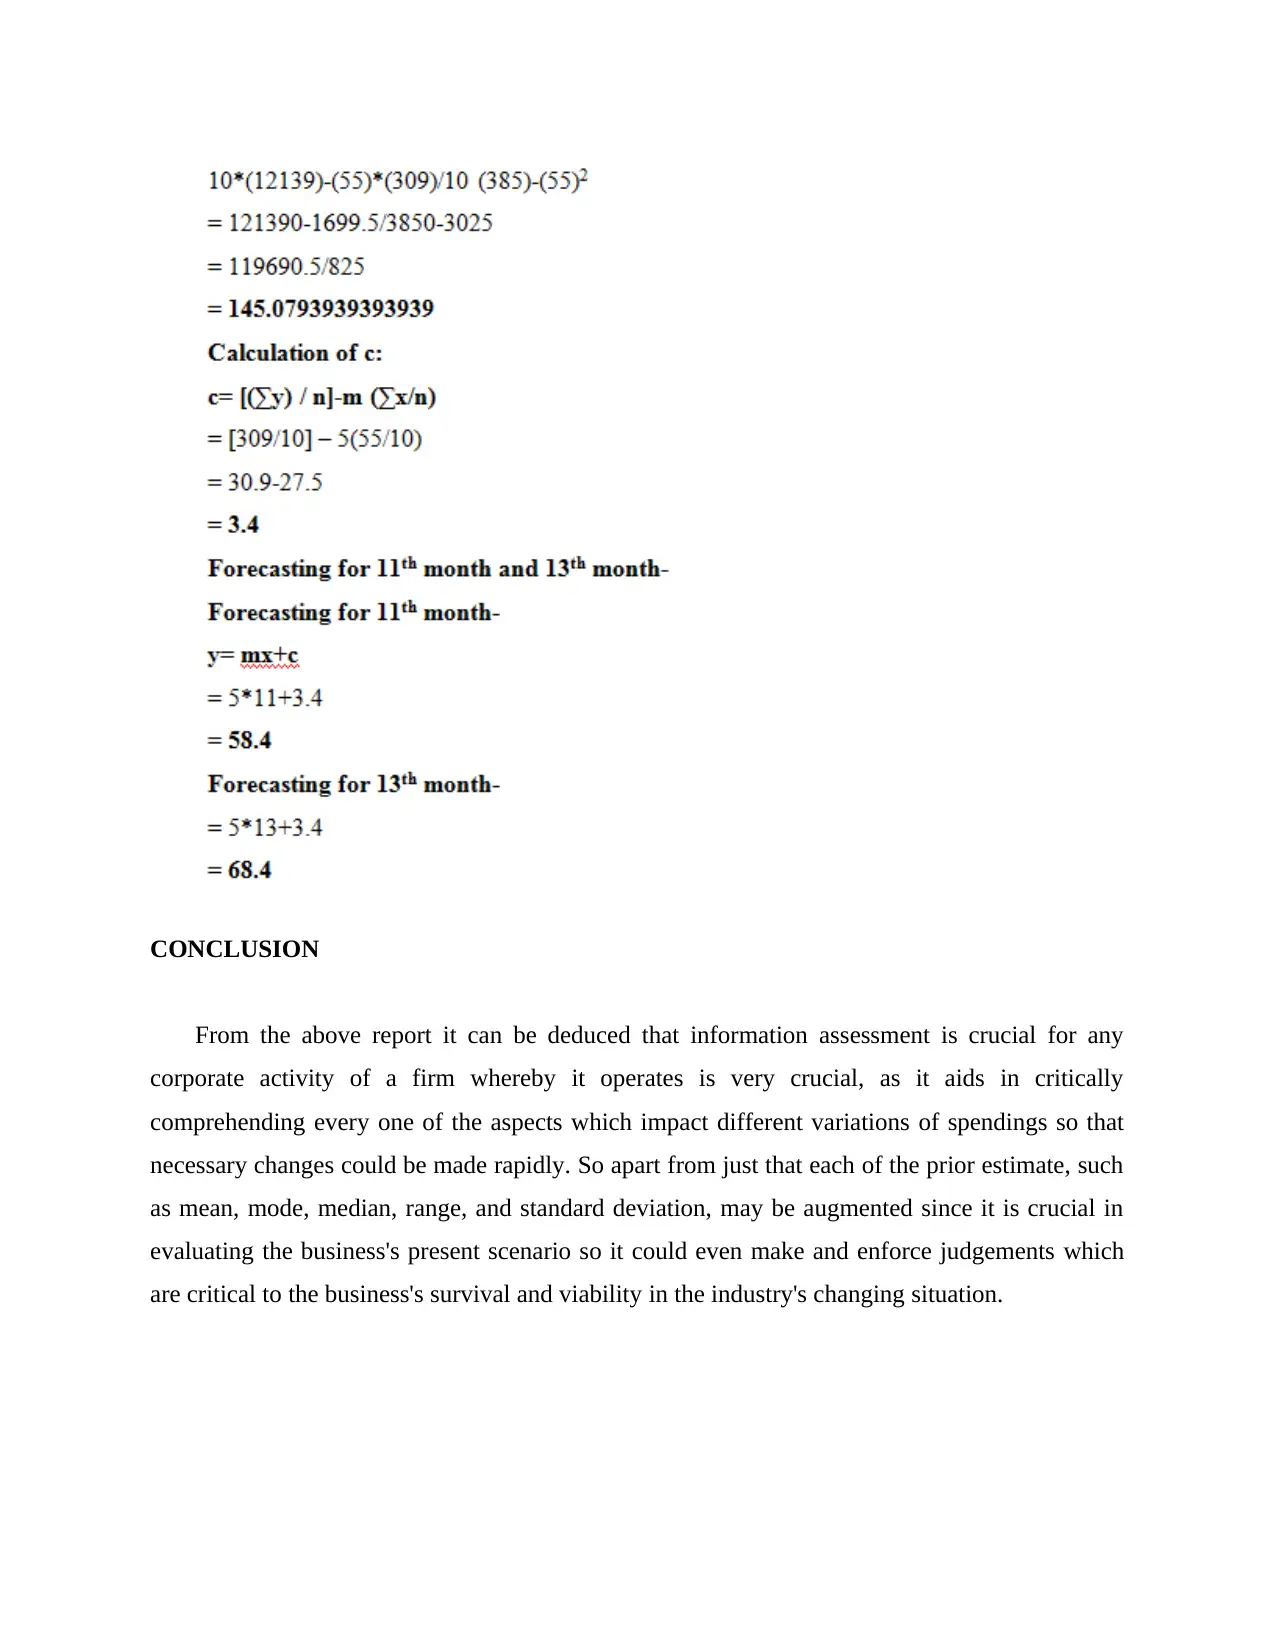
This report, prepared for a Foundation Year module in Numeracy and Data Analysis within a BA (Hons) Business Studies program, presents a comprehensive analysis of data and its application to business contexts. The report begins with an introduction to research methodology and its importance in assessing corporate performance. The main body of the report includes an examination of different data visualization techniques, such as column and line charts, and their use in presenting information. It then delves into various statistical concepts, including mean, mode, range, and standard deviation, explaining their significance in data analysis. The conclusion emphasizes the critical role of data assessment in understanding business operations and making informed decisions, highlighting how the techniques discussed can aid in evaluating a company's current state and forecasting future trends. The report references several academic sources to support its analysis.
Document Page
Numeracy and data
analysis
tabler-icon-diamond-filled.svg

Paraphrase This Document

Need a fresh take? Get an instant paraphrase of this document with our AI Paraphraser
Document Page
Contents
Contents...........................................................................................................................................2
INTRODUCTION...........................................................................................................................1
MAIN BODY..................................................................................................................................1
1...................................................................................................................................................1
2...................................................................................................................................................1
3...................................................................................................................................................2
4...................................................................................................................................................6
CONCLUSION................................................................................................................................7
REFERENCES................................................................................................................................8
Document Page
Document Page
INTRODUCTION
Research methodology are some of the most critical elements because it aids in assessing
corporate performance so that it can help in the in the activities in the long run and thus can aid
in the overall development (Espinosa-Oviedo, 2020). The report below includes data that have
rationally formed and made in groups with a variety of graphs. Aside from that, the study
predicts the mean, average, ideal, variance, limitation, quadratic returns forecast, and total
expenses for the 11th and 13th days.
MAIN BODY
1.
2
Column chart- it is a vertical presentation of the bars so that all the data can be seen and
thoroughly understood in detail.
tabler-icon-diamond-filled.svg

Paraphrase This Document

Need a fresh take? Get an instant paraphrase of this document with our AI Paraphraser
Document Page
Line chart- A line diagram is a visual depiction of information which is made up of lines
which are connected by a single path. Based on the information getting investigated, the path
could be rigid or flexible (Liu and Heer, 2018). Line graphs are the most basic way of showing
numerical information among multiple factors with the use of a line which could be flat or bent.
3
Mean- It is the average of all the numbers.
Document Page
Mode- A statistic or a quantity that comes more often in a collection is referred to mode.
In certain instances, we determine the mode for the provided collection of statistics. A significant
number may or not exist for a particular group of information (Metzenbaum, 2018). There may
be no mode at all for information with no repeated numbers.
Document Page
Range- Lowest and the highest value difference is called range.
tabler-icon-diamond-filled.svg

Paraphrase This Document

Need a fresh take? Get an instant paraphrase of this document with our AI Paraphraser
Document Page
Standard deviation- The significant square root of the variation is known as the standard
deviation of that given series of data. Amongst the basic and fundamental approaches of
quantitative tests is standard deviation (Sultan, 2020).
Document Page
4
Document Page
CONCLUSION
From the above report it can be deduced that information assessment is crucial for any
corporate activity of a firm whereby it operates is very crucial, as it aids in critically
comprehending every one of the aspects which impact different variations of spendings so that
necessary changes could be made rapidly. So apart from just that each of the prior estimate, such
as mean, mode, median, range, and standard deviation, may be augmented since it is crucial in
evaluating the business's present scenario so it could even make and enforce judgements which
are critical to the business's survival and viability in the industry's changing situation.
tabler-icon-diamond-filled.svg

Paraphrase This Document

Need a fresh take? Get an instant paraphrase of this document with our AI Paraphraser
Document Page
REFERENCES
Books and journals
Espinosa-Oviedo, J.A., 2020. Enacting Data Science Pipelines for Exploring Graphs: From
Libraries to Studios. In ADBIS, TPDL and EDA 2020 Common Workshops and
Doctoral Consortium: International Workshops: DOING, MADEISD, SKG, BBIGAP,
SIMPDA, AIMinScience 2020 and Doctoral Consortium, Lyon, France, August 25-27,
2020, Proceedings (Vol. 1260, p. 271). Springer Nature.
Liu, Y. and Heer, J., 2018, April. Somewhere over the rainbow: An empirical assessment of
quantitative colormaps. In Proceedings of the 2018 CHI Conference on Human Factors
in Computing Systems (pp. 1-12).
Metzenbaum, S.H., 2018. CHAPTER SIXTEEN The Future of Data and Analytics. Government
for the Future: Reflection and Vision for Tomorrow's Leaders, p.241.
Sultan, J.B., 2020. Characteristics of remedial students in learning numeracy and programs that
enhance the achievement.
chevron_up_icon
1 out of 11
circle_padding
hide_on_mobile
zoom_out_icon
[object Object]