Comprehensive Report on Numeracy and Data Analysis Methods

Verified

Added on  2023/06/18

|6
|1144
|457
Report
AI Summary
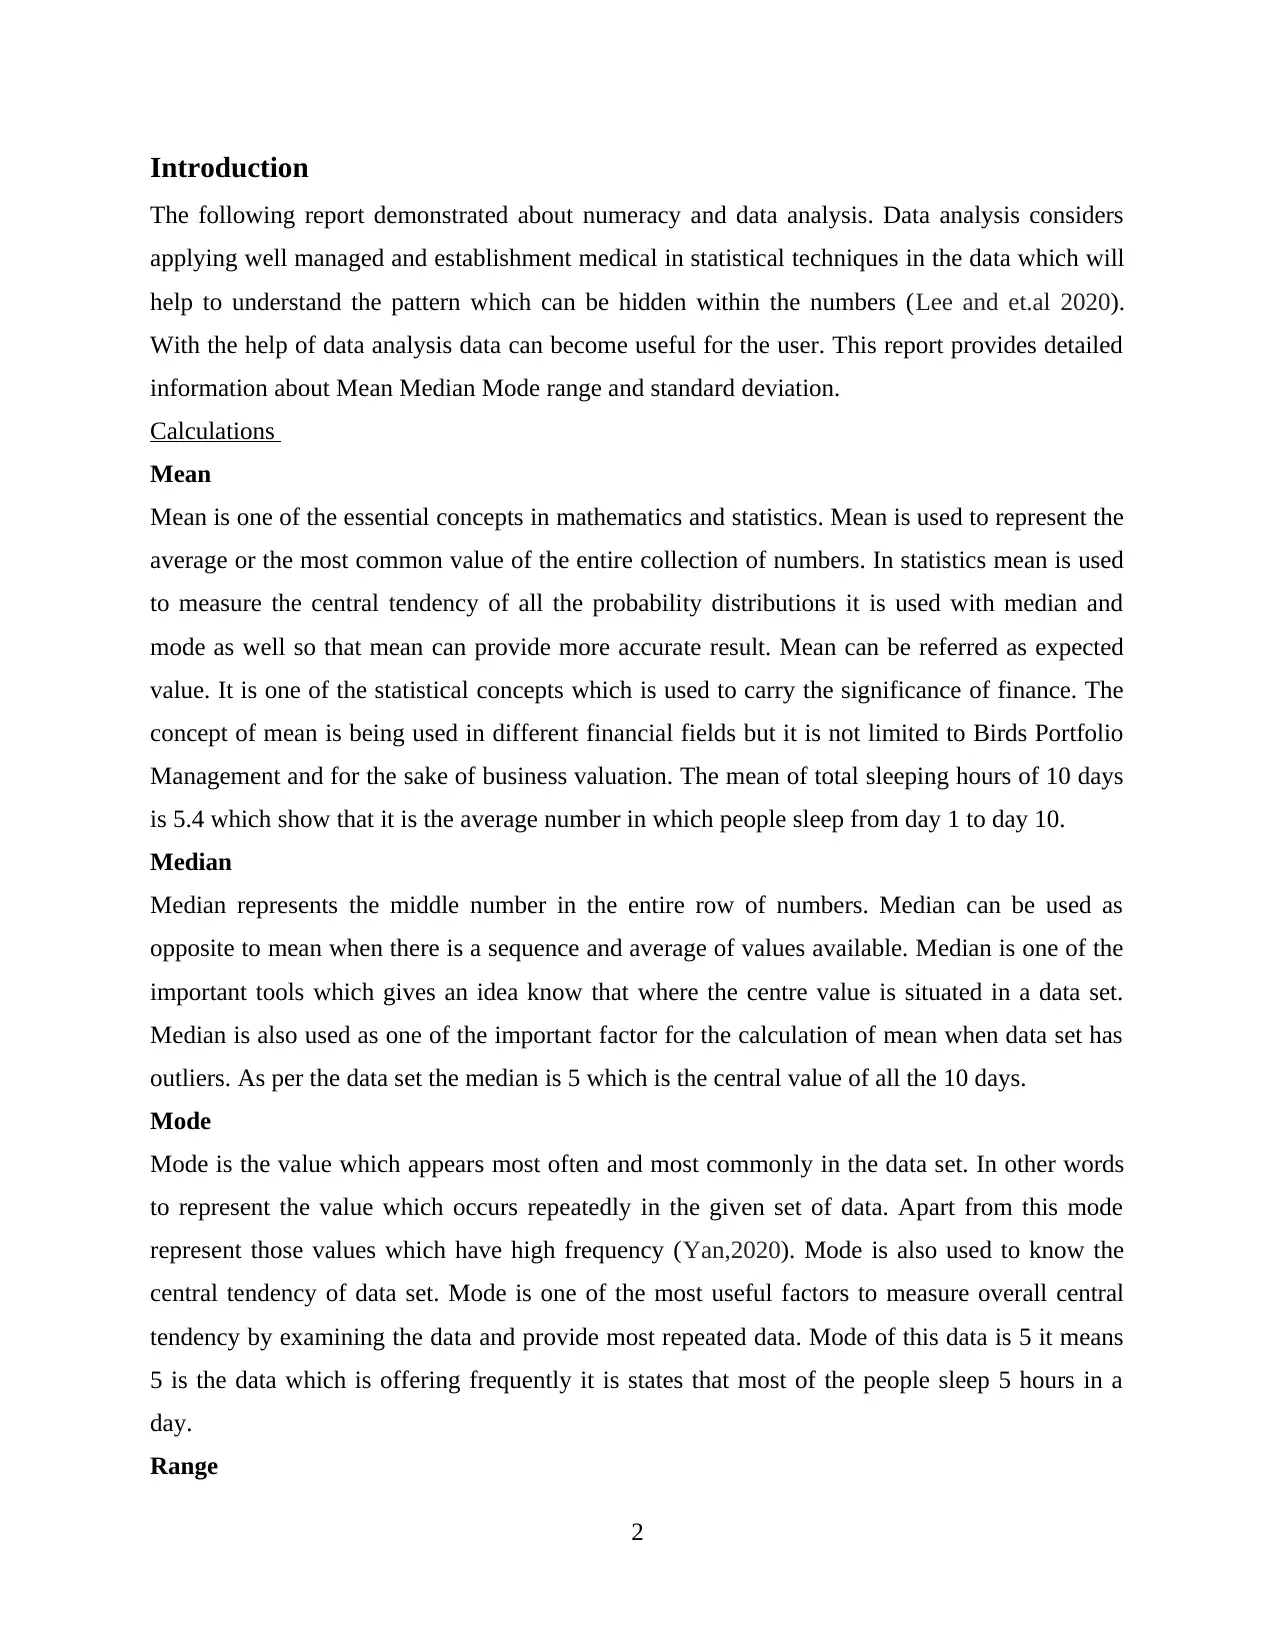
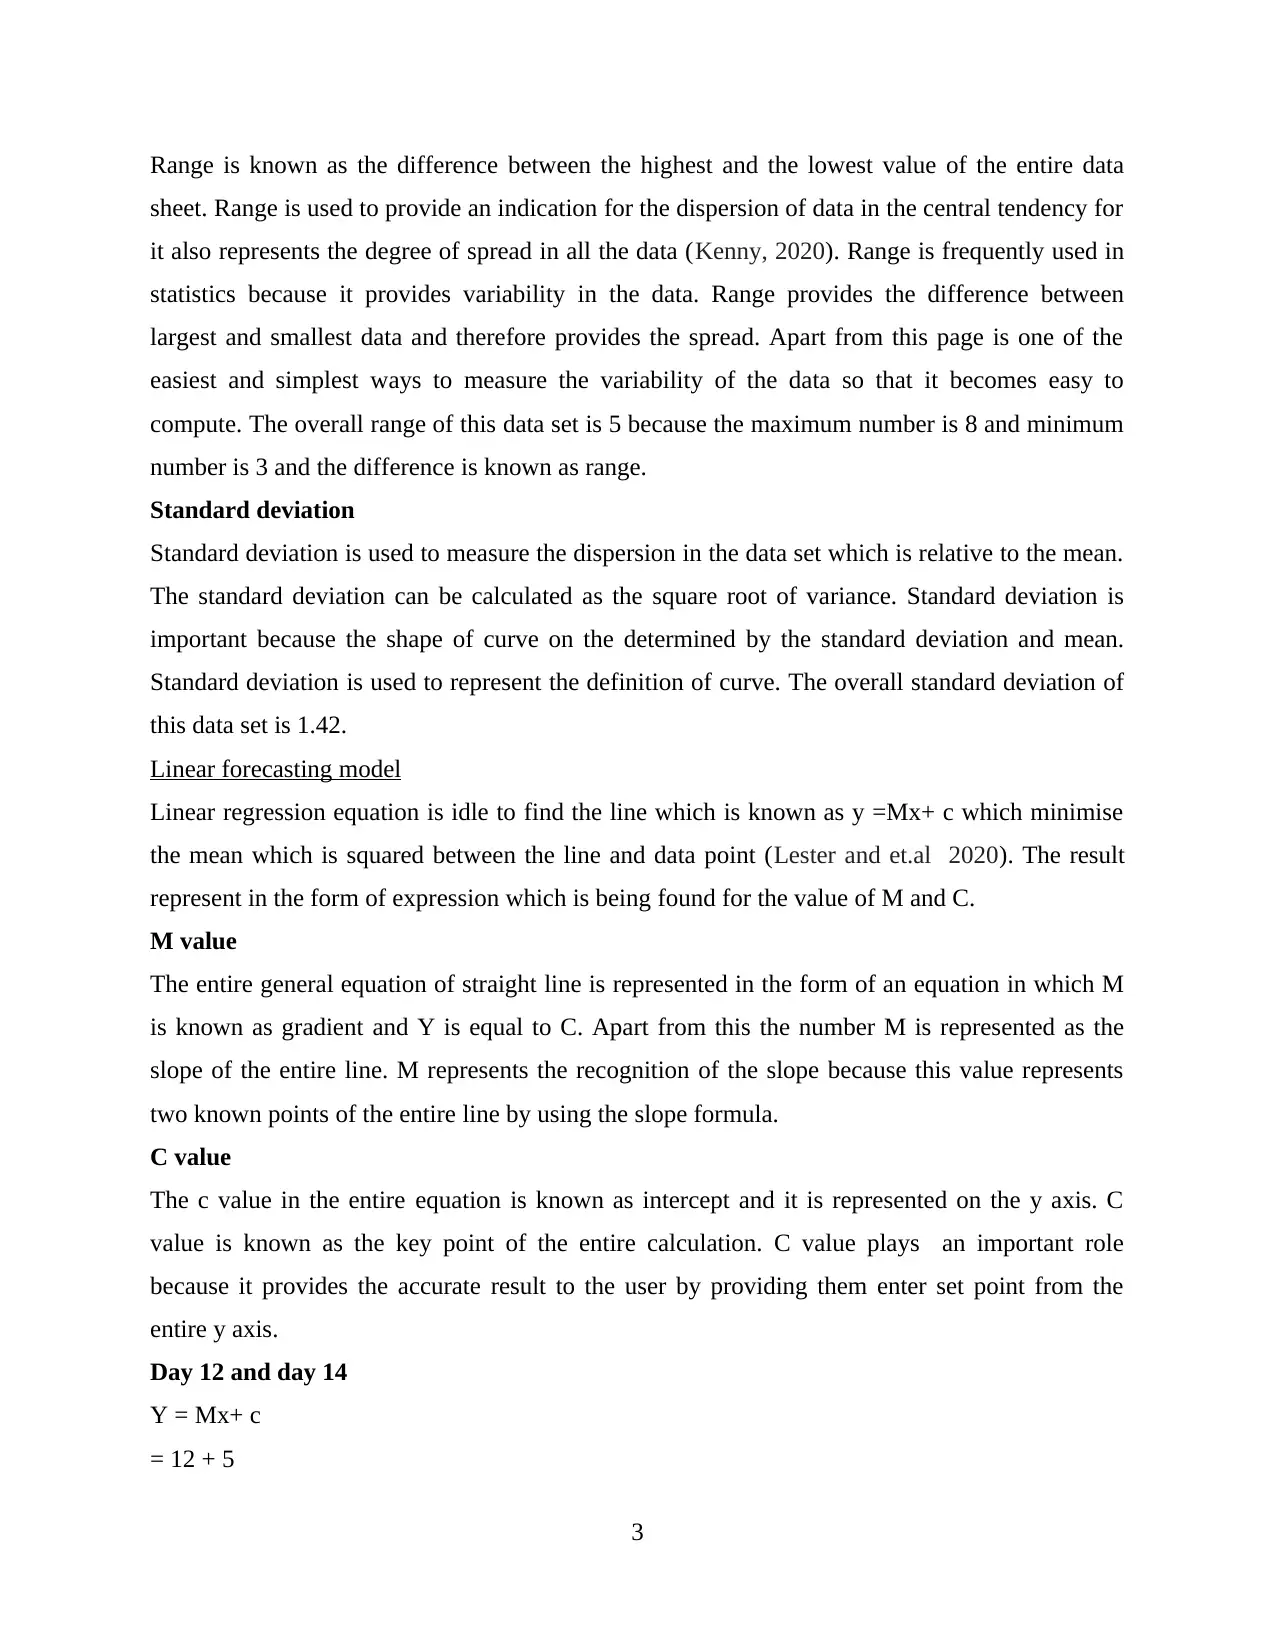
This report provides a detailed exploration of numeracy and data analysis techniques, focusing on the application of statistical methods to uncover hidden patterns within data. It covers essential concepts such as mean, median, mode, range, and standard deviation, explaining their significance in data interpretation. Furthermore, the report delves into linear forecasting models, elaborating on the calculation and importance of 'M' and 'C' values in linear regression equations. The analysis demonstrates how these statistical tools are valuable for companies and users in making informed decisions. The report concludes by emphasizing the importance of understanding these concepts for accurate data-driven insights.
Document Page
Numeracy and Data Analysis
tabler-icon-diamond-filled.svg

Paraphrase This Document

Need a fresh take? Get an instant paraphrase of this document with our AI Paraphraser
Document Page
Table of Contents
Introduction......................................................................................................................................2
Calculations.................................................................................................................................2
Linear forecasting model.............................................................................................................3
Conclusion.......................................................................................................................................4
References........................................................................................................................................5
1
Document Page
Introduction
The following report demonstrated about numeracy and data analysis. Data analysis considers
applying well managed and establishment medical in statistical techniques in the data which will
help to understand the pattern which can be hidden within the numbers (Lee and et.al 2020).
With the help of data analysis data can become useful for the user. This report provides detailed
information about Mean Median Mode range and standard deviation.
Calculations
Mean
Mean is one of the essential concepts in mathematics and statistics. Mean is used to represent the
average or the most common value of the entire collection of numbers. In statistics mean is used
to measure the central tendency of all the probability distributions it is used with median and
mode as well so that mean can provide more accurate result. Mean can be referred as expected
value. It is one of the statistical concepts which is used to carry the significance of finance. The
concept of mean is being used in different financial fields but it is not limited to Birds Portfolio
Management and for the sake of business valuation. The mean of total sleeping hours of 10 days
is 5.4 which show that it is the average number in which people sleep from day 1 to day 10.
Median
Median represents the middle number in the entire row of numbers. Median can be used as
opposite to mean when there is a sequence and average of values available. Median is one of the
important tools which gives an idea know that where the centre value is situated in a data set.
Median is also used as one of the important factor for the calculation of mean when data set has
outliers. As per the data set the median is 5 which is the central value of all the 10 days.
Mode
Mode is the value which appears most often and most commonly in the data set. In other words
to represent the value which occurs repeatedly in the given set of data. Apart from this mode
represent those values which have high frequency (Yan,2020). Mode is also used to know the
central tendency of data set. Mode is one of the most useful factors to measure overall central
tendency by examining the data and provide most repeated data. Mode of this data is 5 it means
5 is the data which is offering frequently it is states that most of the people sleep 5 hours in a
day.
Range
2
Document Page
Range is known as the difference between the highest and the lowest value of the entire data
sheet. Range is used to provide an indication for the dispersion of data in the central tendency for
it also represents the degree of spread in all the data (Kenny, 2020). Range is frequently used in
statistics because it provides variability in the data. Range provides the difference between
largest and smallest data and therefore provides the spread. Apart from this page is one of the
easiest and simplest ways to measure the variability of the data so that it becomes easy to
compute. The overall range of this data set is 5 because the maximum number is 8 and minimum
number is 3 and the difference is known as range.
Standard deviation
Standard deviation is used to measure the dispersion in the data set which is relative to the mean.
The standard deviation can be calculated as the square root of variance. Standard deviation is
important because the shape of curve on the determined by the standard deviation and mean.
Standard deviation is used to represent the definition of curve. The overall standard deviation of
this data set is 1.42.
Linear forecasting model
Linear regression equation is idle to find the line which is known as y =Mx+ c which minimise
the mean which is squared between the line and data point (Lester and et.al 2020). The result
represent in the form of expression which is being found for the value of M and C.
M value
The entire general equation of straight line is represented in the form of an equation in which M
is known as gradient and Y is equal to C. Apart from this the number M is represented as the
slope of the entire line. M represents the recognition of the slope because this value represents
two known points of the entire line by using the slope formula.
C value
The c value in the entire equation is known as intercept and it is represented on the y axis. C
value is known as the key point of the entire calculation. C value plays an important role
because it provides the accurate result to the user by providing them enter set point from the
entire y axis.
Day 12 and day 14
Y = Mx+ c
= 12 + 5
3
tabler-icon-diamond-filled.svg

Paraphrase This Document

Need a fresh take? Get an instant paraphrase of this document with our AI Paraphraser
Document Page
= 17
=14 + 6
=20
Conclusion
After analysing the entire report has been concluded that this report focuses on numeracy and
data analysis so that users get accurate data and information. This report provides detailed
information about mean mode median and how this information is valuable for the company as
well as for the user is also being explained in this report. Apart from this standard deviation and
range has also been mentioned in this report and how these two are very important is also being
identified in this report. Along with this year forecasting model has been elaborated in this report
and how calculation of M value and C value is being done has been described in this report as
well.
4
Document Page
References
Books and Journal
Kenny, D.A., Kashy, D.A. and Cook, W.L., 2020. Dyadic data analysis. Guilford Publications.
Lee, J. and Hwang, D., 2020. Single-cell multiomics: technologies and data analysis
methods. Experimental & Molecular Medicine. 52(9). pp.1428-1442.
Lester, J.N., Cho, Y. and Lochmiller, C.R., 2020. Learning to do qualitative data analysis: A
starting point. Human Resource Development Review,.19(1). pp.94-106.
Yan, F., Powell, D.R., Curtis, D.J. and Wong, N.C., 2020. From reads to insight: a hitchhiker’s
guide to ATAC-seq data analysis. Genome biology.21(1).pp.1-16.
5
chevron_up_icon
1 out of 6
circle_padding
hide_on_mobile
zoom_out_icon
[object Object]