Numeracy & Data Analysis: Statistical Tools & Linear Prediction
VerifiedAdded on 2023/06/13
|11
|1446
|93
Report
AI Summary
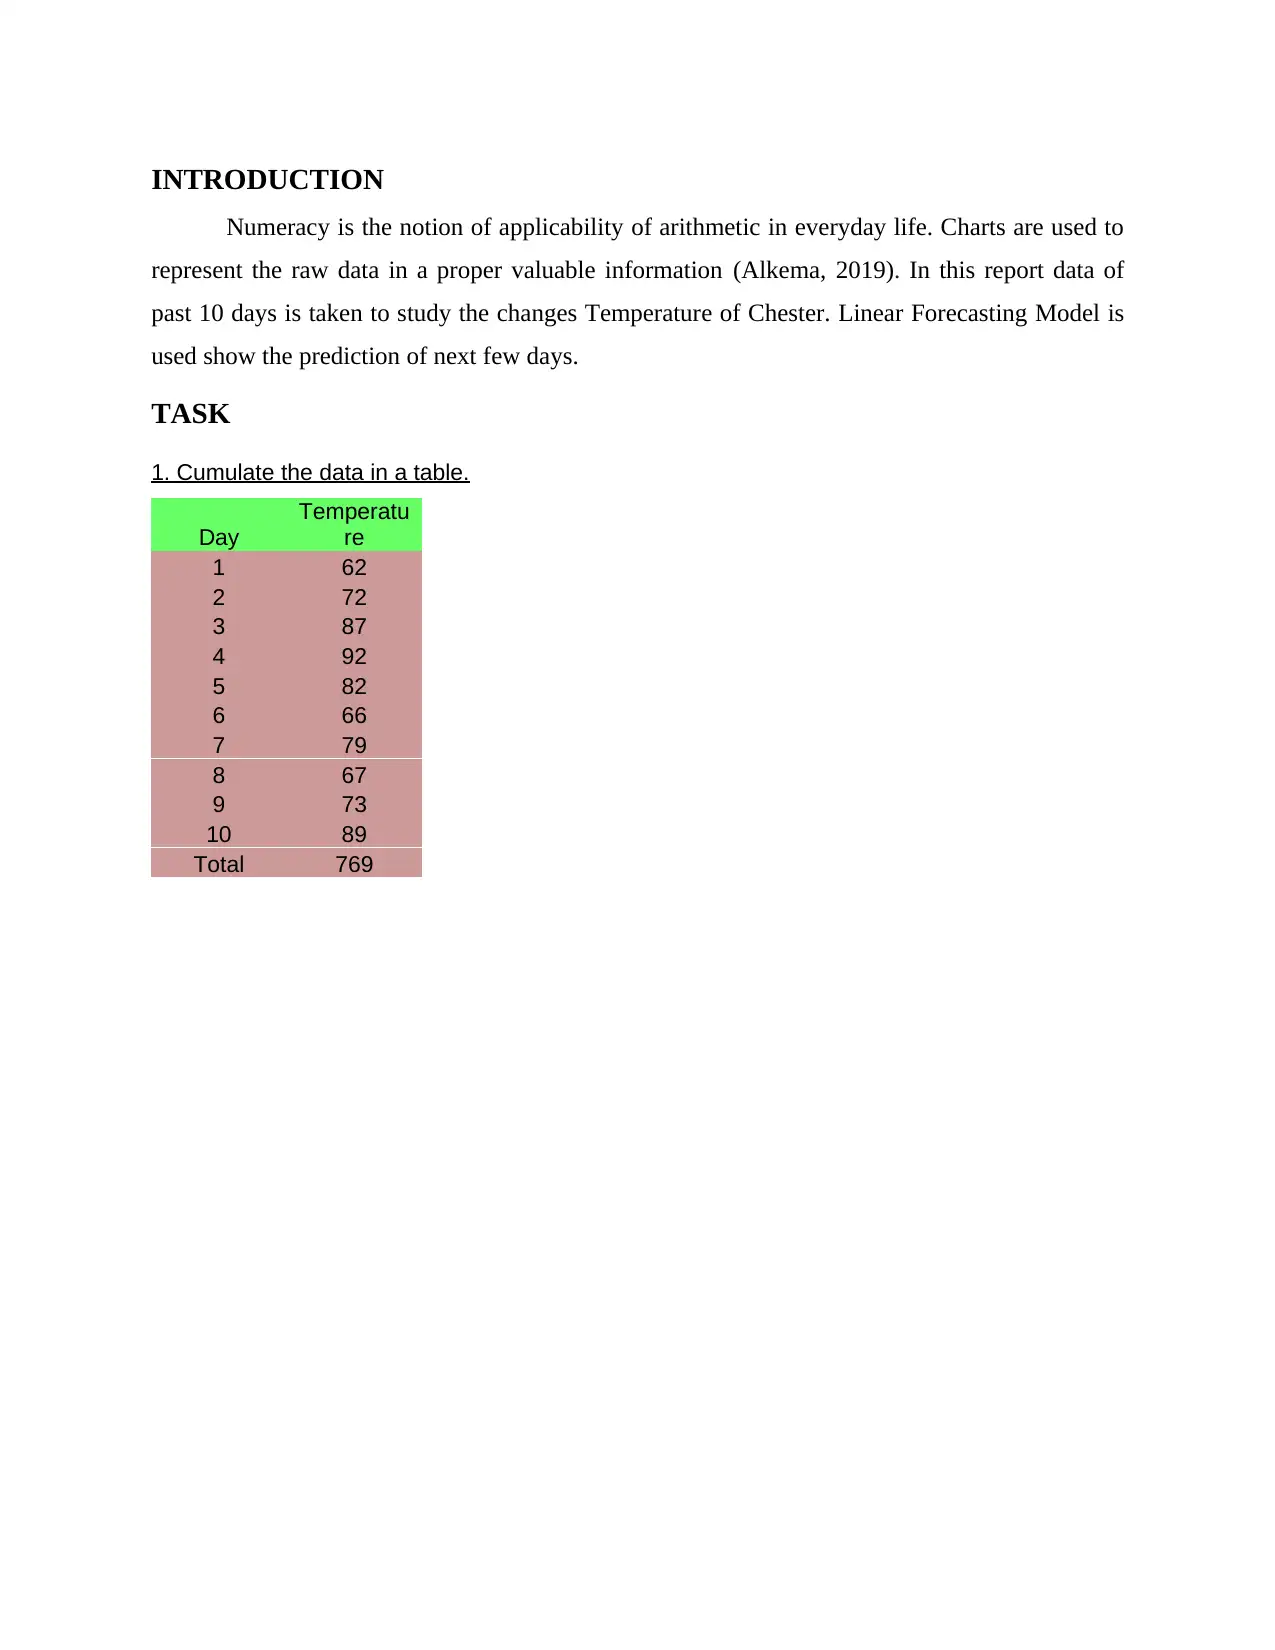
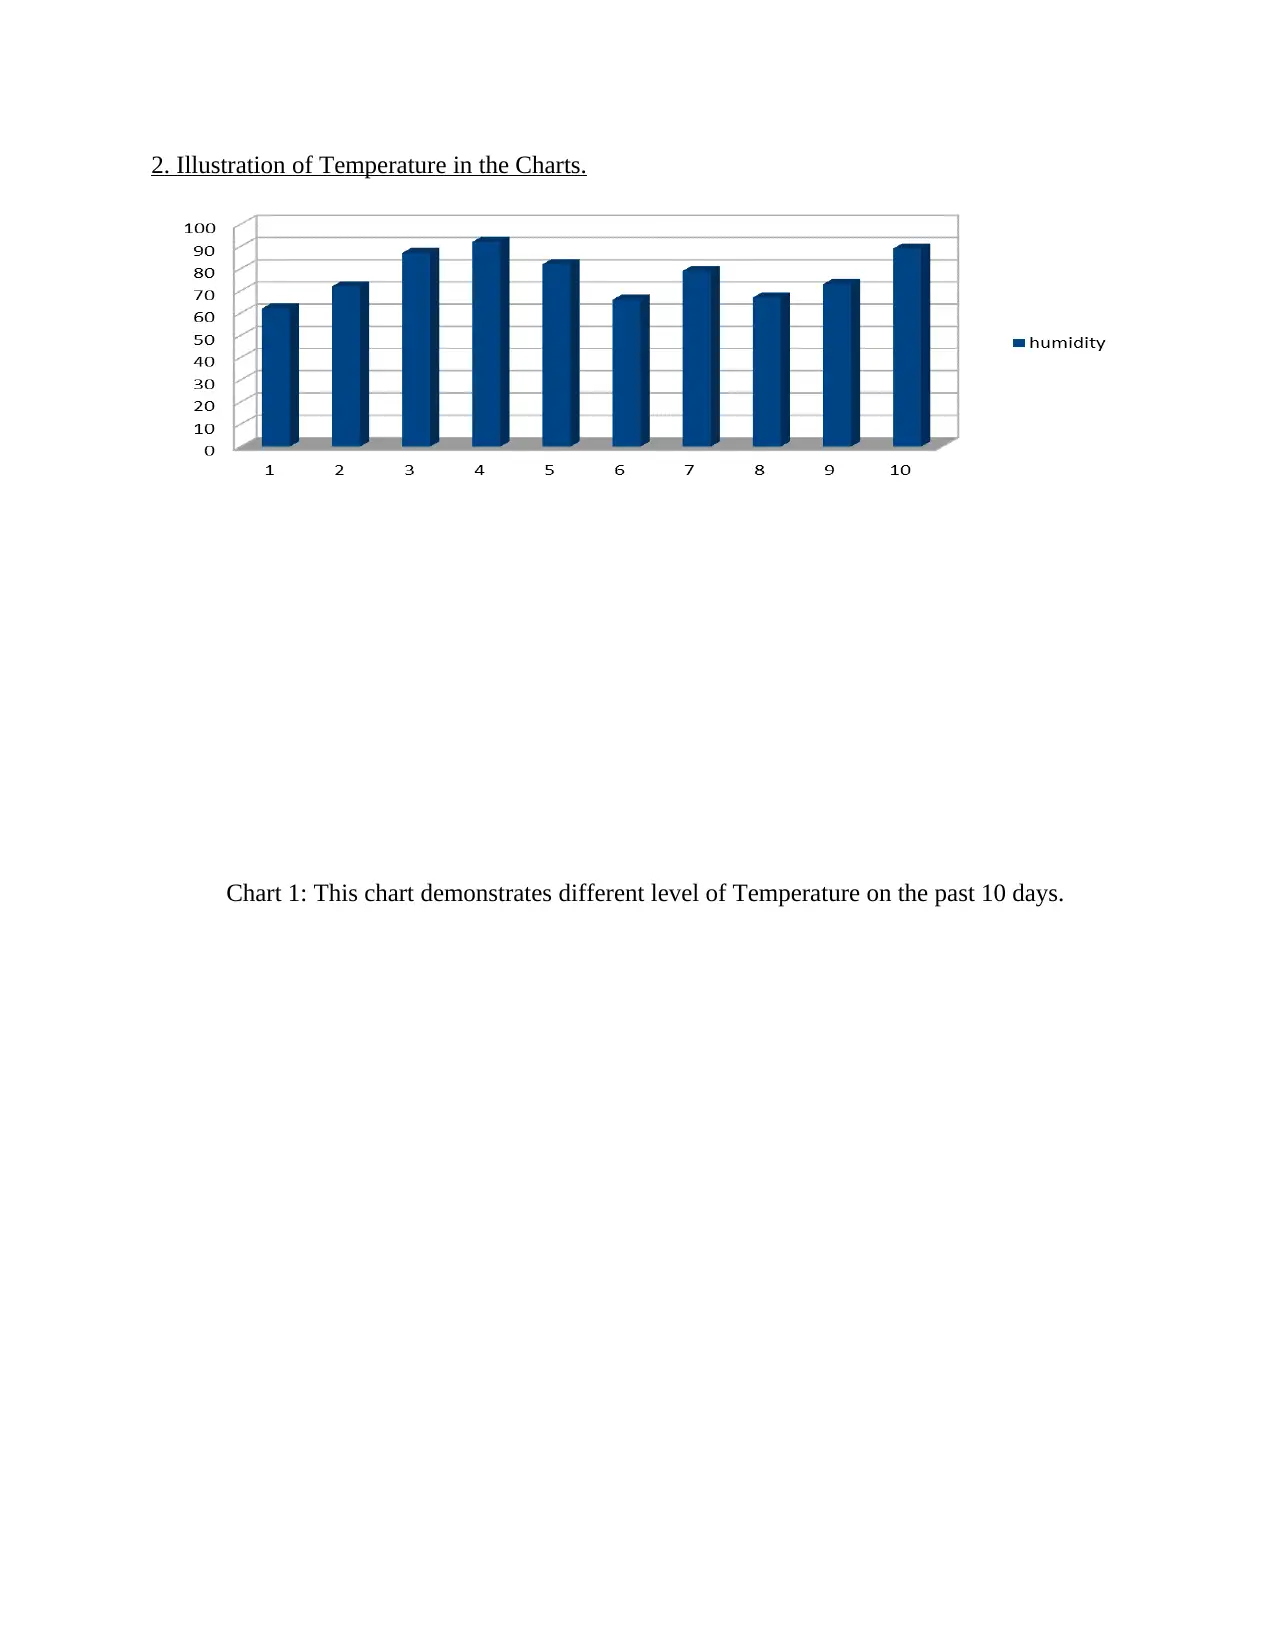
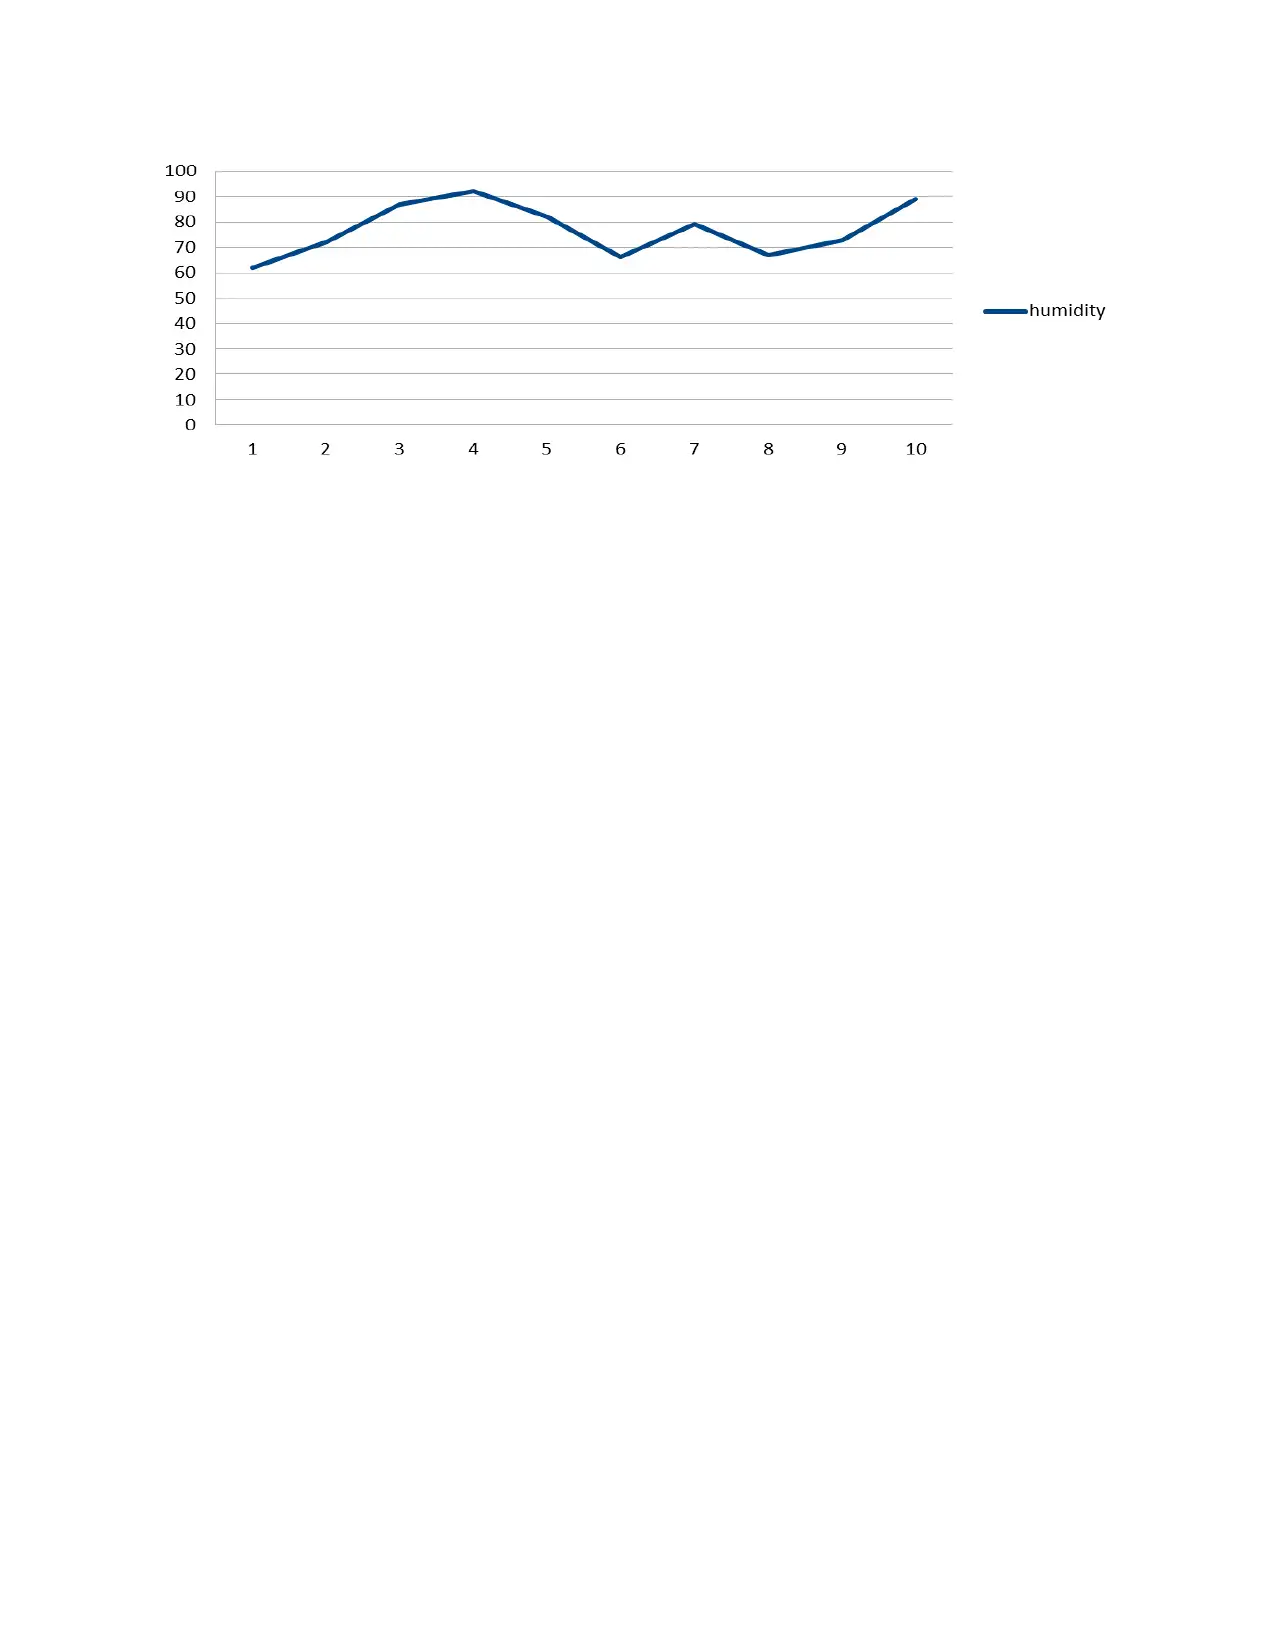
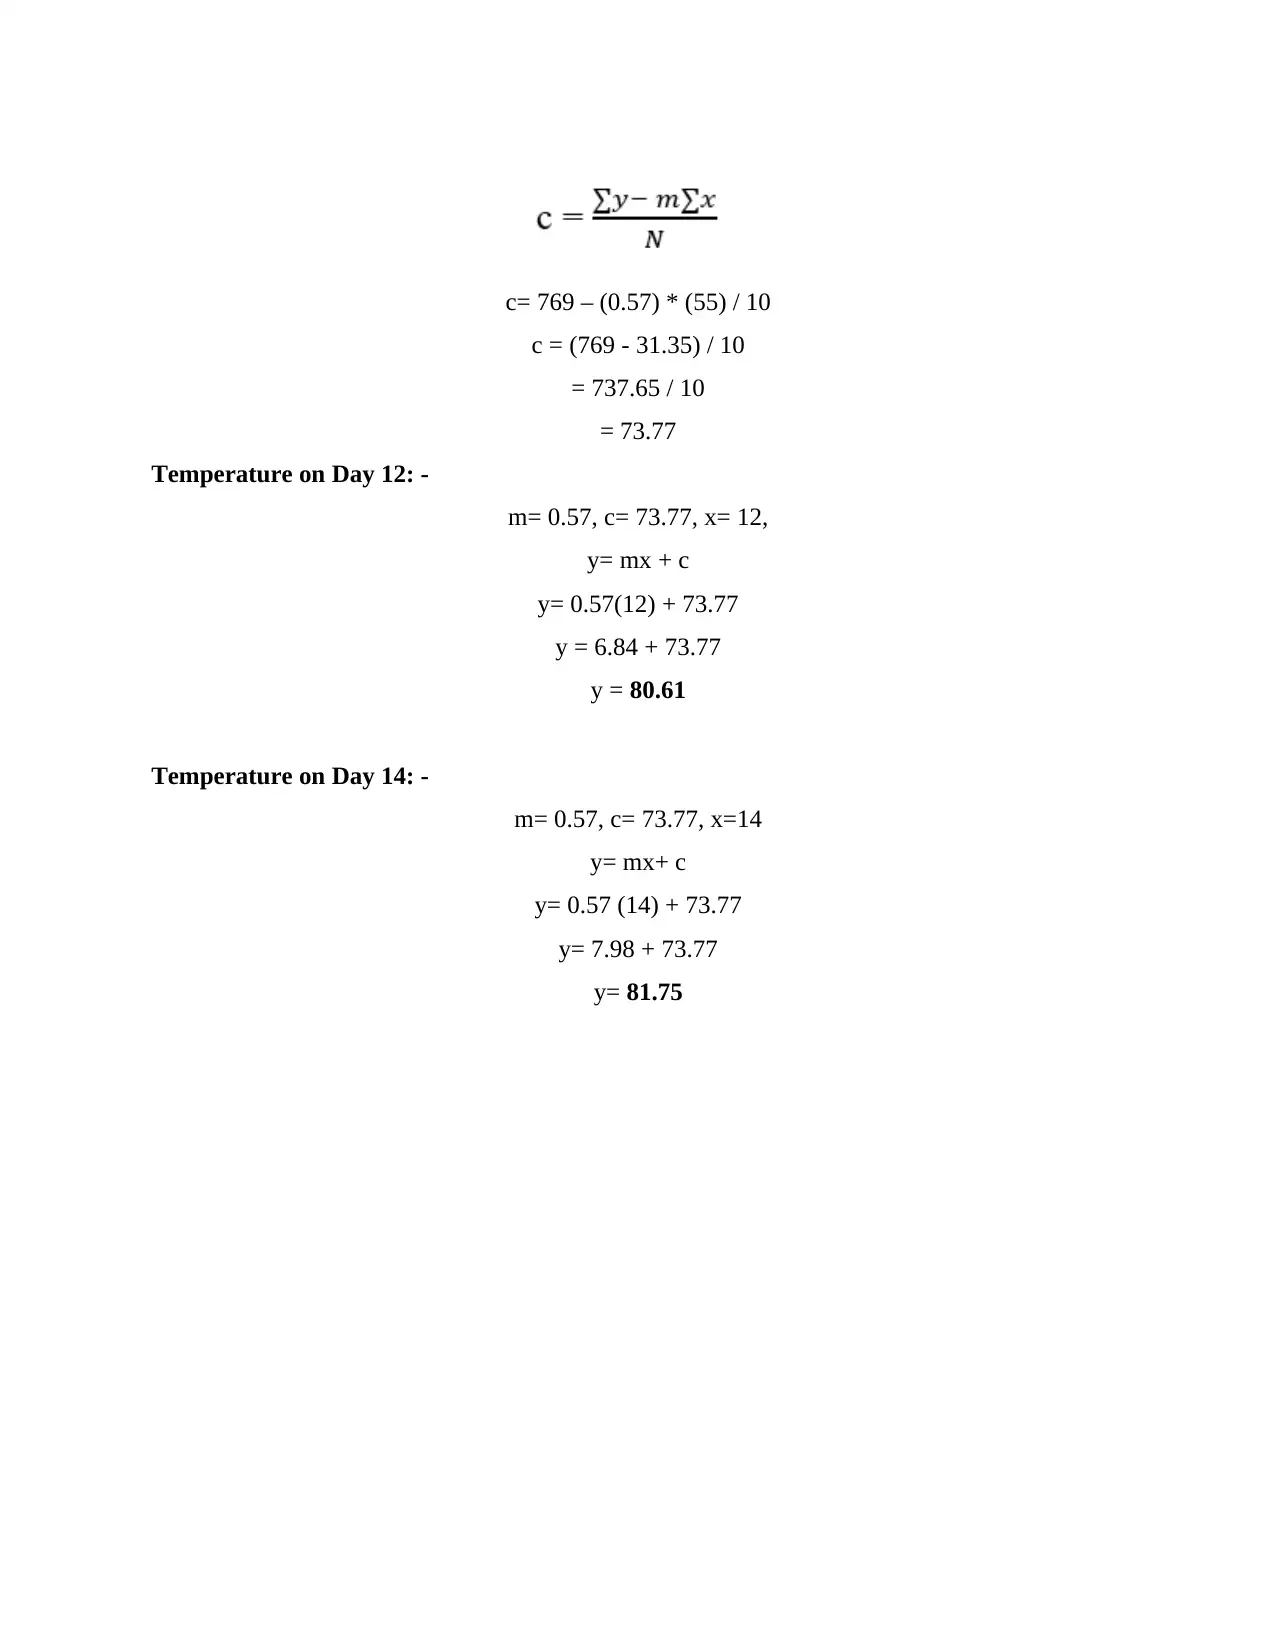
This report provides a comprehensive analysis of numeracy and data, focusing on the application of statistical tools and linear prediction models. It begins by cumulating temperature data over ten days and illustrating these data points using charts. The report then details the calculation steps for various statistical measures, including mean, median, mode, range, and standard deviation, using a sample dataset. Furthermore, it employs a linear forecasting model to perform regression analysis, determining the values of 'c' and 'm' to predict future temperature values. The conclusion summarizes the findings, highlighting key statistical values and predicted temperatures for subsequent days, demonstrating the practical application of numeracy in analyzing and forecasting real-world data. Desklib offers a wealth of similar solved assignments and resources for students.

Numeracy and Data
Analysis
Analysis
Paraphrase This Document
Need a fresh take? Get an instant paraphrase of this document with our AI Paraphraser

Contents
Contents...........................................................................................................................................2
INTRODUCTION...........................................................................................................................3
TASK...............................................................................................................................................3
1. Cumulate the data in a table....................................................................................................3
2. Illustration of Temperature in the Charts................................................................................3
3. State various statistical tools with their steps wise calculation...............................................4
4. By using Lineal Prediction model perform regression examine and find worth of c and m...6
CONCLUSION...........................................................................................................................8
REFERENCES................................................................................................................................9

INTRODUCTION
Numeracy is the notion of applicability of arithmetic in everyday life. Charts are used to
represent the raw data in a proper valuable information (Alkema, 2019). In this report data of
past 10 days is taken to study the changes Temperature of Chester. Linear Forecasting Model is
used show the prediction of next few days.
TASK
1. Cumulate the data in a table.
Day
Temperatu
re
1 62
2 72
3 87
4 92
5 82
6 66
7 79
8 67
9 73
10 89
Total 769
⊘ This is a preview!⊘
Do you want full access?
Subscribe today to unlock all pages.

Trusted by 1+ million students worldwide

2. Illustration of Temperature in the Charts.
Chart 1: This chart demonstrates different level of Temperature on the past 10 days.
Paraphrase This Document
Need a fresh take? Get an instant paraphrase of this document with our AI Paraphraser


Chart 2: In this chart data is related to Temperature of Scotland.
3. State various statistical tools with their steps wise calculation.
Mean: It represents the middle value that can be derived by the adding all the
observations and dividing it by total number of observations. For example, Marks obtained
students in Business studies are 55,60,65,55,65 out of 100. Mean marks in the following
situation is 60 (Cohrssen and Niklas, 2019).
Steps for calculating means: -
Step 1. Arrange all the data.
Step 2. Sum up given number observations
Step 3. Total the number of Observations
Step 4. Divide the result with the number of observation.
Mean = Total of all Result / Number of Observations
Mean = 769 / 10
= 76.9
Median = It is explained as mid value that is ascertain by arrangement of data in
ascendant state and then the middle term is selected. These are the following steps that are used
to calculate median,
Step 1. Firstly, the data is arranged in ascending or descending order.
Step 2. Figure out the number of observations.
Step 3. If the number is Odd, then the middle term that will be derived (N + 1)/2
Step 4. And if it is even then the formula is to be sued to determine median.
Step 5. The resultant figure so derived is Median.
Median: If 'N' is odd = (N+1) / 2
If 'N' is even = (N / 2)
Given data is in percentage:
62,72,87,92,82,66,79,67,73,89
62,66,67,72,73,79,82,87,89,92
Median = (N / 2)
= 10 / 2
= 5th Position
⊘ This is a preview!⊘
Do you want full access?
Subscribe today to unlock all pages.

Trusted by 1+ million students worldwide

Median = 73
Mode: It is the value that have repeated the most in a series (Dian, Faizal and Hasanah,
2022).
Steps to be calculate Mode:
Step 1: Data is collected and organised in ascending or descending order.
Step 2: Find out the value which has repeated the most.
Step 3: Count the number of times the number has incurred.
Step 4: The value which have incurred most times is Mode.
Note: Following data does not have any mode.
From the above calculations the mode of the data is
Range: The value which is derived after subtracting the lowest value from the highest
value of series. If the range is large then it does not form part of central tendency and if the range
is small then it is the part of the central tendency (Parasnis, Paterson and Rendall, 2022).
Steps to be considered while calculating Range:
Step 1. Sort given data.
Step 2. Figure out the highest and lowest value from the data given.
Step 3. Minimum value is subtracted from the highest value.
Step 4. The value so derived is Range.
Range = Highest Quantity – Lowest Quantity
Range = 92 - 62
Range = 30
Standard Deviation: The value which is derived by considering the amount of deviation
from the mean.
Following are the steps to calculate Standard Deviation:
Step 1. Determine the average of data.
Step 2. The fluctuation of to each one observation is measured after deducting mean quantity
from it.
Step 3. The value traced is the summed up.
Step 4. Divide the sum by the figure of observations.
Step 5. At last square root of the data is measured.
Paraphrase This Document
Need a fresh take? Get an instant paraphrase of this document with our AI Paraphraser

Standard Deviation= √ (xi – μ) 2/N
= √ (984.9) / 10
= √ 98.49
= 9.92
4. By using Lineal Prediction model perform regression examine and find worth of c and m.
Lineal Forecasting Model: - This model helps in deciding the future measure based on
the past observations.
y = mx + c
where, 'y' is the Dependent Factor
'mx' is the Independent Factor
'c' is the constant
Steps for calculating m value,
Step 1. Work out the Factor X and Y by multiplying, which are termed as date and Temperature.
Step 2. Total of all above measured values.
Step 3. Total of x factor and y variable individually.
Step 4. multiply both the variables.
Step 5. Calculate ( x)⅀ 2 and assign the values in the formula.
Step 6. The derived worth is value of 'm'.
m= 10 (4277) – (55) * (769) / 10 * (385) – (55) 2
m= 42770 – 42295 / 3850 - 3025
m= 475/ 825
m= 0.57
Steps of calculation value of 'c'
1. Work out the sum of 'y' factor.
2. Calculate the sum of 'x' factor.
3. Divide it with the total of 'N'.
4. The value so derived is value of 'c'.

c= 769 – (0.57) * (55) / 10
c = (769 - 31.35) / 10
= 737.65 / 10
= 73.77
Temperature on Day 12: -
m= 0.57, c= 73.77, x= 12,
y= mx + c
y= 0.57(12) + 73.77
y = 6.84 + 73.77
y = 80.61
Temperature on Day 14: -
m= 0.57, c= 73.77, x=14
y= mx+ c
y= 0.57 (14) + 73.77
y= 7.98 + 73.77
y= 81.75
c = (769 - 31.35) / 10
= 737.65 / 10
= 73.77
Temperature on Day 12: -
m= 0.57, c= 73.77, x= 12,
y= mx + c
y= 0.57(12) + 73.77
y = 6.84 + 73.77
y = 80.61
Temperature on Day 14: -
m= 0.57, c= 73.77, x=14
y= mx+ c
y= 0.57 (14) + 73.77
y= 7.98 + 73.77
y= 81.75
⊘ This is a preview!⊘
Do you want full access?
Subscribe today to unlock all pages.

Trusted by 1+ million students worldwide

CONCLUSION
In the above report it shows data of Chester in Table 1. which shows moisture of preceding 10
days. Both the chart shows the stickiness of the city. Arithmetical tools are used to determine the
Temperature level of the town. Calculations shows that the mean is 76.9, median is 73 and mode
are 76,79 and there is no mode in the following data. The Range of the facts is 16 and Standard
deviation is 4.65. Linear Predicting Model is used to predict the moisture of Day 11 and Day 13
that are 80.61 and 81.75.
Paraphrase This Document
Need a fresh take? Get an instant paraphrase of this document with our AI Paraphraser

REFERENCES
Books and Journals
Alkema, A., 2019. The workplace as a context for adult literacy and numeracy learning. Journal
of Adolescent & Adult Literacy. 63(1). pp.102-105.
Cohrssen, C. and Niklas, F., 2019. Using mathematics games in preschool settings to support the
development of children’s numeracy skills. International Journal of Early Years
Education. 27(3). pp.322-339.
Dian, D., Faizal, I. and Hasanah, N.D., 2022. Leadership and Capacity Building; The
Construction of Madrasah Quality Improvement. AL-TANZIM: Jurnal Manajemen
Pendidikan Islam. 6(1). pp.79-90.
Parasnis, J., Paterson, M. and Rendall, M., 2022. Gender, Income, and Numeracy Test Scores.
Tazouti, Y., Thomas, A. and Hoareau, L., 2020. Intervention programs to literacy and numeracy
skills in preschools. La revue internationale de leducation familiale. (1). pp.33-52.
1 out of 11
Related Documents

Your All-in-One AI-Powered Toolkit for Academic Success.
+13062052269
info@desklib.com
Available 24*7 on WhatsApp / Email
Unlock your academic potential
Copyright © 2020–2025 A2Z Services. All Rights Reserved. Developed and managed by ZUCOL.