Numeracy and Data Analysis: Bedford Temperature and Forecasting

Verified

Added on  2023/06/08

|11
|1612
|327
Report
AI Summary
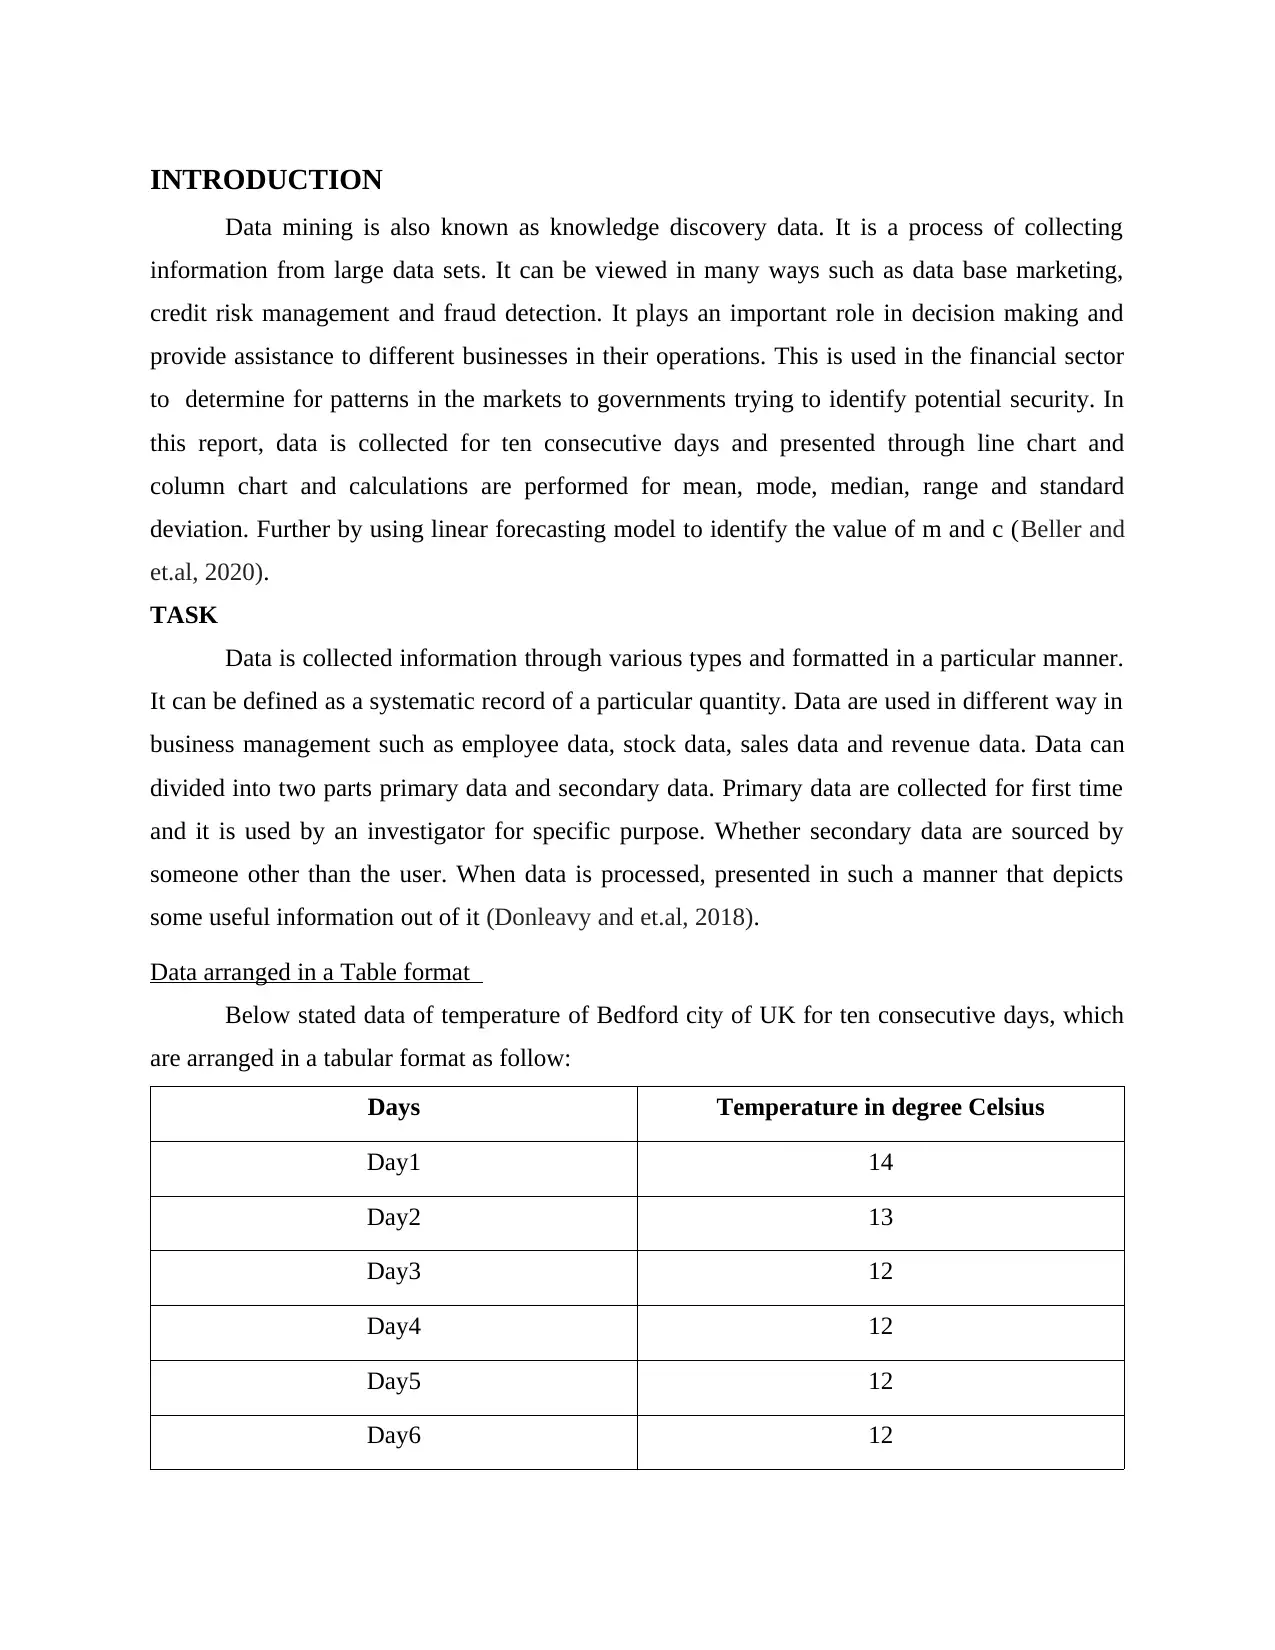
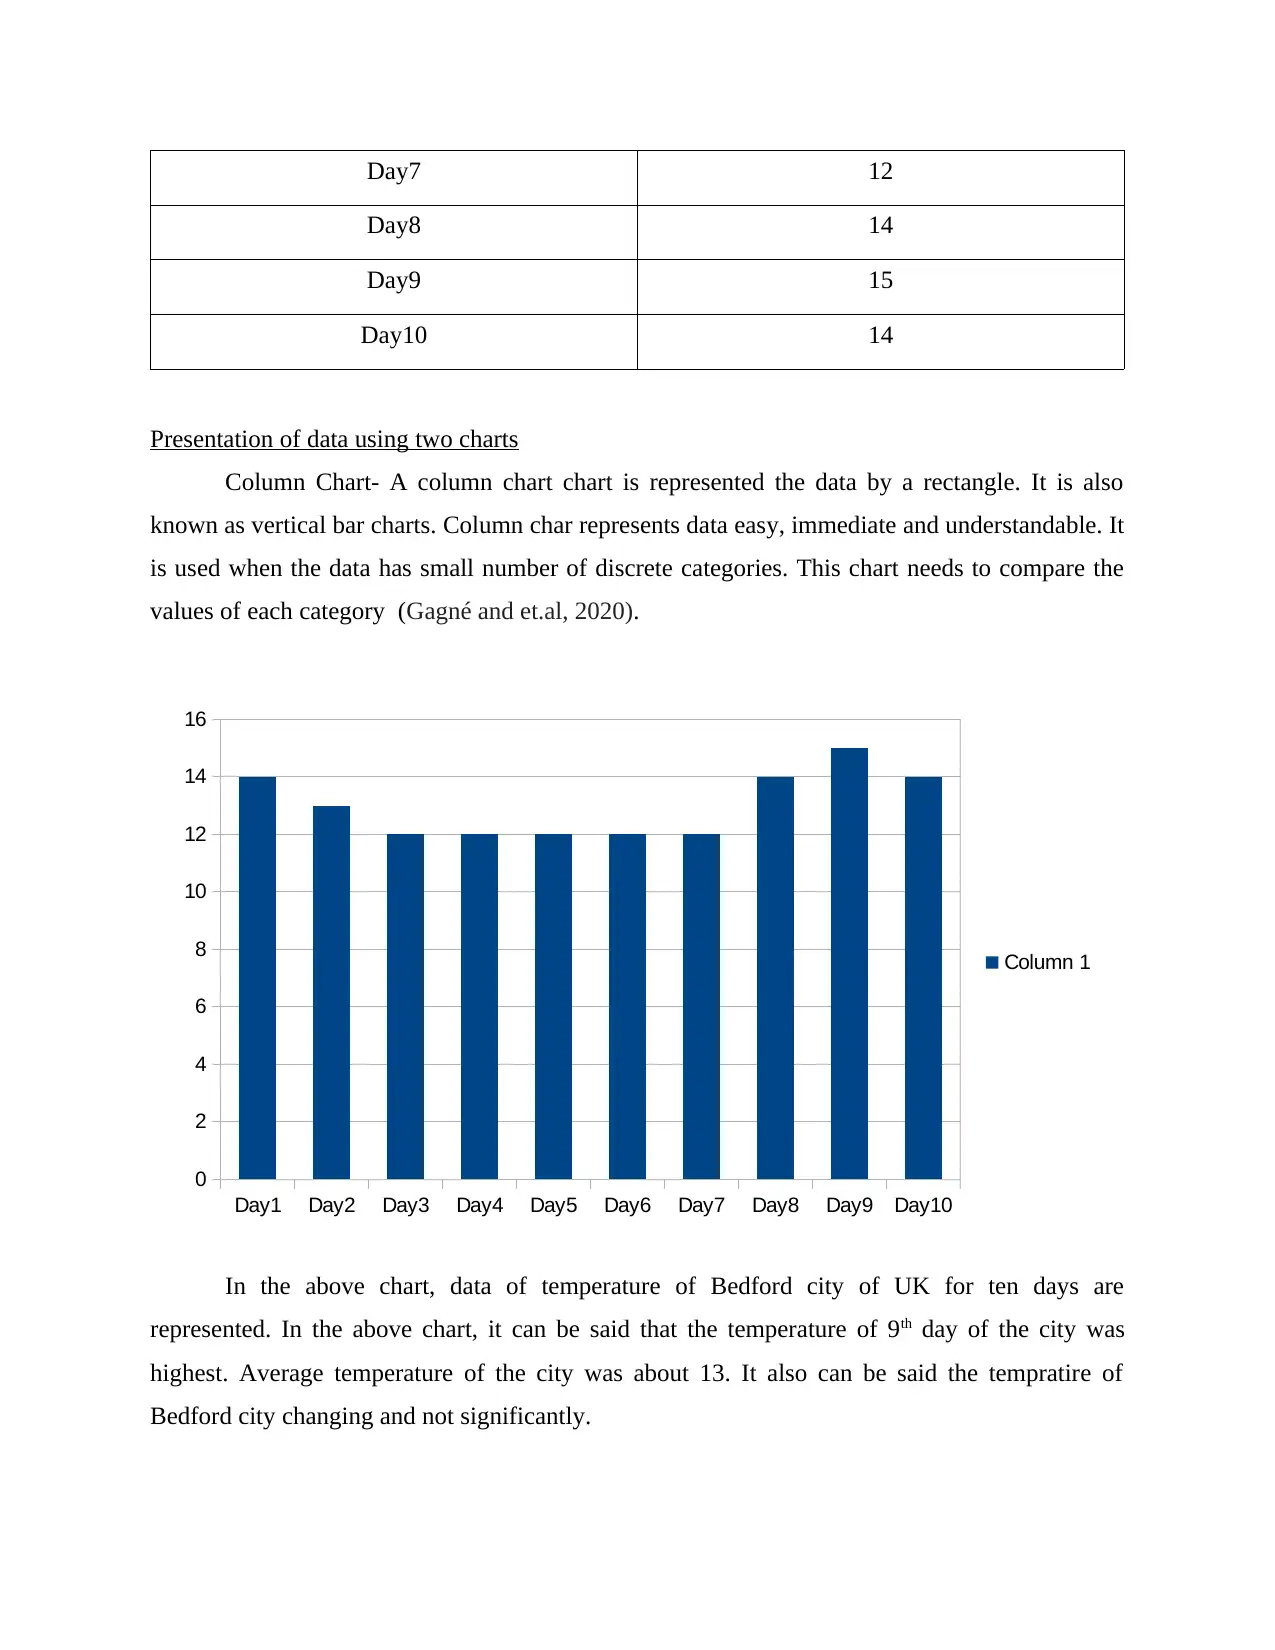
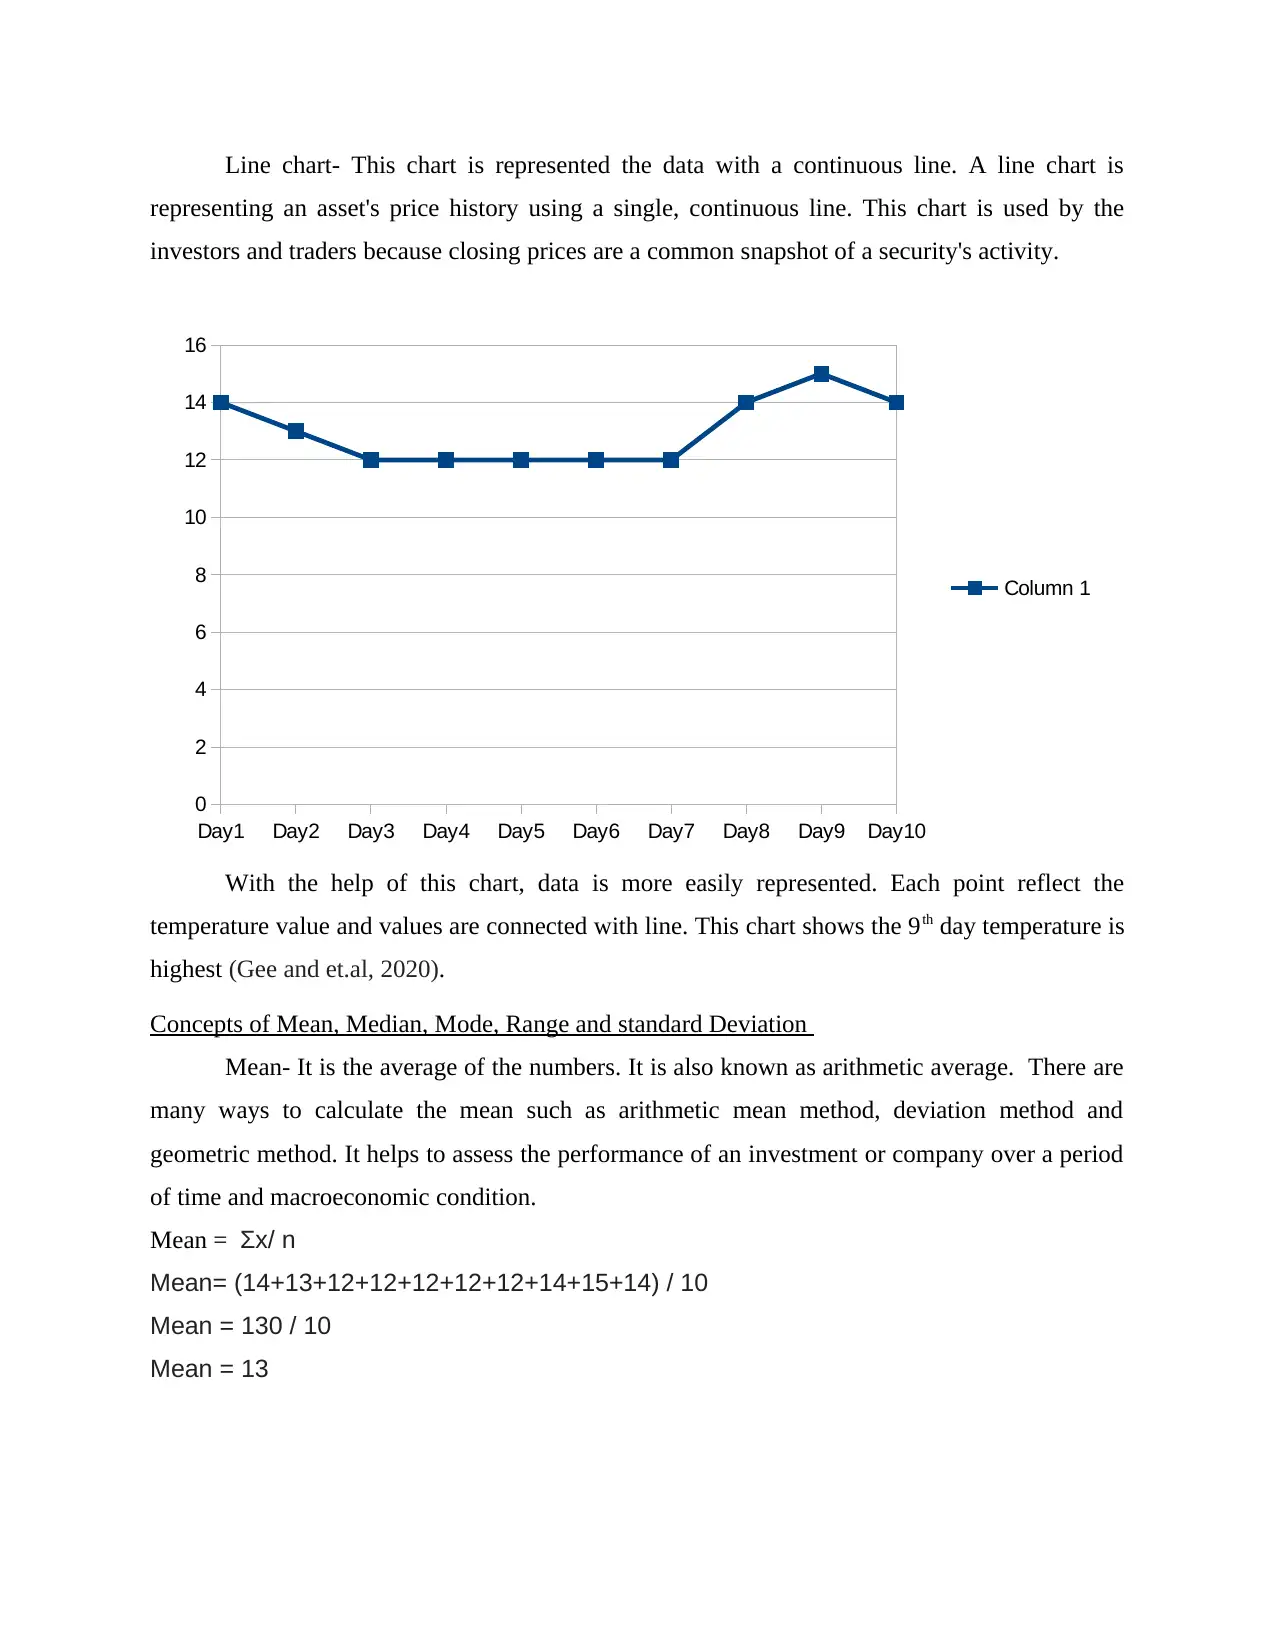
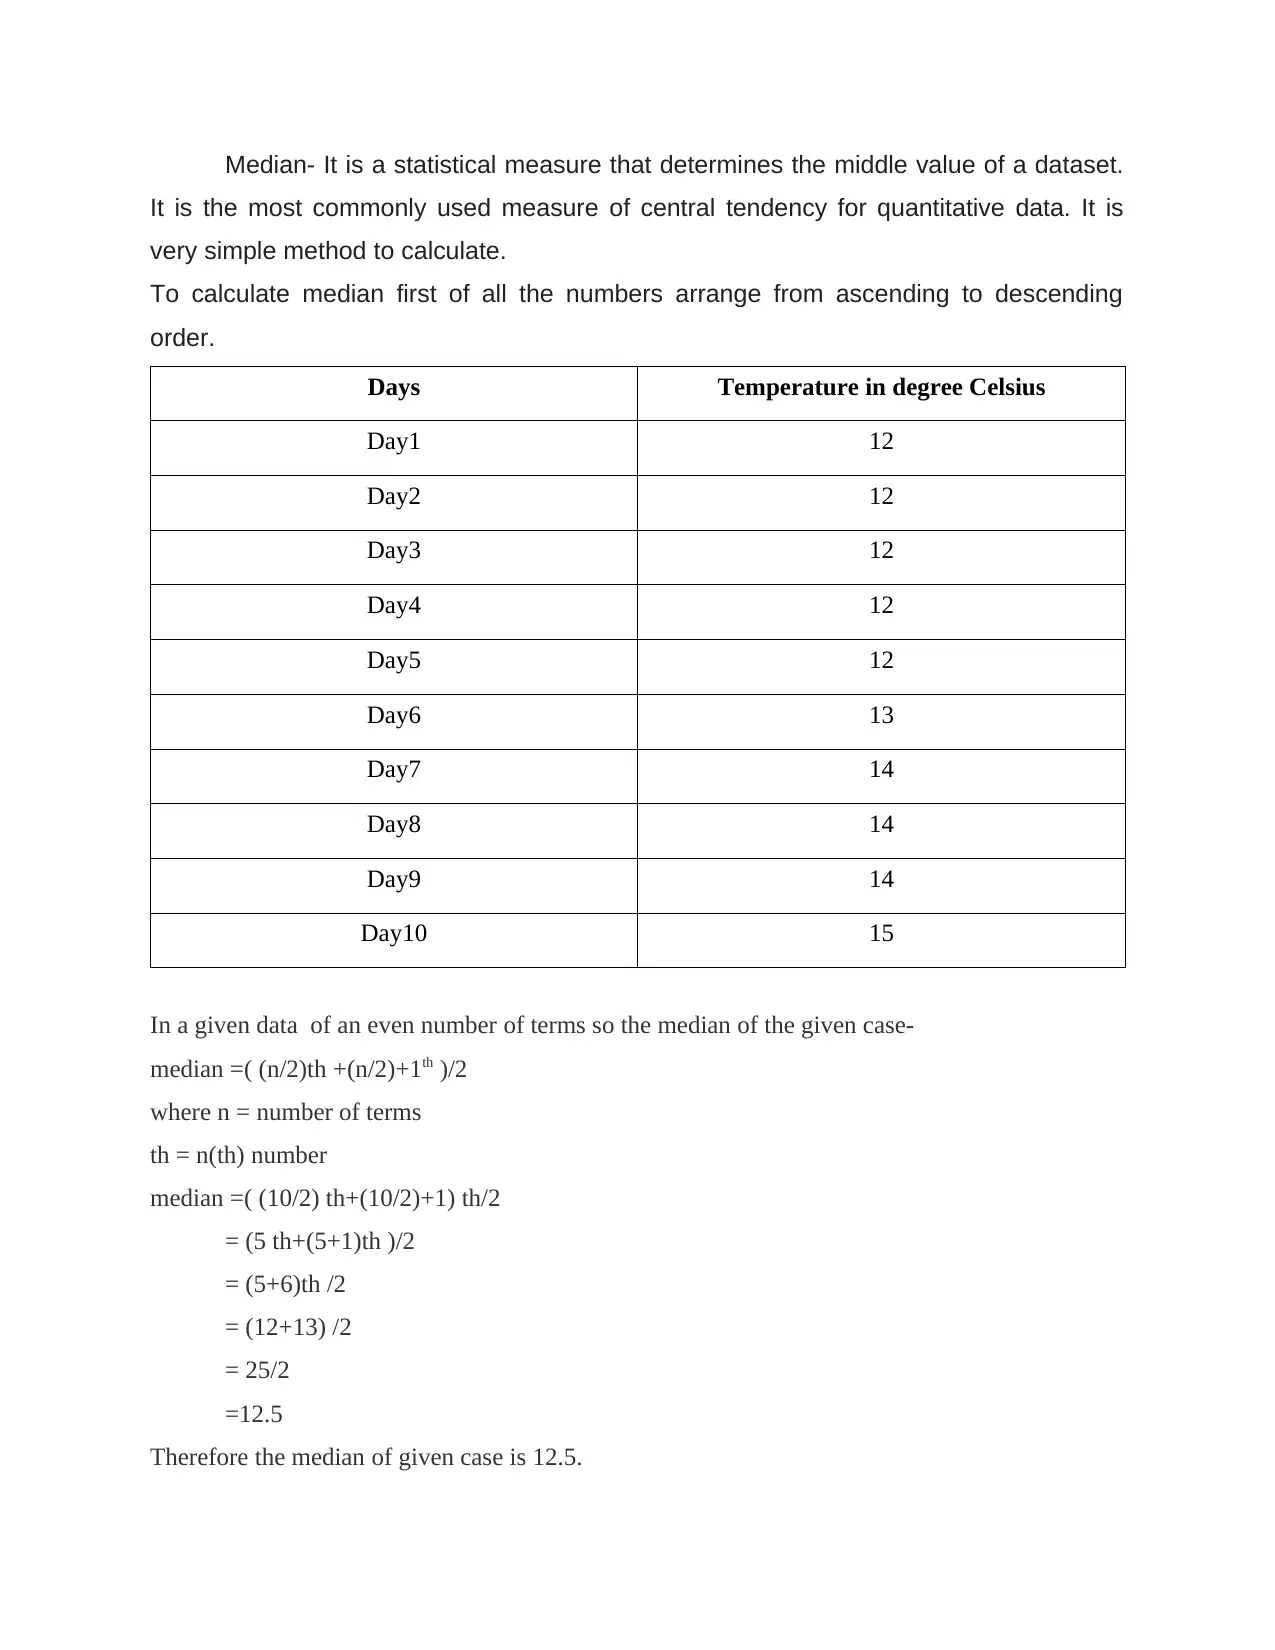
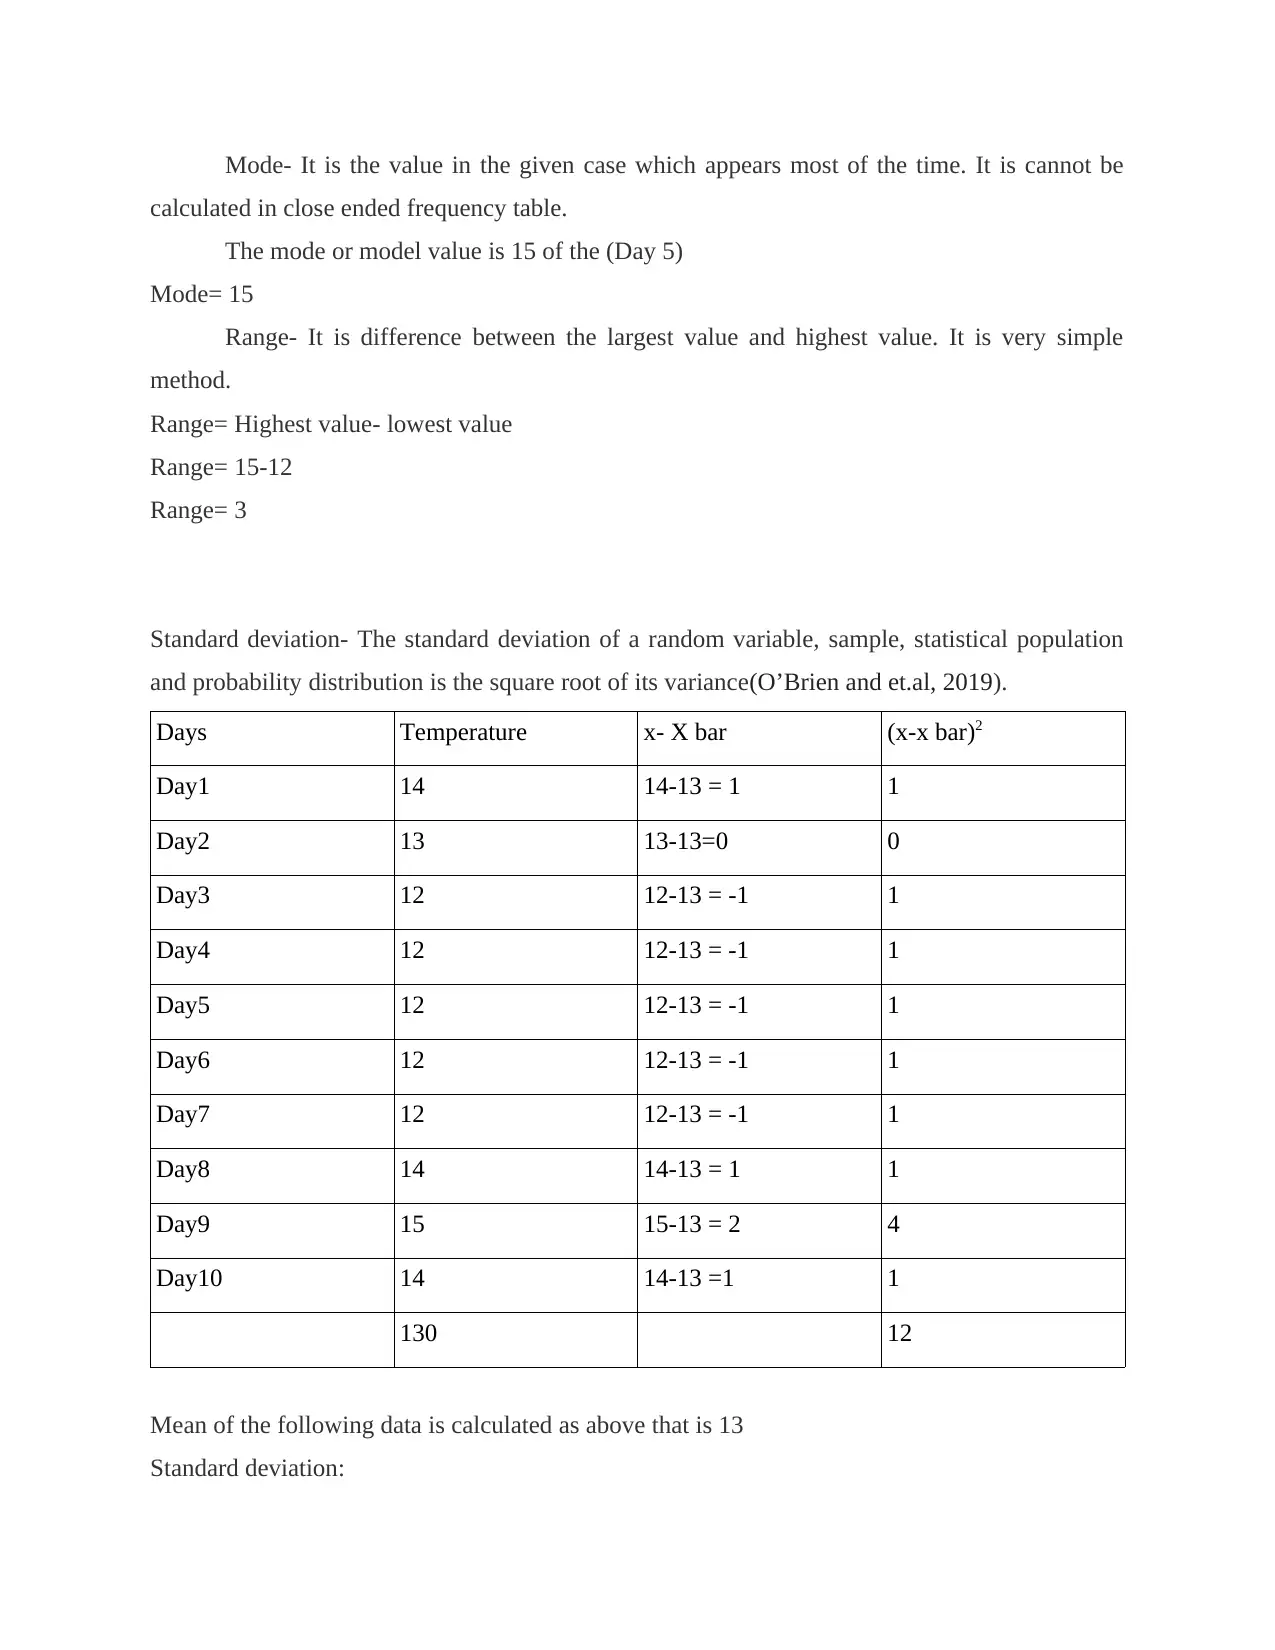
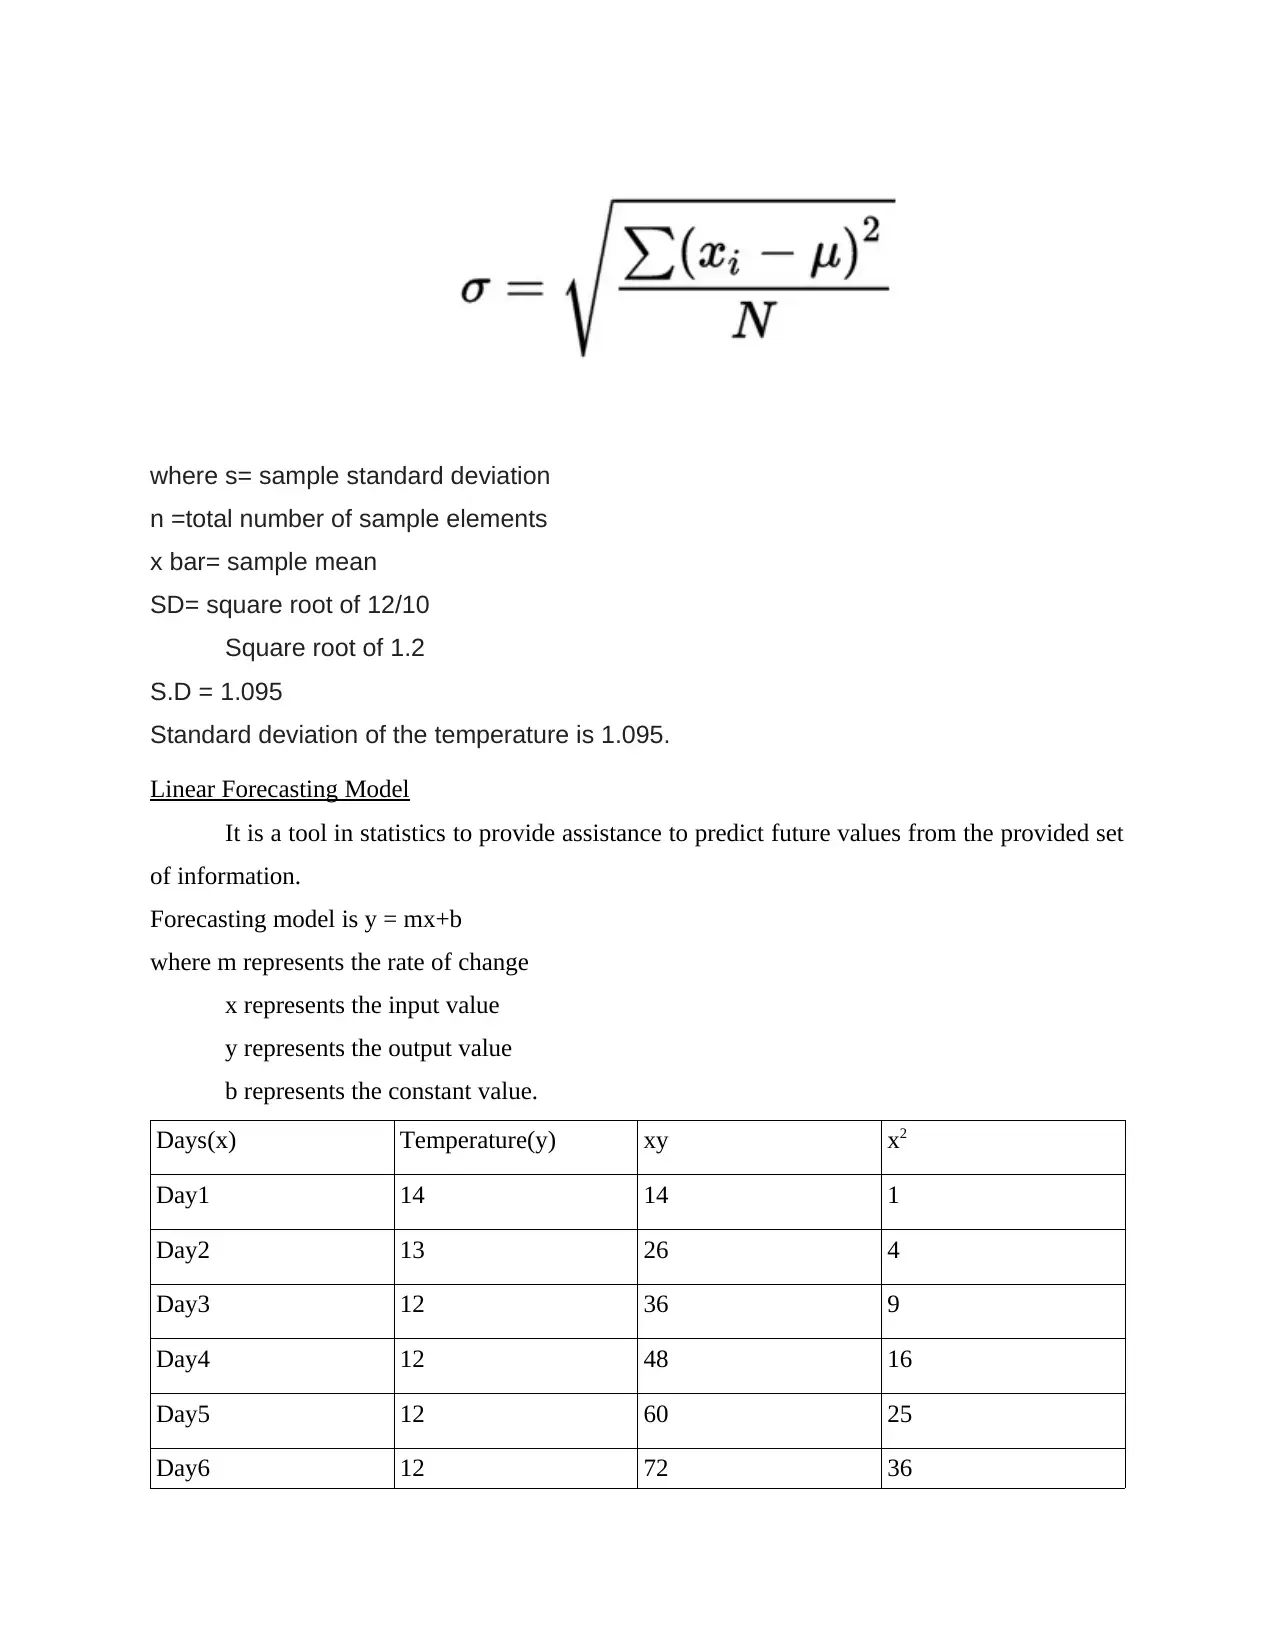
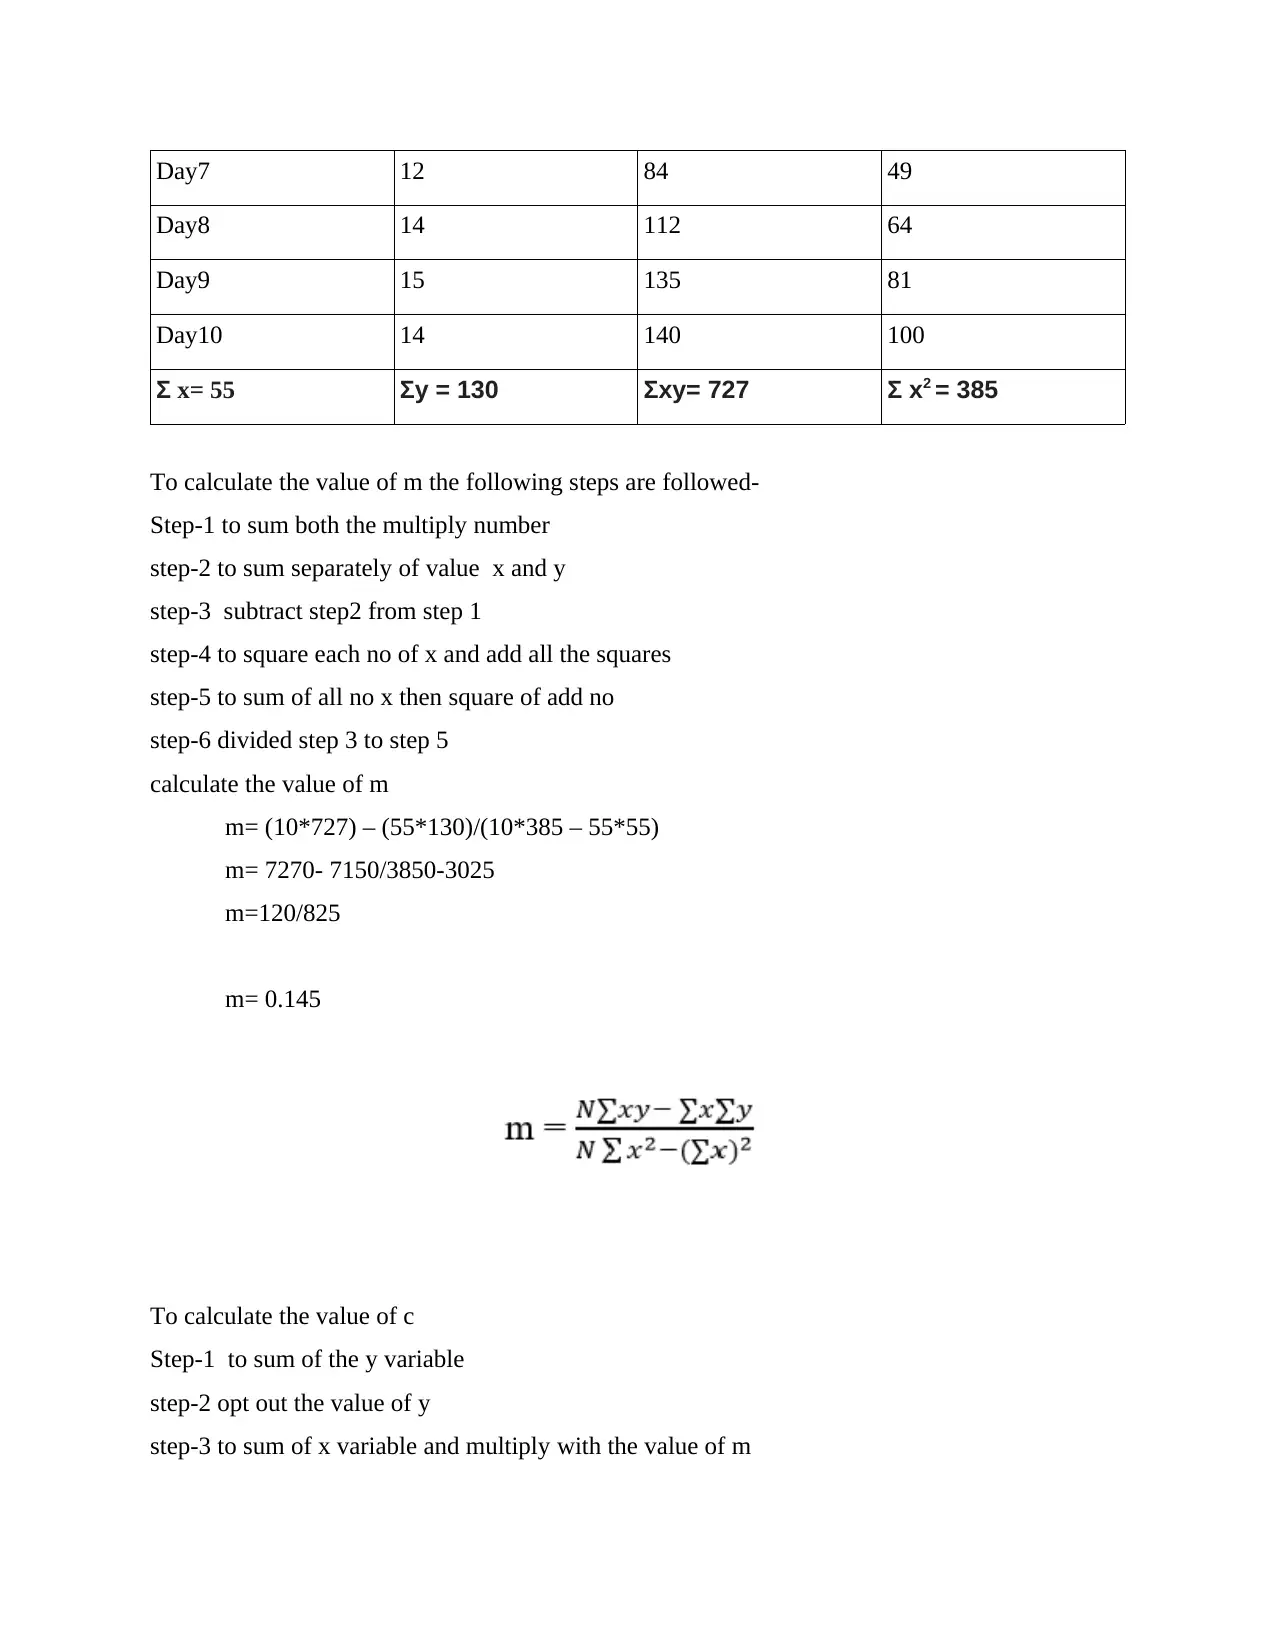
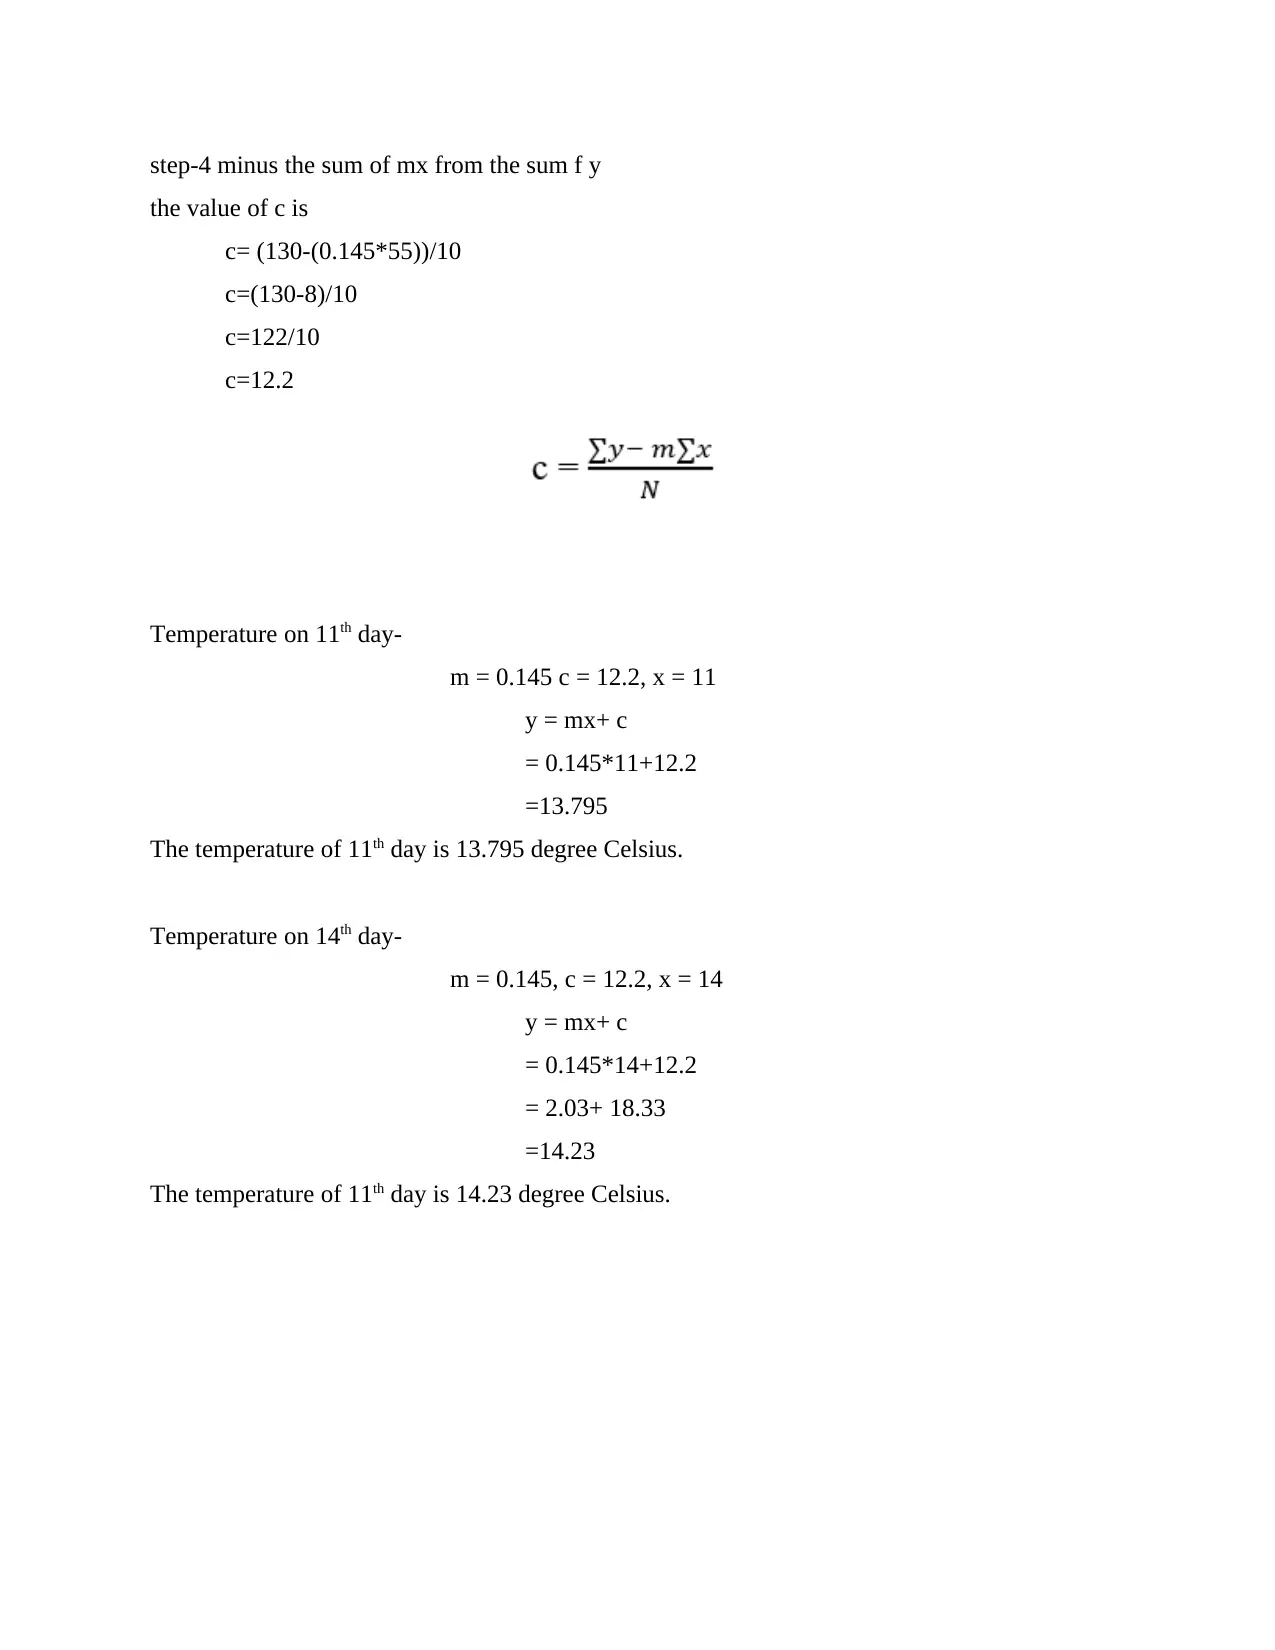
This report provides a detailed analysis of temperature data collected over ten consecutive days in Bedford, UK. The data is presented using column and line charts to visualize temperature variations. Key statistical concepts such as mean, median, mode, range, and standard deviation are calculated to understand the central tendency and dispersion of the temperature data. Furthermore, a linear forecasting model is applied to predict the temperature on the 11th and 14th days, demonstrating the application of statistical techniques in forecasting. The report includes a comprehensive explanation of each method and relevant calculations, offering a clear understanding of data analysis and its practical applications.
tabler-icon-diamond-filled.svg

Contribute Materials

Your contribution can guide someone’s learning journey. Share your documents today.
Document Page
NUMERACY AND
DATA ANALYSIS
tabler-icon-diamond-filled.svg

Secure Best Marks with AI Grader

Need help grading? Try our AI Grader for instant feedback on your assignments.
Document Page
Table of Contents
INTRODUCTION...........................................................................................................................3
Data arranged in a Table format ................................................................................................3
Presentation of data using two charts..........................................................................................4
Concepts of Mean, Median, Mode, Range and standard Deviation ...........................................5
Linear Forecasting Model...........................................................................................................8
REFERENCES..............................................................................................................................11
Document Page
INTRODUCTION
Data mining is also known as knowledge discovery data. It is a process of collecting
information from large data sets. It can be viewed in many ways such as data base marketing,
credit risk management and fraud detection. It plays an important role in decision making and
provide assistance to different businesses in their operations. This is used in the financial sector
to determine for patterns in the markets to governments trying to identify potential security. In
this report, data is collected for ten consecutive days and presented through line chart and
column chart and calculations are performed for mean, mode, median, range and standard
deviation. Further by using linear forecasting model to identify the value of m and c (Beller and
et.al, 2020).
TASK
Data is collected information through various types and formatted in a particular manner.
It can be defined as a systematic record of a particular quantity. Data are used in different way in
business management such as employee data, stock data, sales data and revenue data. Data can
divided into two parts primary data and secondary data. Primary data are collected for first time
and it is used by an investigator for specific purpose. Whether secondary data are sourced by
someone other than the user. When data is processed, presented in such a manner that depicts
some useful information out of it (Donleavy and et.al, 2018).
Data arranged in a Table format
Below stated data of temperature of Bedford city of UK for ten consecutive days, which
are arranged in a tabular format as follow:
Days Temperature in degree Celsius
Day1 14
Day2 13
Day3 12
Day4 12
Day5 12
Day6 12
Document Page
Day7 12
Day8 14
Day9 15
Day10 14
Presentation of data using two charts
Column Chart- A column chart chart is represented the data by a rectangle. It is also
known as vertical bar charts. Column char represents data easy, immediate and understandable. It
is used when the data has small number of discrete categories. This chart needs to compare the
values of each category (Gagné and et.al, 2020).
In the above chart, data of temperature of Bedford city of UK for ten days are
represented. In the above chart, it can be said that the temperature of 9th day of the city was
highest. Average temperature of the city was about 13. It also can be said the tempratire of
Bedford city changing and not significantly.
Day1 Day2 Day3 Day4 Day5 Day6 Day7 Day8 Day9 Day10
0
2
4
6
8
10
12
14
16
Column 1
tabler-icon-diamond-filled.svg

Secure Best Marks with AI Grader

Need help grading? Try our AI Grader for instant feedback on your assignments.
Document Page
Line chart- This chart is represented the data with a continuous line. A line chart is
representing an asset's price history using a single, continuous line. This chart is used by the
investors and traders because closing prices are a common snapshot of a security's activity.
With the help of this chart, data is more easily represented. Each point reflect the
temperature value and values are connected with line. This chart shows the 9th day temperature is
highest (Gee and et.al, 2020).
Concepts of Mean, Median, Mode, Range and standard Deviation
Mean- It is the average of the numbers. It is also known as arithmetic average. There are
many ways to calculate the mean such as arithmetic mean method, deviation method and
geometric method. It helps to assess the performance of an investment or company over a period
of time and macroeconomic condition.
Mean = Σx/ n
Mean= (14+13+12+12+12+12+12+14+15+14) / 10
Mean = 130 / 10
Mean = 13
Day1 Day2 Day3 Day4 Day5 Day6 Day7 Day8 Day9 Day10
0
2
4
6
8
10
12
14
16
Column 1
Document Page
Median- It is a statistical measure that determines the middle value of a dataset.
It is the most commonly used measure of central tendency for quantitative data. It is
very simple method to calculate.
To calculate median first of all the numbers arrange from ascending to descending
order.
Days Temperature in degree Celsius
Day1 12
Day2 12
Day3 12
Day4 12
Day5 12
Day6 13
Day7 14
Day8 14
Day9 14
Day10 15
In a given data of an even number of terms so the median of the given case-
median =( (n/2)th +(n/2)+1th )/2
where n = number of terms
th = n(th) number
median =( (10/2) th+(10/2)+1) th/2
= (5 th+(5+1)th )/2
= (5+6)th /2
= (12+13) /2
= 25/2
=12.5
Therefore the median of given case is 12.5.
Document Page
Mode- It is the value in the given case which appears most of the time. It is cannot be
calculated in close ended frequency table.
The mode or model value is 15 of the (Day 5)
Mode= 15
Range- It is difference between the largest value and highest value. It is very simple
method.
Range= Highest value- lowest value
Range= 15-12
Range= 3
Standard deviation- The standard deviation of a random variable, sample, statistical population
and probability distribution is the square root of its variance(O’Brien and et.al, 2019).
Days Temperature x- X bar (x-x bar)2
Day1 14 14-13 = 1 1
Day2 13 13-13=0 0
Day3 12 12-13 = -1 1
Day4 12 12-13 = -1 1
Day5 12 12-13 = -1 1
Day6 12 12-13 = -1 1
Day7 12 12-13 = -1 1
Day8 14 14-13 = 1 1
Day9 15 15-13 = 2 4
Day10 14 14-13 =1 1
130 12
Mean of the following data is calculated as above that is 13
Standard deviation:
tabler-icon-diamond-filled.svg

Paraphrase This Document

Need a fresh take? Get an instant paraphrase of this document with our AI Paraphraser
Document Page
where s= sample standard deviation
n =total number of sample elements
x bar= sample mean
SD= square root of 12/10
Square root of 1.2
S.D = 1.095
Standard deviation of the temperature is 1.095.
Linear Forecasting Model
It is a tool in statistics to provide assistance to predict future values from the provided set
of information.
Forecasting model is y = mx+b
where m represents the rate of change
x represents the input value
y represents the output value
b represents the constant value.
Days(x) Temperature(y) xy x2
Day1 14 14 1
Day2 13 26 4
Day3 12 36 9
Day4 12 48 16
Day5 12 60 25
Day6 12 72 36
Document Page
Day7 12 84 49
Day8 14 112 64
Day9 15 135 81
Day10 14 140 100
Σ x= 55 Σy = 130 Σxy= 727 Σ x2 = 385
To calculate the value of m the following steps are followed-
Step-1 to sum both the multiply number
step-2 to sum separately of value x and y
step-3 subtract step2 from step 1
step-4 to square each no of x and add all the squares
step-5 to sum of all no x then square of add no
step-6 divided step 3 to step 5
calculate the value of m
m= (10*727) – (55*130)/(10*385 – 55*55)
m= 7270- 7150/3850-3025
m=120/825
m= 0.145
To calculate the value of c
Step-1 to sum of the y variable
step-2 opt out the value of y
step-3 to sum of x variable and multiply with the value of m
Document Page
step-4 minus the sum of mx from the sum f y
the value of c is
c= (130-(0.145*55))/10
c=(130-8)/10
c=122/10
c=12.2
Temperature on 11th day-
m = 0.145 c = 12.2, x = 11
y = mx+ c
= 0.145*11+12.2
=13.795
The temperature of 11th day is 13.795 degree Celsius.
Temperature on 14th day-
m = 0.145, c = 12.2, x = 14
y = mx+ c
= 0.145*14+12.2
= 2.03+ 18.33
=14.23
The temperature of 11th day is 14.23 degree Celsius.
tabler-icon-diamond-filled.svg

Secure Best Marks with AI Grader

Need help grading? Try our AI Grader for instant feedback on your assignments.
Document Page
REFERENCES
Books and Journals
Beller and et.al, 2020. Loneliness and health: the moderating effect of cross-cultural
individualism/collectivism. Journal of Aging and Health, 32(10). pp.1516-1527.
Donleavy and et.al, 2018. How numeracy mediates cash flow format preferences: A worldwide
study. The International Journal of Management Education, 16(2). pp.180-192.
Gagné and et.al, 2020. Disentangling the role of income in the academic achievement of migrant
children. Social Science Research,85. pp.102344.
Gee and et.al, 2020. Outcomes of inclusive versus separate placements: A matched pairs
comparison study. Research and Practice for Persons with Severe Disabilities, 45(4).
pp.223-240.
O’Brien and et.al, 2019. Irish teachers, starting on a journey of data use for school self-
evaluation. Studies in Educational Evaluation, 60. pp.1-13.
chevron_up_icon
1 out of 11
circle_padding
hide_on_mobile
zoom_out_icon
logo.png

Your All-in-One AI-Powered Toolkit for Academic Success.

Available 24*7 on WhatsApp / Email

[object Object]