Comprehensive Numeracy and Data Analysis Report: Durham Station Usage
VerifiedAdded on 2020/10/22
|10
|1433
|339
Report
AI Summary
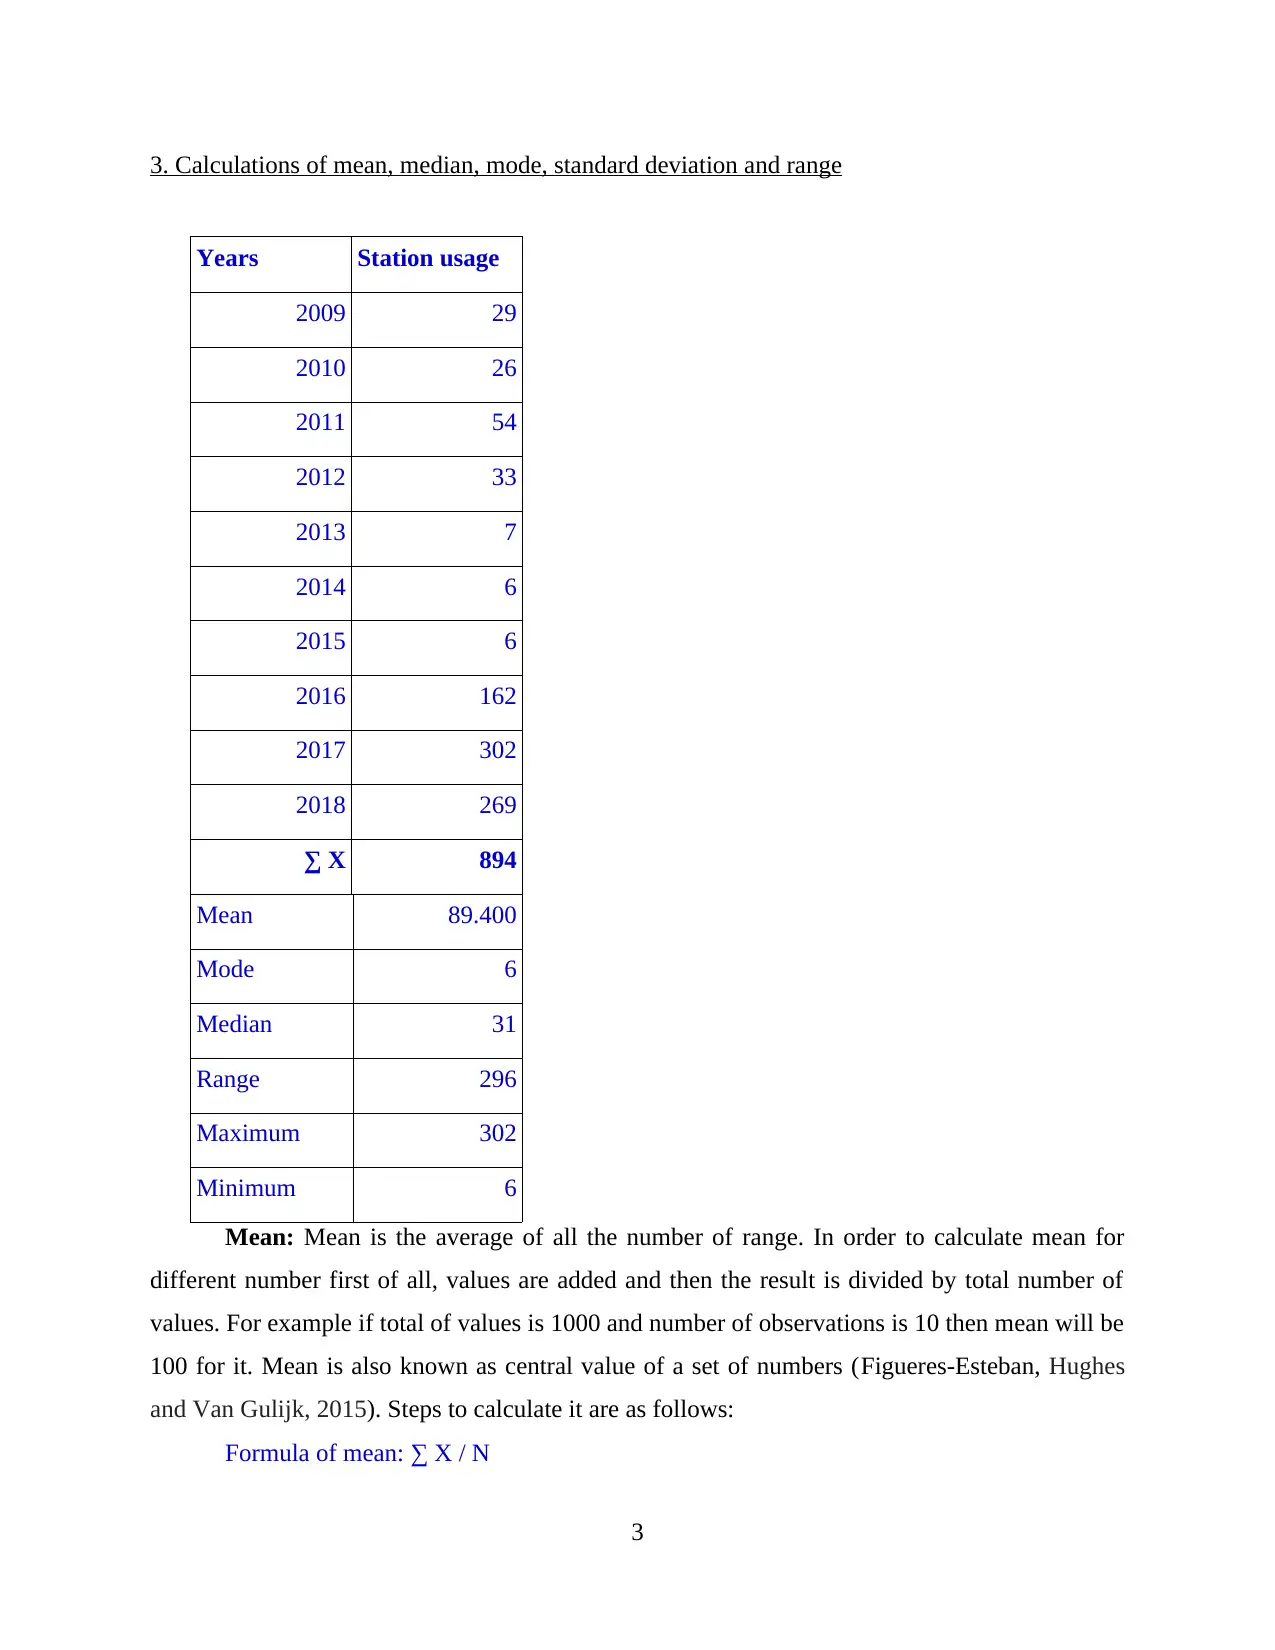
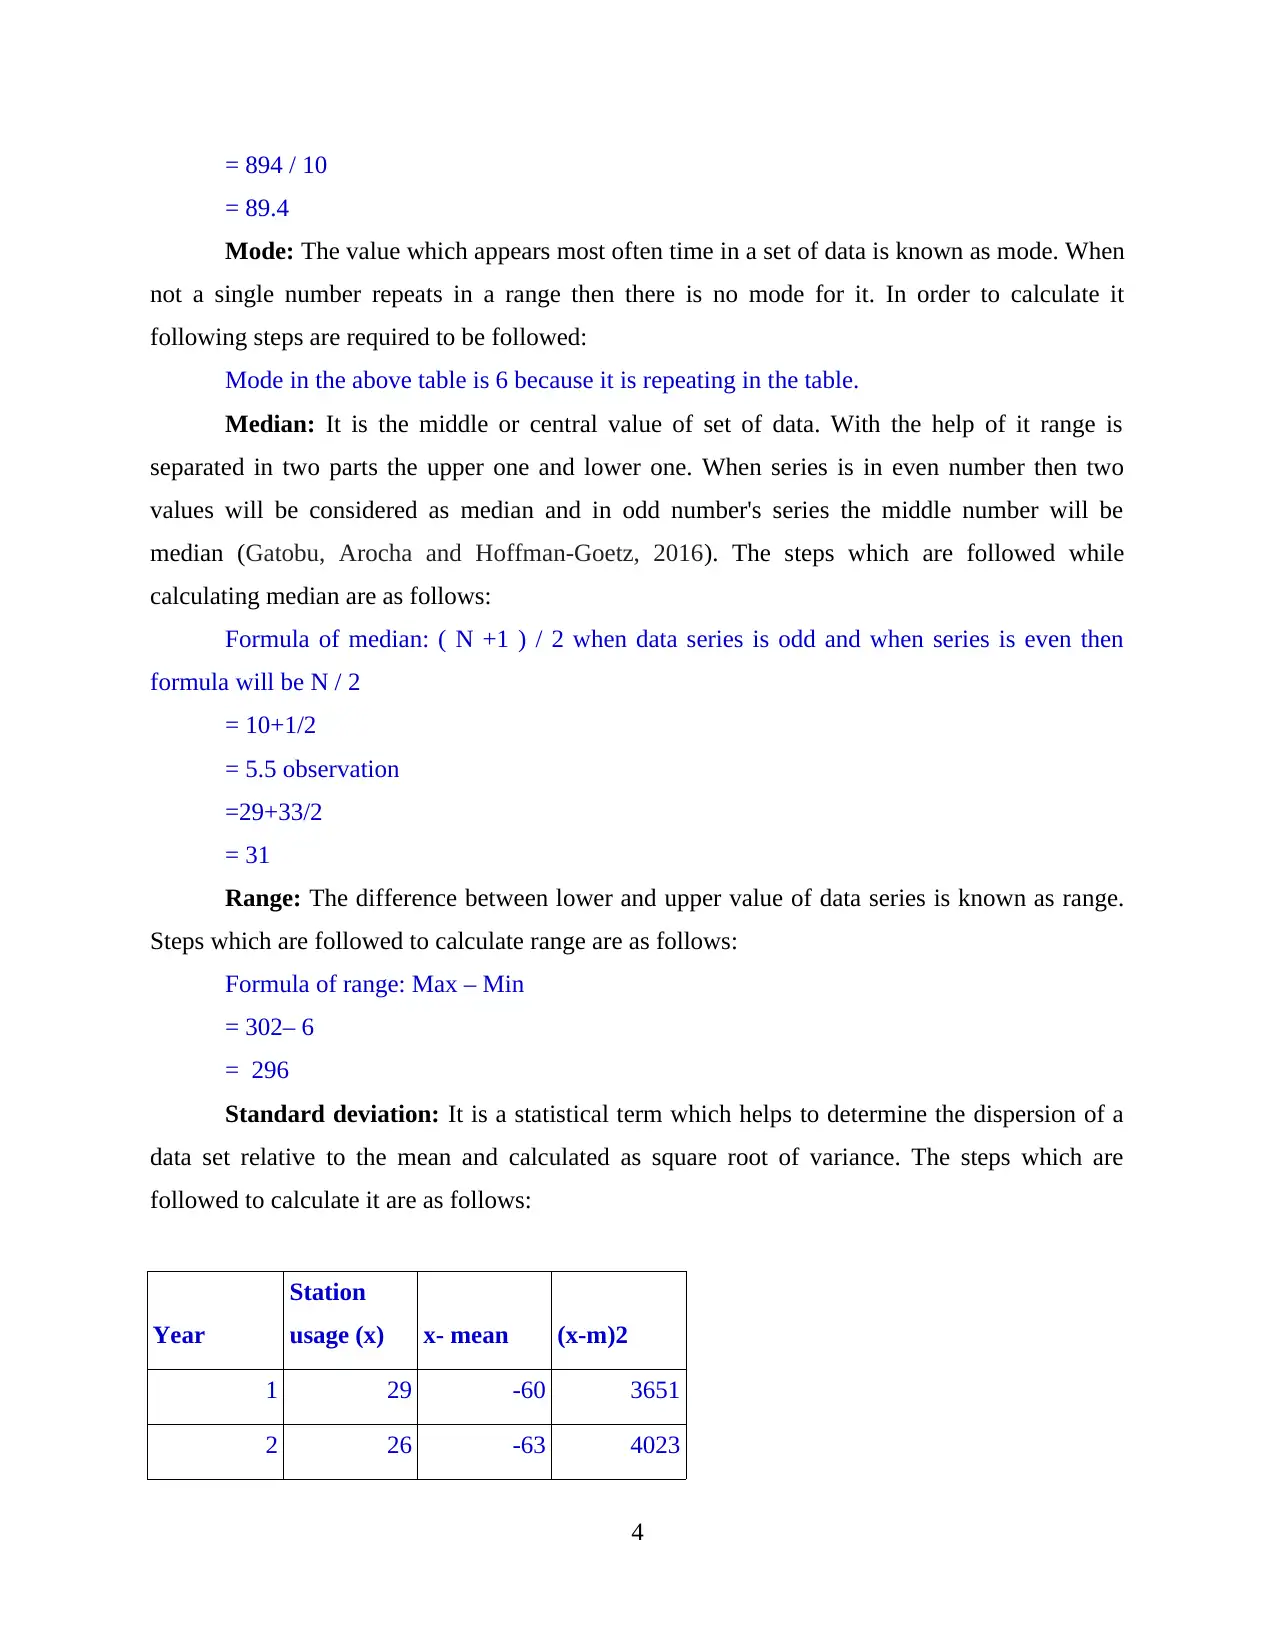
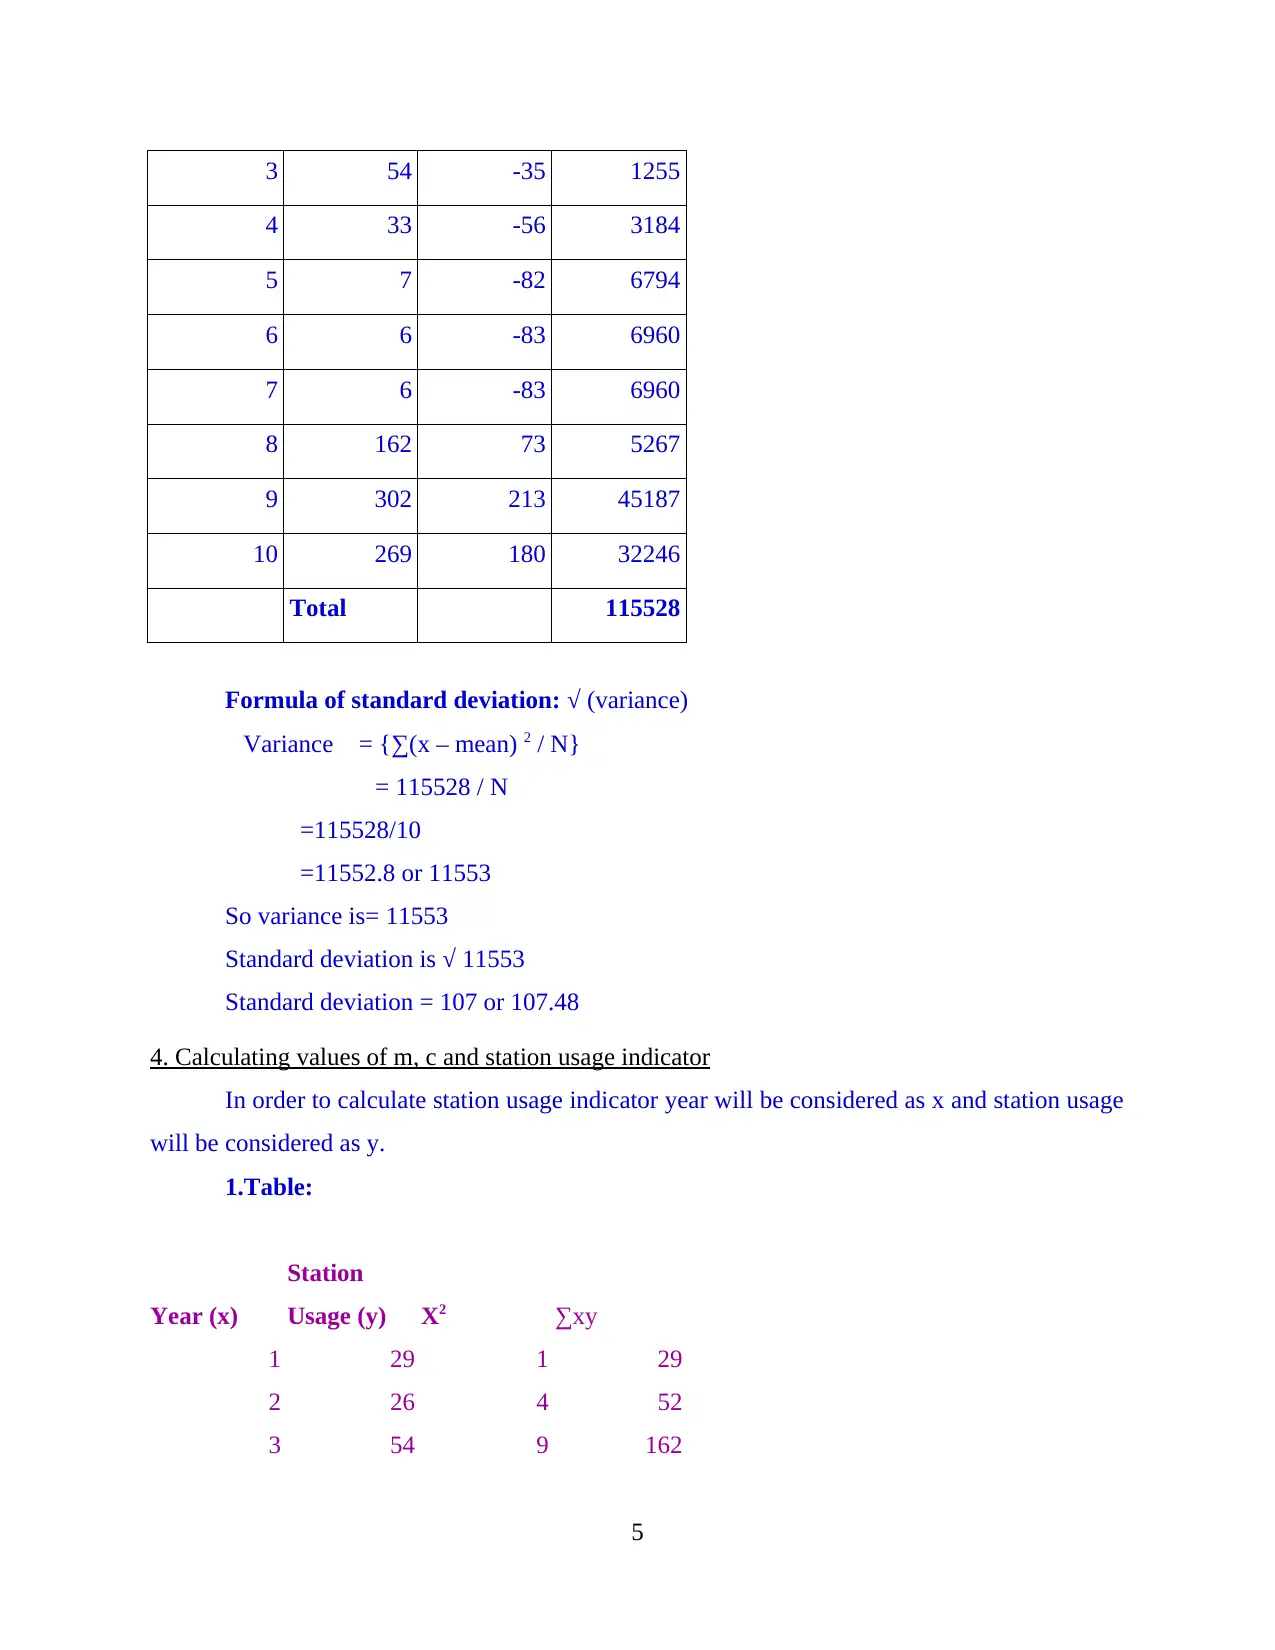
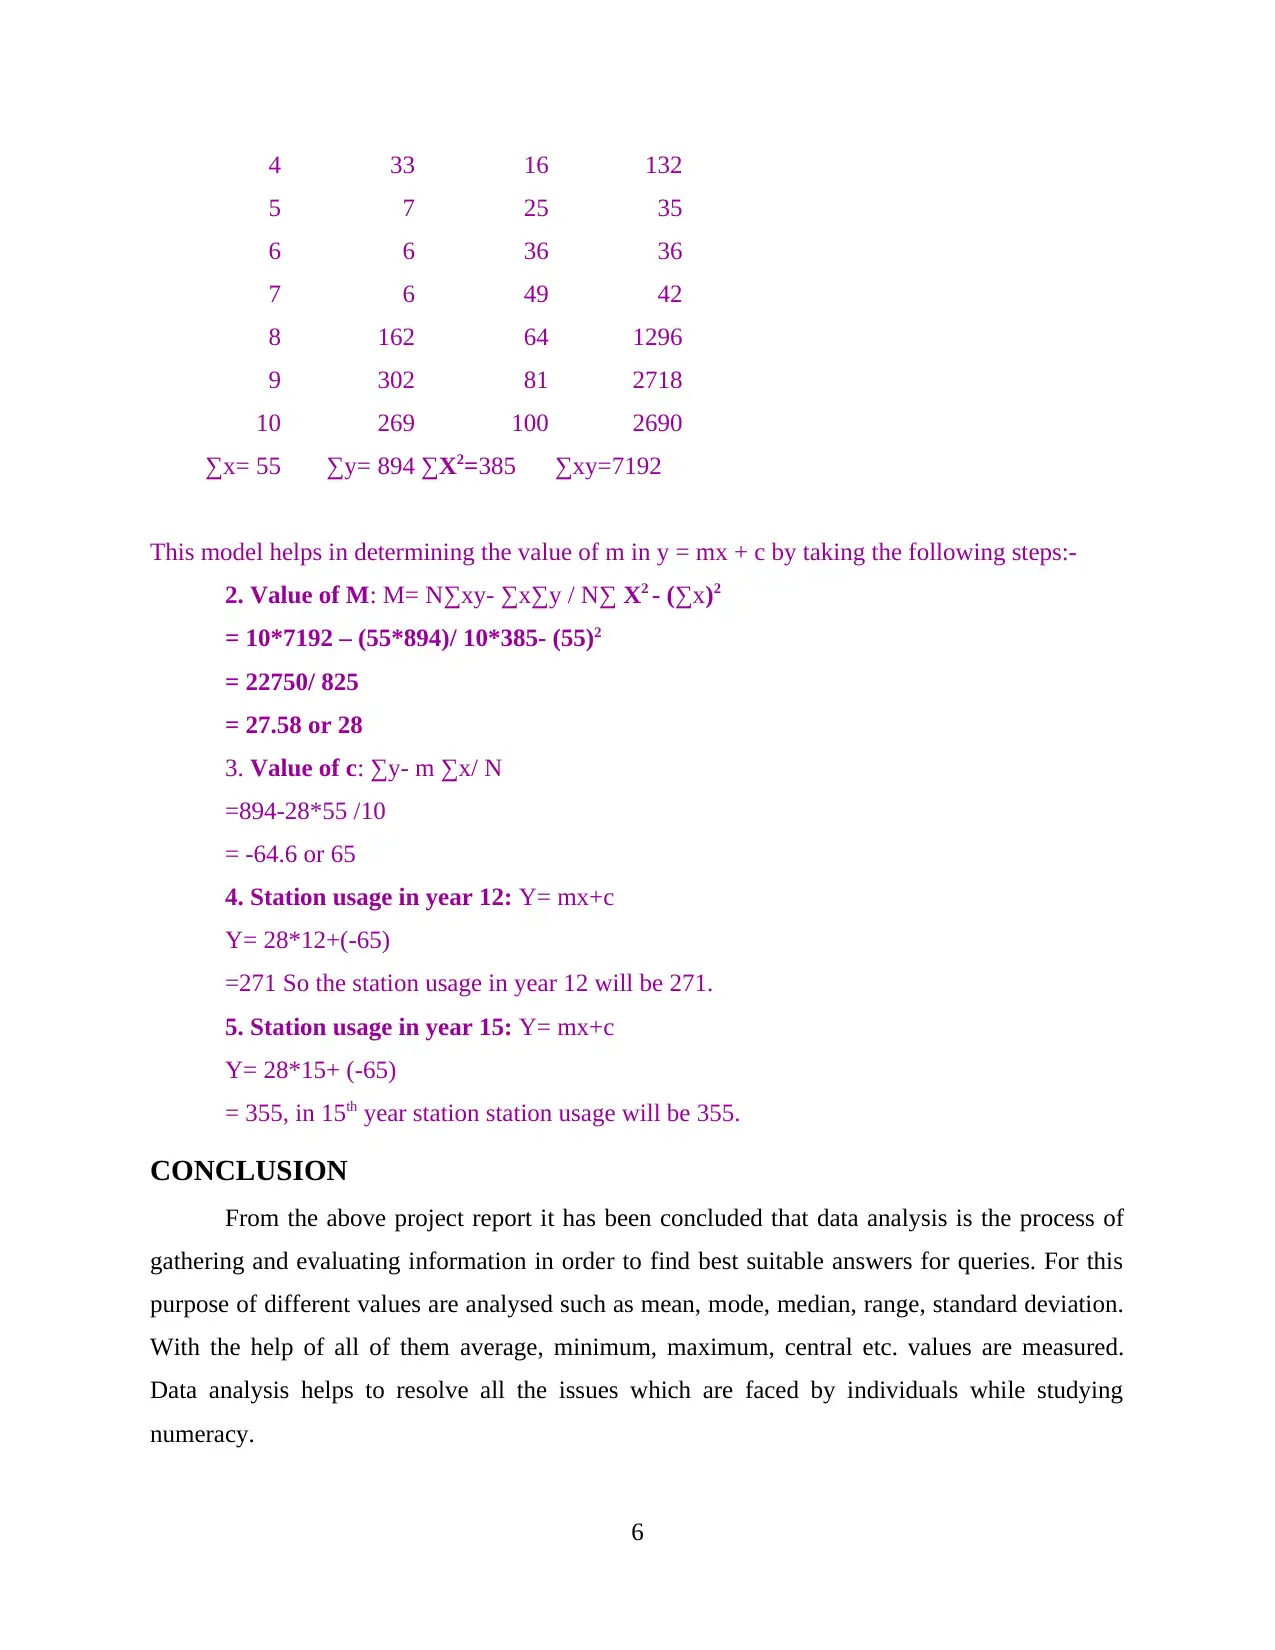
This report provides a comprehensive analysis of data related to Durham Station usage. It begins with an introduction to data analysis and its importance in decision-making. The main body of the report covers the representation of data in tabular form and various charts, including column and line charts, to visualize station usage trends. It proceeds to calculate key statistical measures such as mean, median, mode, range, and standard deviation. The report also includes the calculation of 'm', 'c', and the station usage indicator, providing insights into the relationship between years and station usage. The conclusion summarizes the findings, emphasizing the practical applications of data analysis in understanding and interpreting information. The report includes references to support the analysis and findings.

1 out of 10
Related Documents


Your All-in-One AI-Powered Toolkit for Academic Success.
+13062052269
info@desklib.com
Available 24*7 on WhatsApp / Email
![[object Object]](/_next/static/media/star-bottom.7253800d.svg)
Copyright © 2020–2026 A2Z Services. All Rights Reserved. Developed and managed by ZUCOL.