Numeracy & Data Analysis: Data Analysis & Forecasting - LSC Report

Verified

Added on  2023/06/11

|10
|703
|274
Report
AI Summary
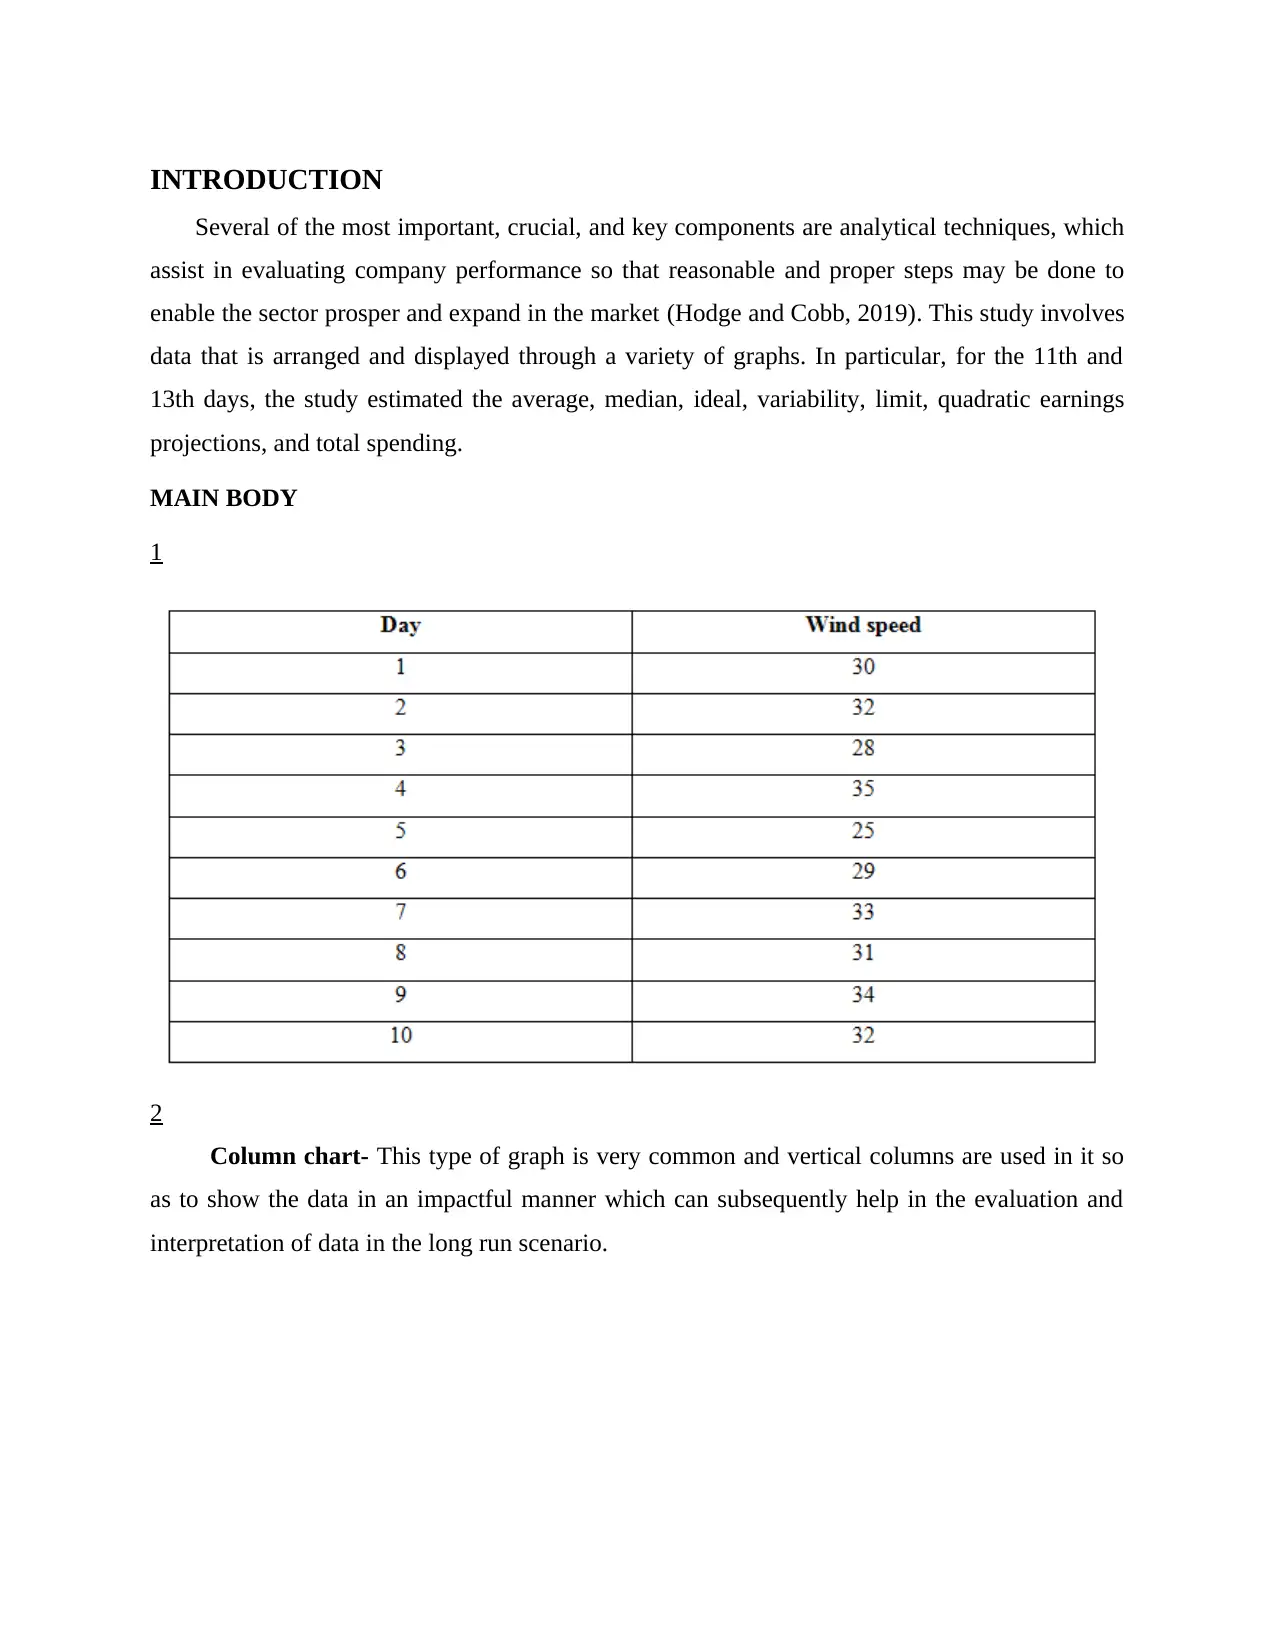
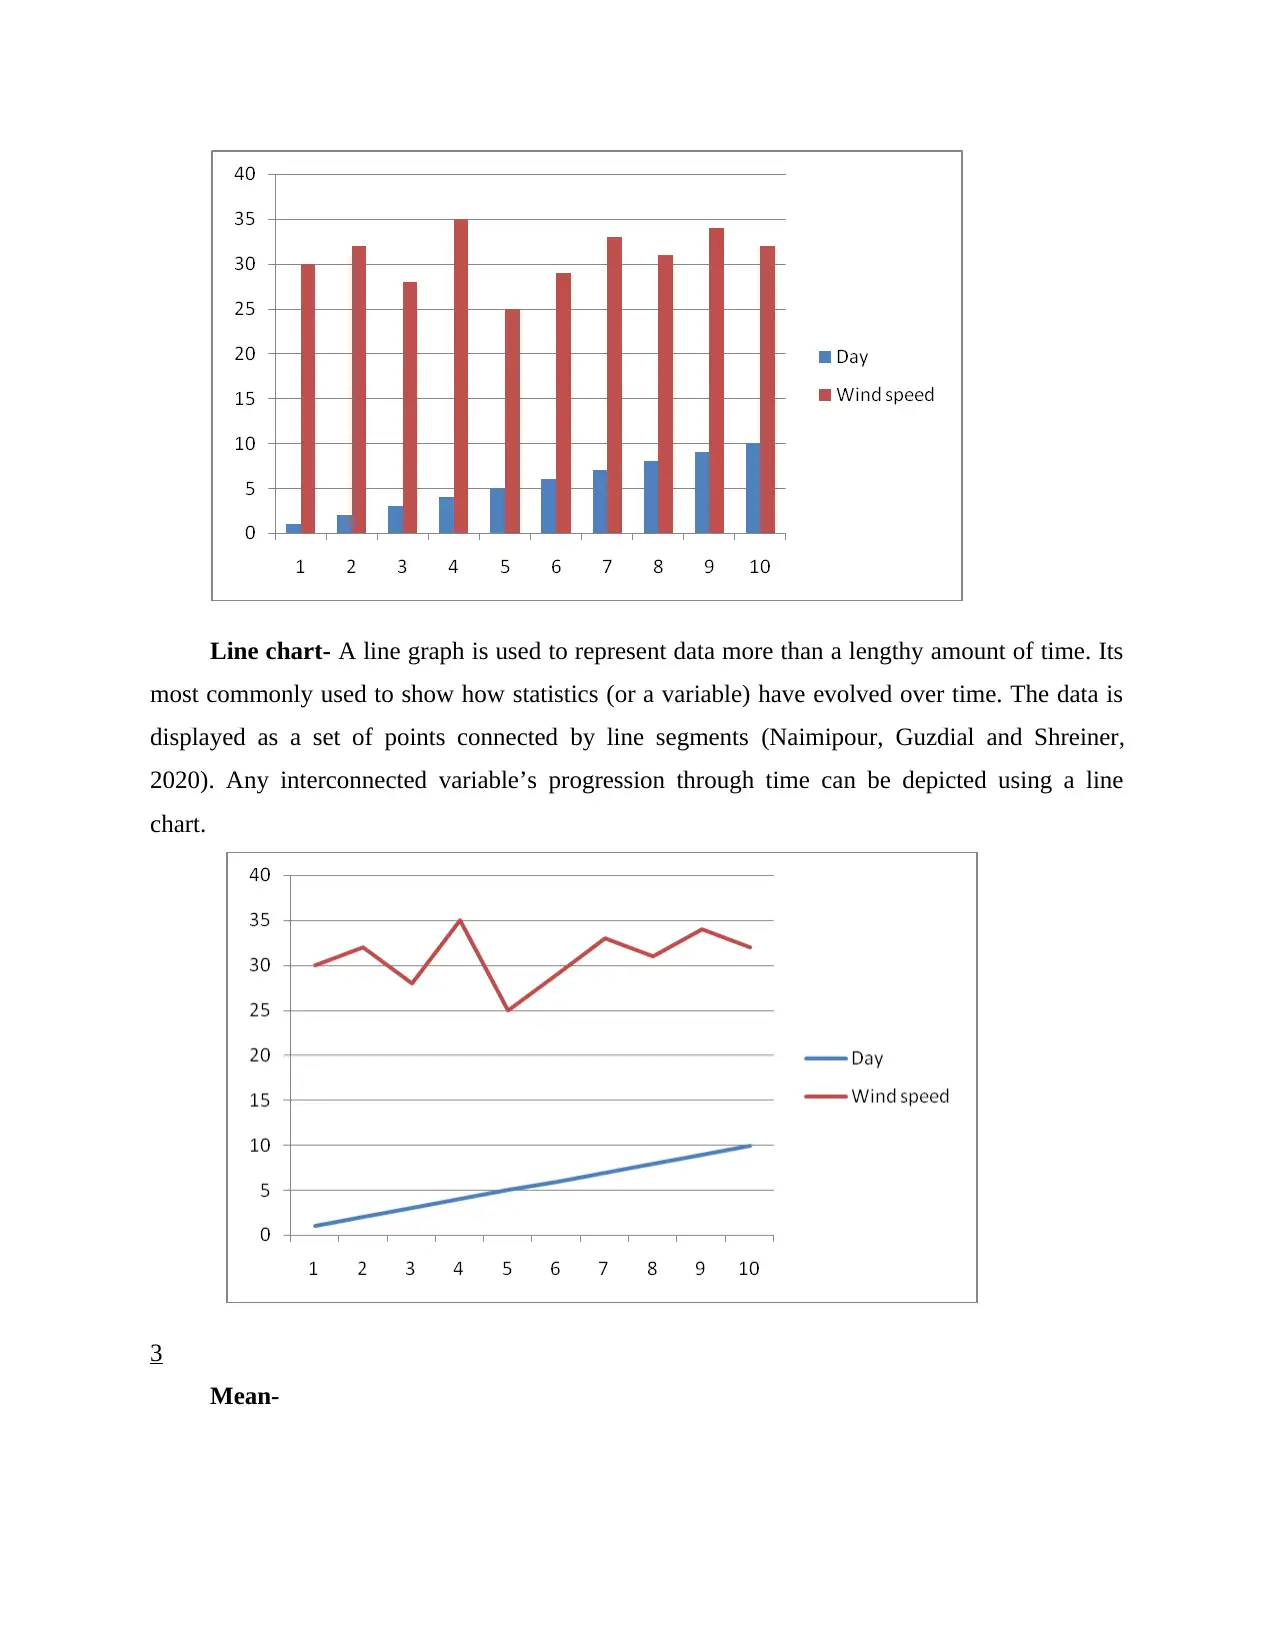
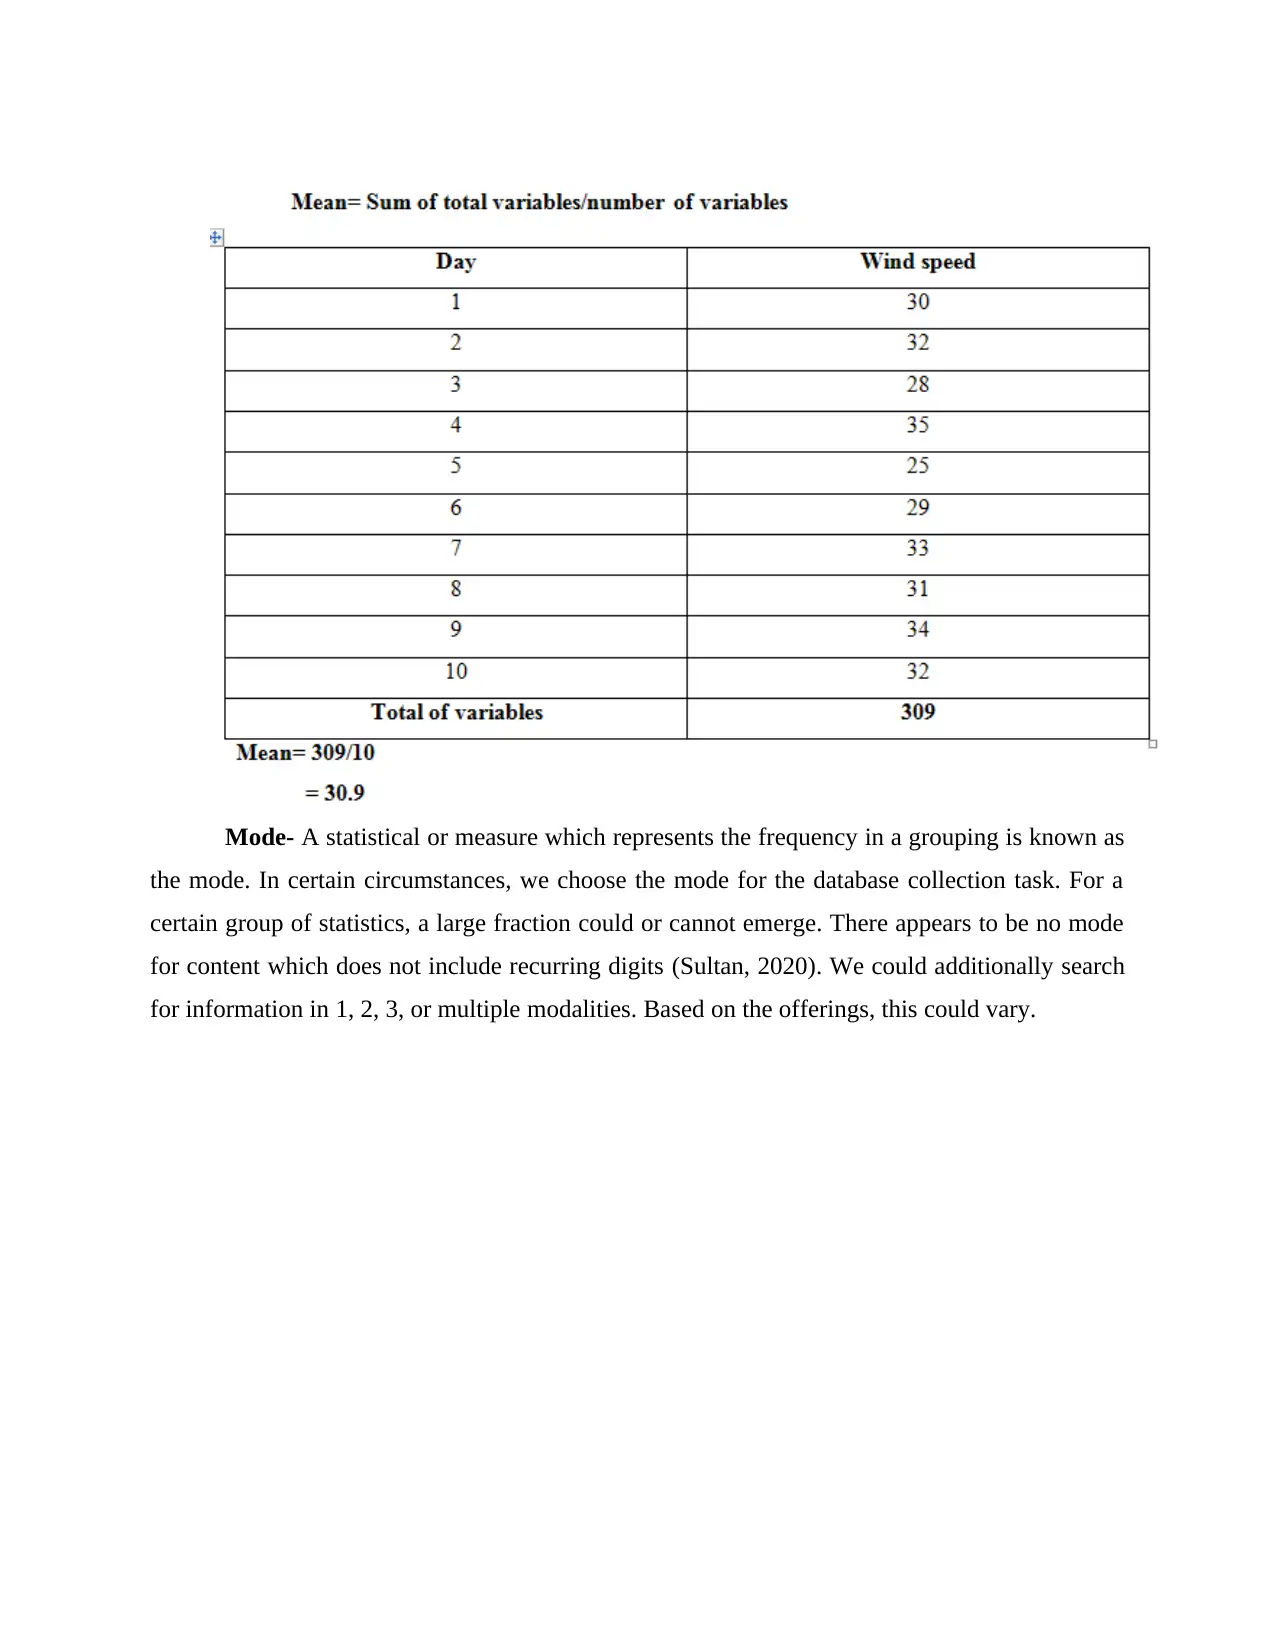
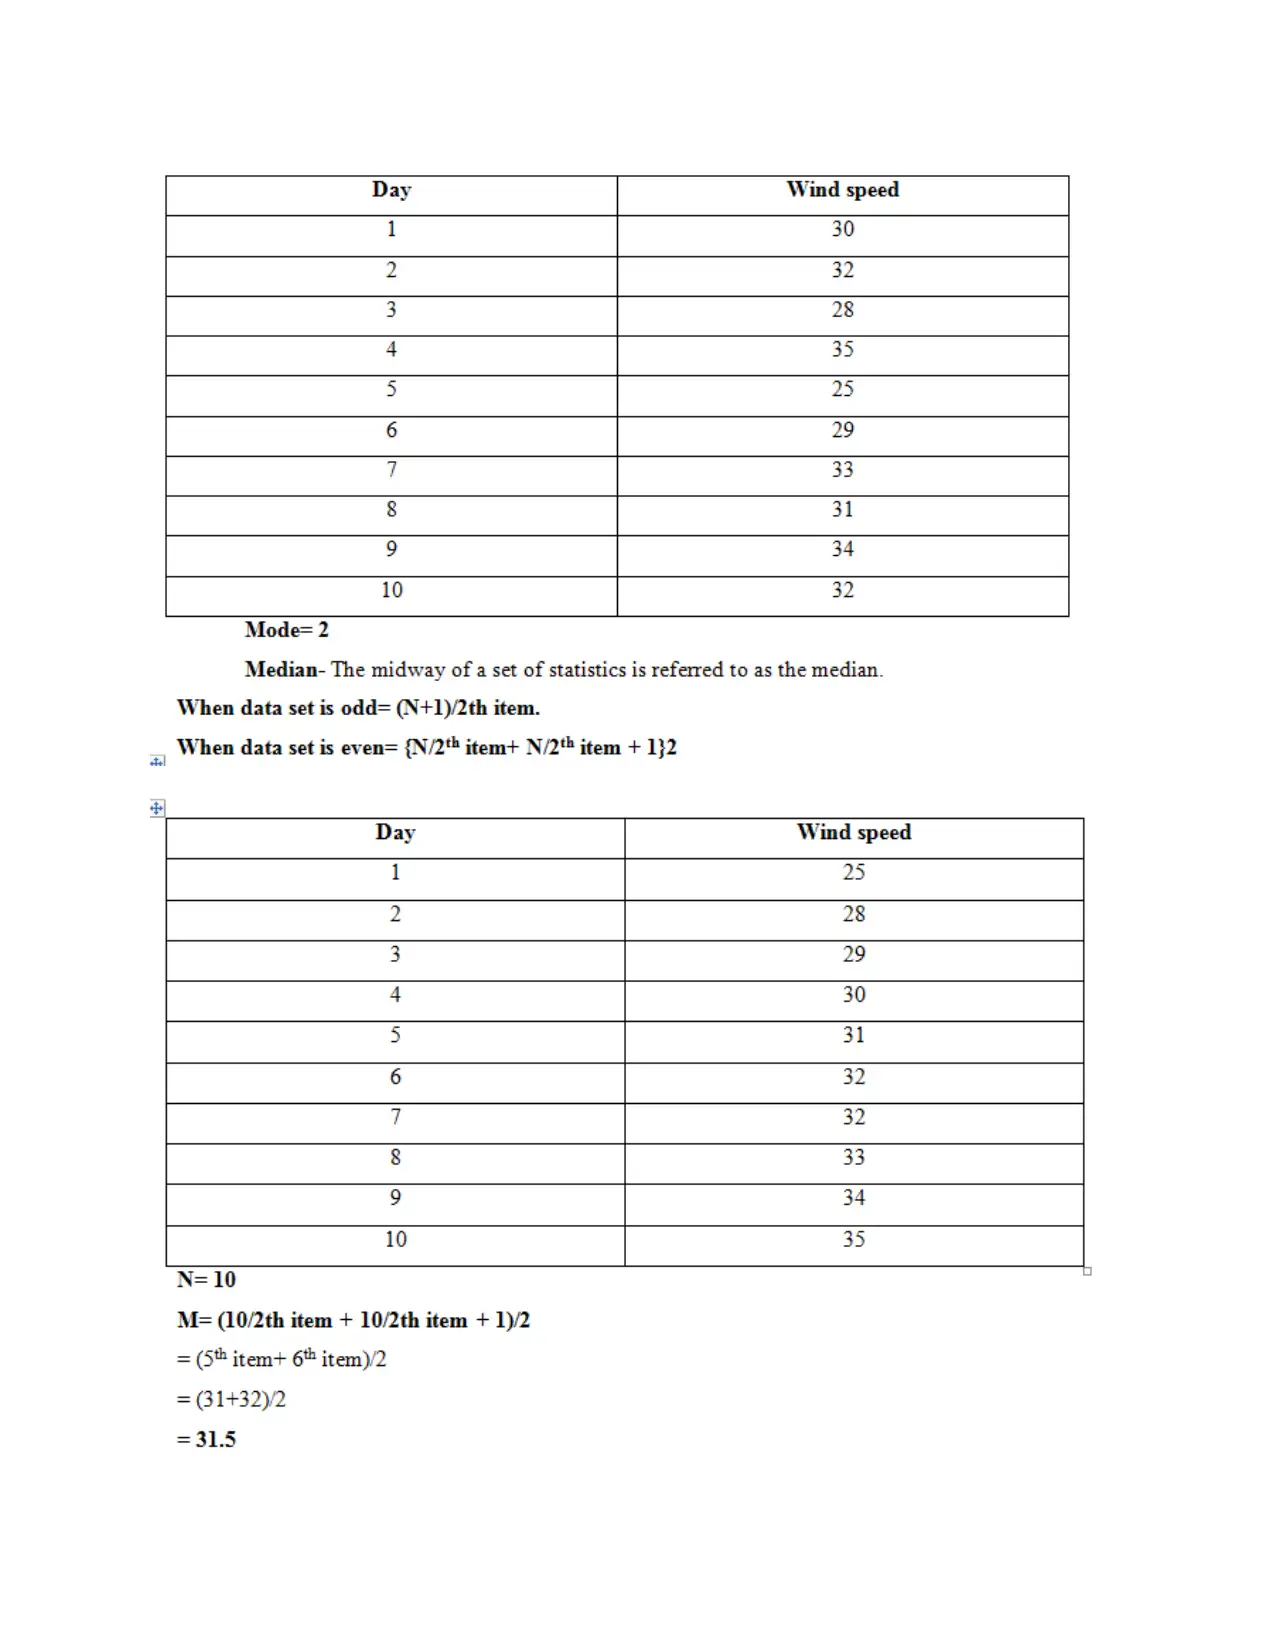
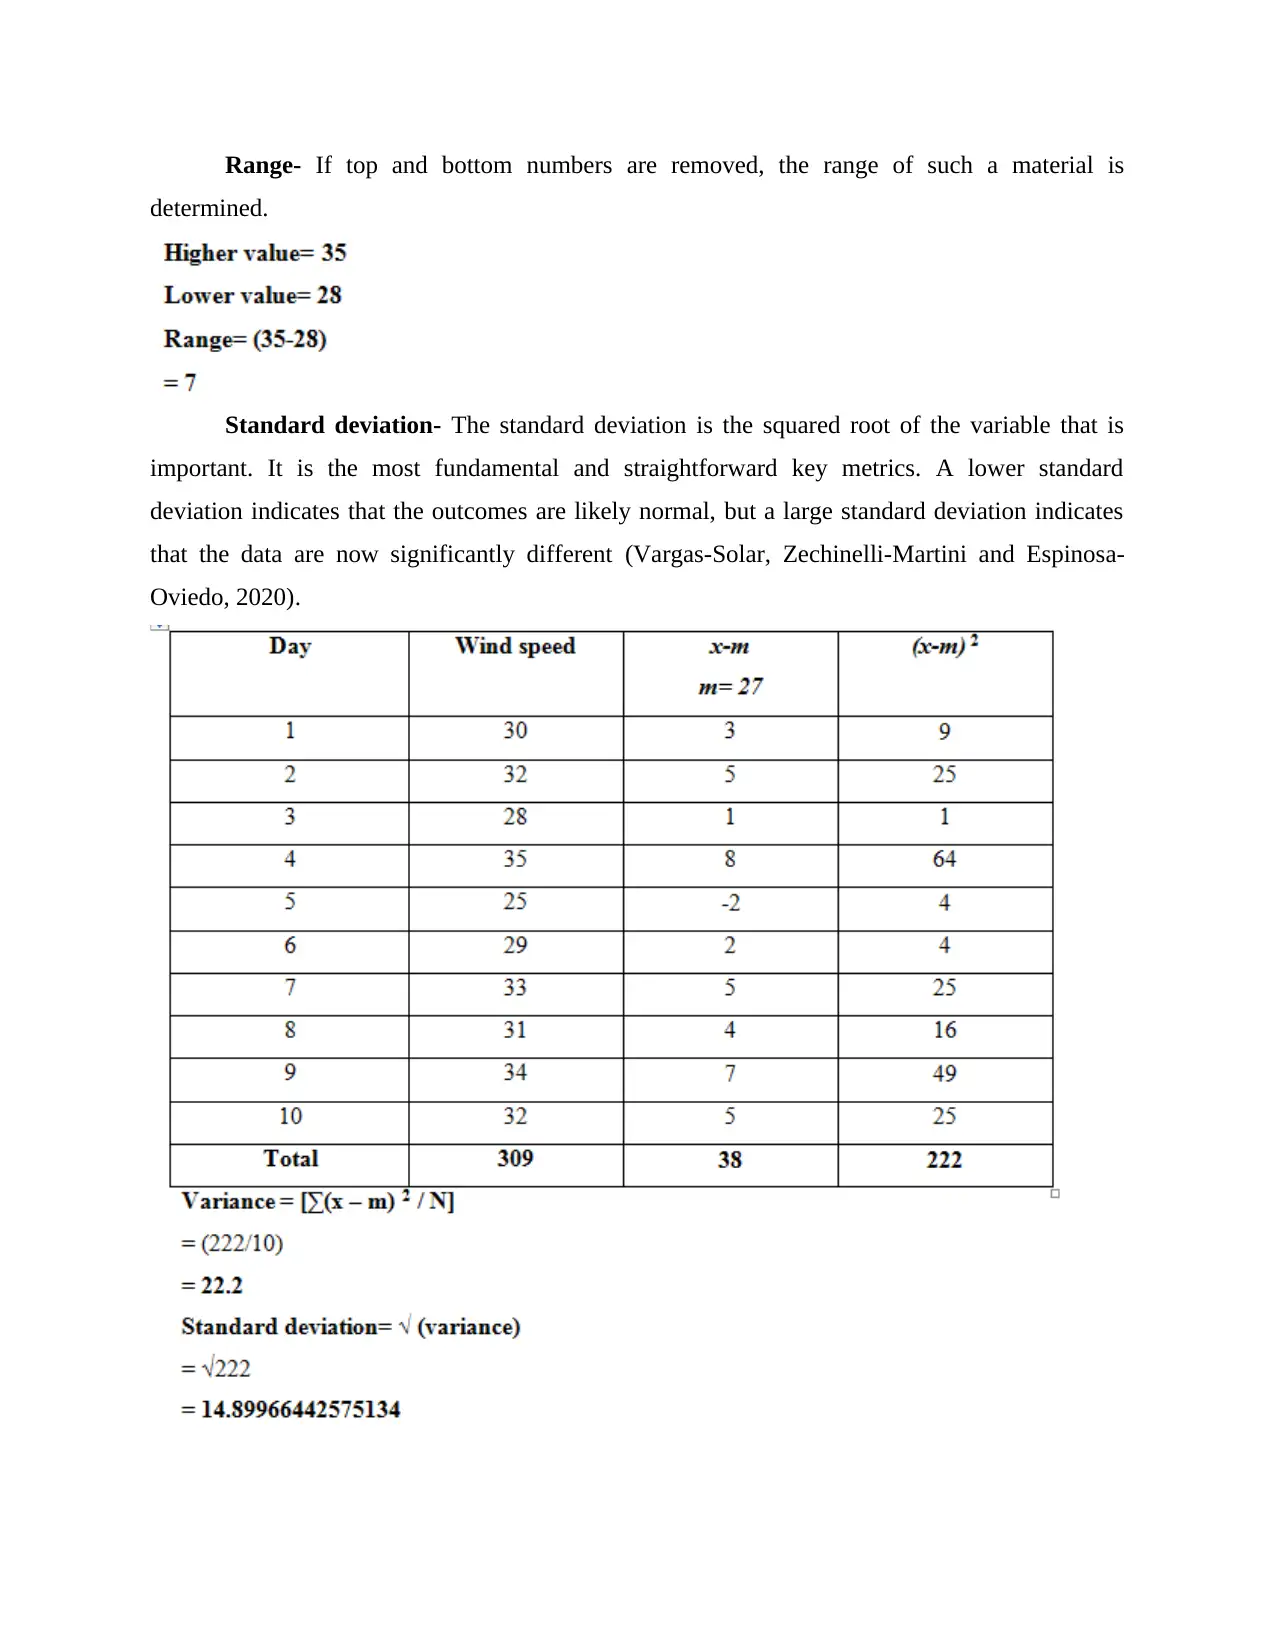
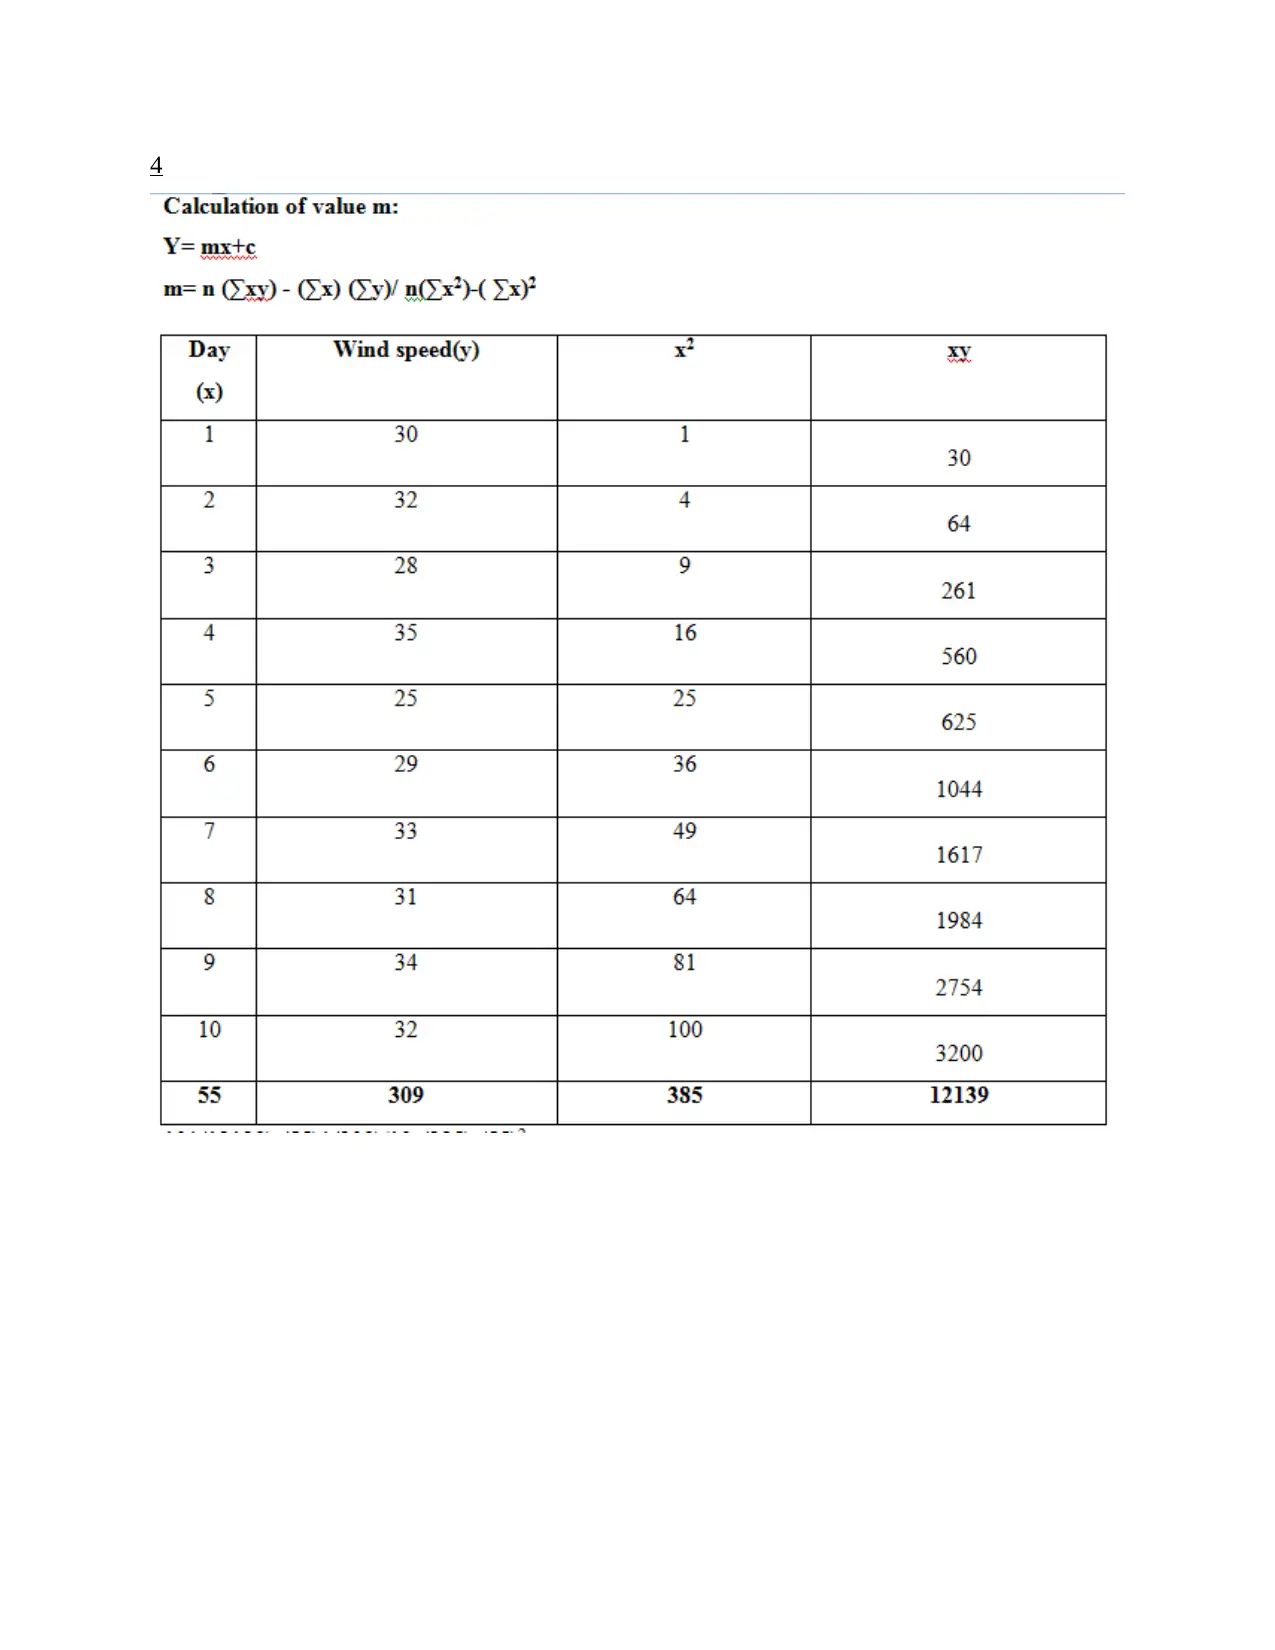
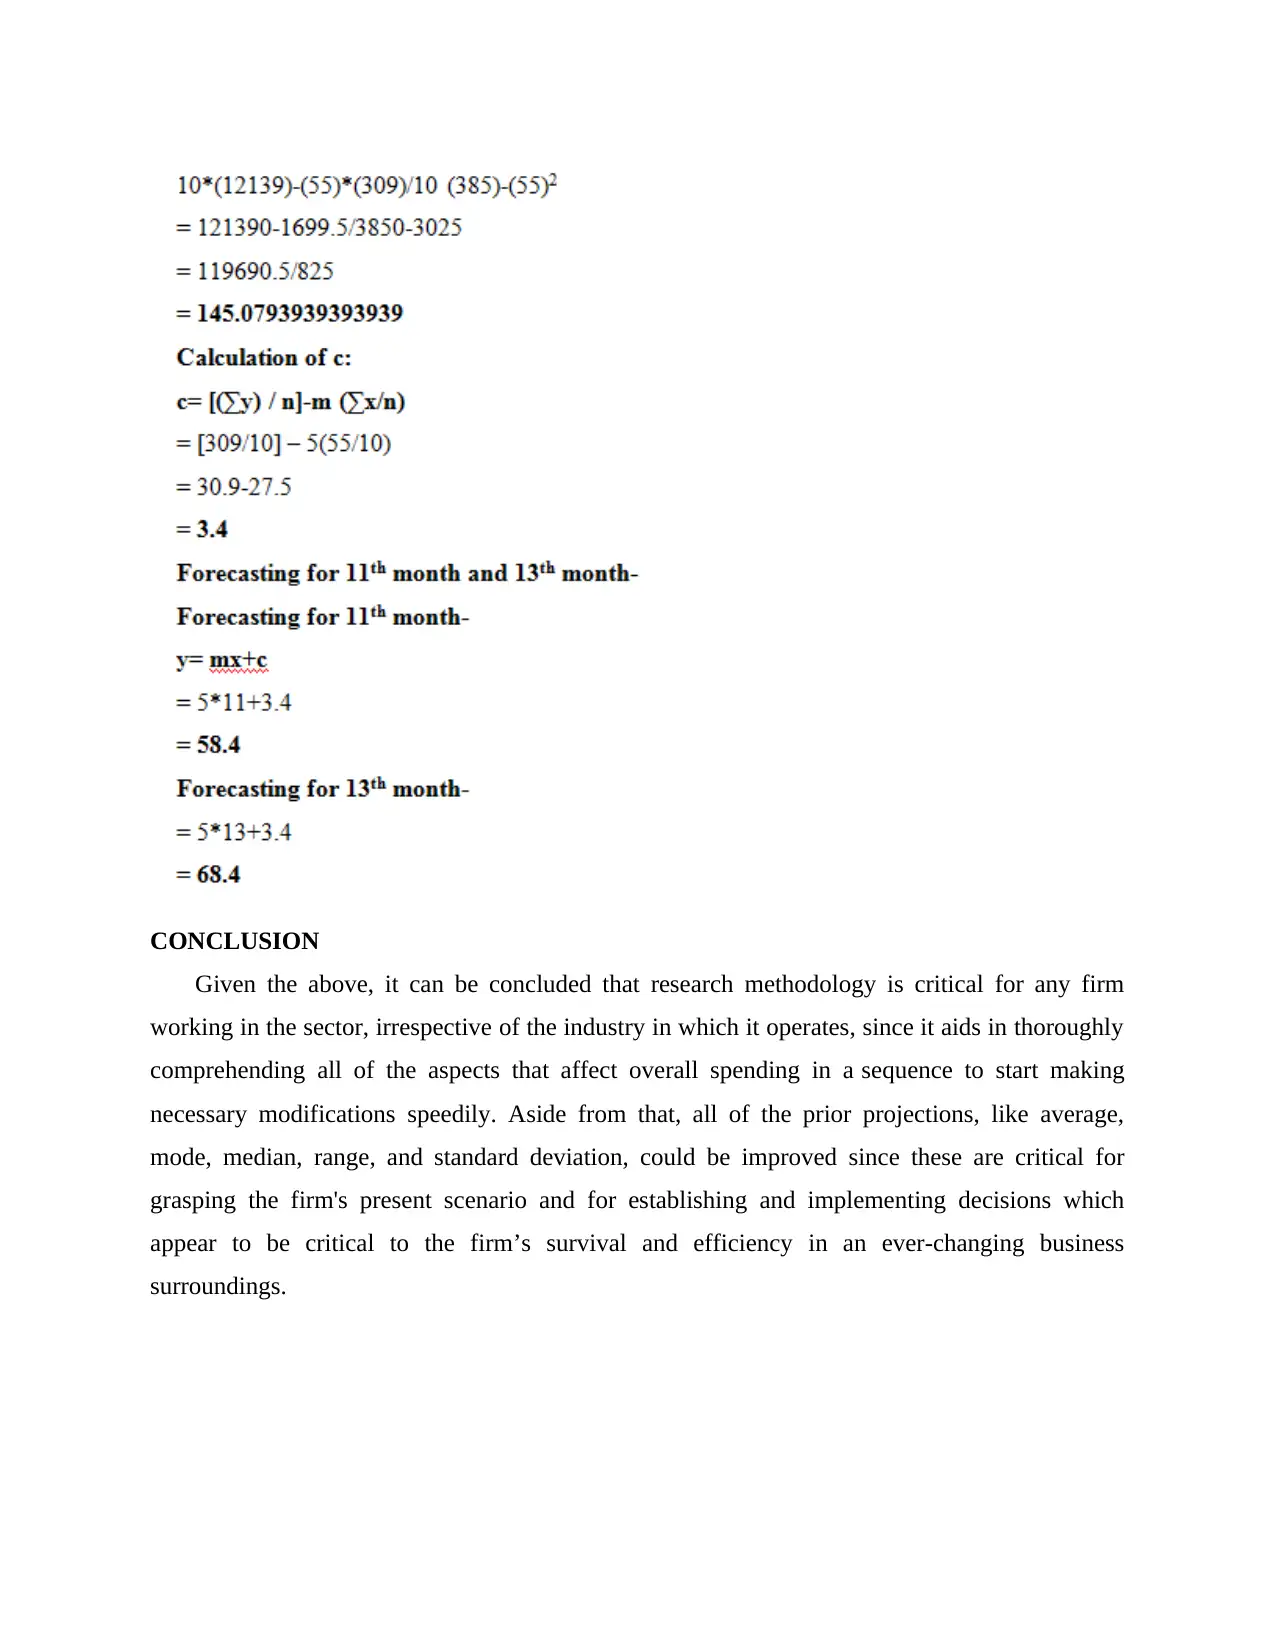
This report focuses on numeracy and data analysis, emphasizing analytical techniques for evaluating company performance and enabling growth. It utilizes various graphs to present data, particularly focusing on estimating the average, median, mode, range, standard deviation, and quadratic earnings projections for specific days. The report highlights the importance of research methodology for businesses to understand factors affecting overall spending and make necessary adjustments. It concludes that improving projections like average, mode, median, range, and standard deviation is crucial for grasping the firm's current scenario and making critical decisions for survival and efficiency in a dynamic business environment. The report references books and journals to support its analysis and findings.
Document Page
Numeracy and data
analysis
tabler-icon-diamond-filled.svg

Paraphrase This Document

Need a fresh take? Get an instant paraphrase of this document with our AI Paraphraser
Document Page
Contents
Contents...........................................................................................................................................2
INTRODUCTION...........................................................................................................................3
MAIN BODY..................................................................................................................................3
1...................................................................................................................................................3
2...................................................................................................................................................3
3...................................................................................................................................................4
4...................................................................................................................................................8
CONCLUSION................................................................................................................................9
REREFRENCES............................................................................................................................10
Document Page
INTRODUCTION
Several of the most important, crucial, and key components are analytical techniques, which
assist in evaluating company performance so that reasonable and proper steps may be done to
enable the sector prosper and expand in the market (Hodge and Cobb, 2019). This study involves
data that is arranged and displayed through a variety of graphs. In particular, for the 11th and
13th days, the study estimated the average, median, ideal, variability, limit, quadratic earnings
projections, and total spending.
MAIN BODY
1
2
Column chart- This type of graph is very common and vertical columns are used in it so
as to show the data in an impactful manner which can subsequently help in the evaluation and
interpretation of data in the long run scenario.
Document Page
Line chart- A line graph is used to represent data more than a lengthy amount of time. Its
most commonly used to show how statistics (or a variable) have evolved over time. The data is
displayed as a set of points connected by line segments (Naimipour, Guzdial and Shreiner,
2020). Any interconnected variable’s progression through time can be depicted using a line
chart.
3
Mean-
tabler-icon-diamond-filled.svg

Paraphrase This Document

Need a fresh take? Get an instant paraphrase of this document with our AI Paraphraser
Document Page
Mode- A statistical or measure which represents the frequency in a grouping is known as
the mode. In certain circumstances, we choose the mode for the database collection task. For a
certain group of statistics, a large fraction could or cannot emerge. There appears to be no mode
for content which does not include recurring digits (Sultan, 2020). We could additionally search
for information in 1, 2, 3, or multiple modalities. Based on the offerings, this could vary.
Document Page
Document Page
Range- If top and bottom numbers are removed, the range of such a material is
determined.
Standard deviation- The standard deviation is the squared root of the variable that is
important. It is the most fundamental and straightforward key metrics. A lower standard
deviation indicates that the outcomes are likely normal, but a large standard deviation indicates
that the data are now significantly different (Vargas-Solar, Zechinelli-Martini and Espinosa-
Oviedo, 2020).
tabler-icon-diamond-filled.svg

Paraphrase This Document

Need a fresh take? Get an instant paraphrase of this document with our AI Paraphraser
Document Page
4
Document Page
CONCLUSION
Given the above, it can be concluded that research methodology is critical for any firm
working in the sector, irrespective of the industry in which it operates, since it aids in thoroughly
comprehending all of the aspects that affect overall spending in a sequence to start making
necessary modifications speedily. Aside from that, all of the prior projections, like average,
mode, median, range, and standard deviation, could be improved since these are critical for
grasping the firm's present scenario and for establishing and implementing decisions which
appear to be critical to the firm’s survival and efficiency in an ever-changing business
surroundings.
Document Page
REREFRENCES
Books and journals
Hodge, L. L. and Cobb, P., 2019. Two views of culture and their implications for mathematics
teaching and learning. Urban Education. 54(6). pp.860-884.
Naimipour, B., Guzdial, M. and Shreiner, T., 2020, October. Engaging Pre-Service Teachers in
Front-End Design: Developing Technology for a Social Studies Classroom. In 2020
IEEE Frontiers in Education Conference (FIE) (pp. 1-9). IEEE.
Sultan, J.B., 2020. Characteristics of remedial students in learning numeracy and programs that
enhance the achievement.
Vargas-Solar, G., Zechinelli-Martini, J.L. and Espinosa-Oviedo, J.A., 2020, August. Enacting
data science pipelines for exploring graphs: from libraries to studios. In ADBIS, TPDL
and EDA 2020 Common Workshops and Doctoral Consortium (pp. 271-280). Springer,
Cham.
chevron_up_icon
1 out of 10
circle_padding
hide_on_mobile
zoom_out_icon
[object Object]