Assessment of Numeracy, Data, and IT Content for Analysis Assignment
VerifiedAdded on 2023/01/06
|19
|4611
|2
Homework Assignment
AI Summary
This assignment solution delves into various aspects of numeracy, data analysis, and IT skills. Part 1 covers fundamental concepts like fractions, percentages, and basic calculations. Part 2 analyzes data from Olympic games, focusing on medal counts and rankings. Part 3 provides detailed Excel-based solutions, including ranking methods and data visualization techniques. The assignment demonstrates practical application of these skills, offering insights into data interpretation and problem-solving within different contexts. The document incorporates references to support the presented information and analysis.
Using Numeracy, Data &
IT
IT
Paraphrase This Document
Need a fresh take? Get an instant paraphrase of this document with our AI Paraphraser

Contents
INTRODUCTION...........................................................................................................................................4
PART 1.........................................................................................................................................................4
Q. 1..........................................................................................................................................................4
Q. 2..........................................................................................................................................................5
Q. 3..........................................................................................................................................................5
Q. 4..........................................................................................................................................................5
Q. 5..........................................................................................................................................................5
Q. 6..........................................................................................................................................................6
Q. 7..........................................................................................................................................................6
Q. 8..........................................................................................................................................................7
Q. 9..........................................................................................................................................................7
Q. 10........................................................................................................................................................7
PART 2.........................................................................................................................................................8
Q. 11 .......................................................................................................................................................8
PART 3.......................................................................................................................................................10
Q. 12......................................................................................................................................................10
Q. 13......................................................................................................................................................11
Q. 14......................................................................................................................................................14
Q. 15......................................................................................................................................................16
Q. 16......................................................................................................................................................17
CONCLUSION.............................................................................................................................................18
REFERENCES..............................................................................................................................................19
⊘ This is a preview!⊘
Do you want full access?
Subscribe today to unlock all pages.
Trusted by 1+ million students worldwide
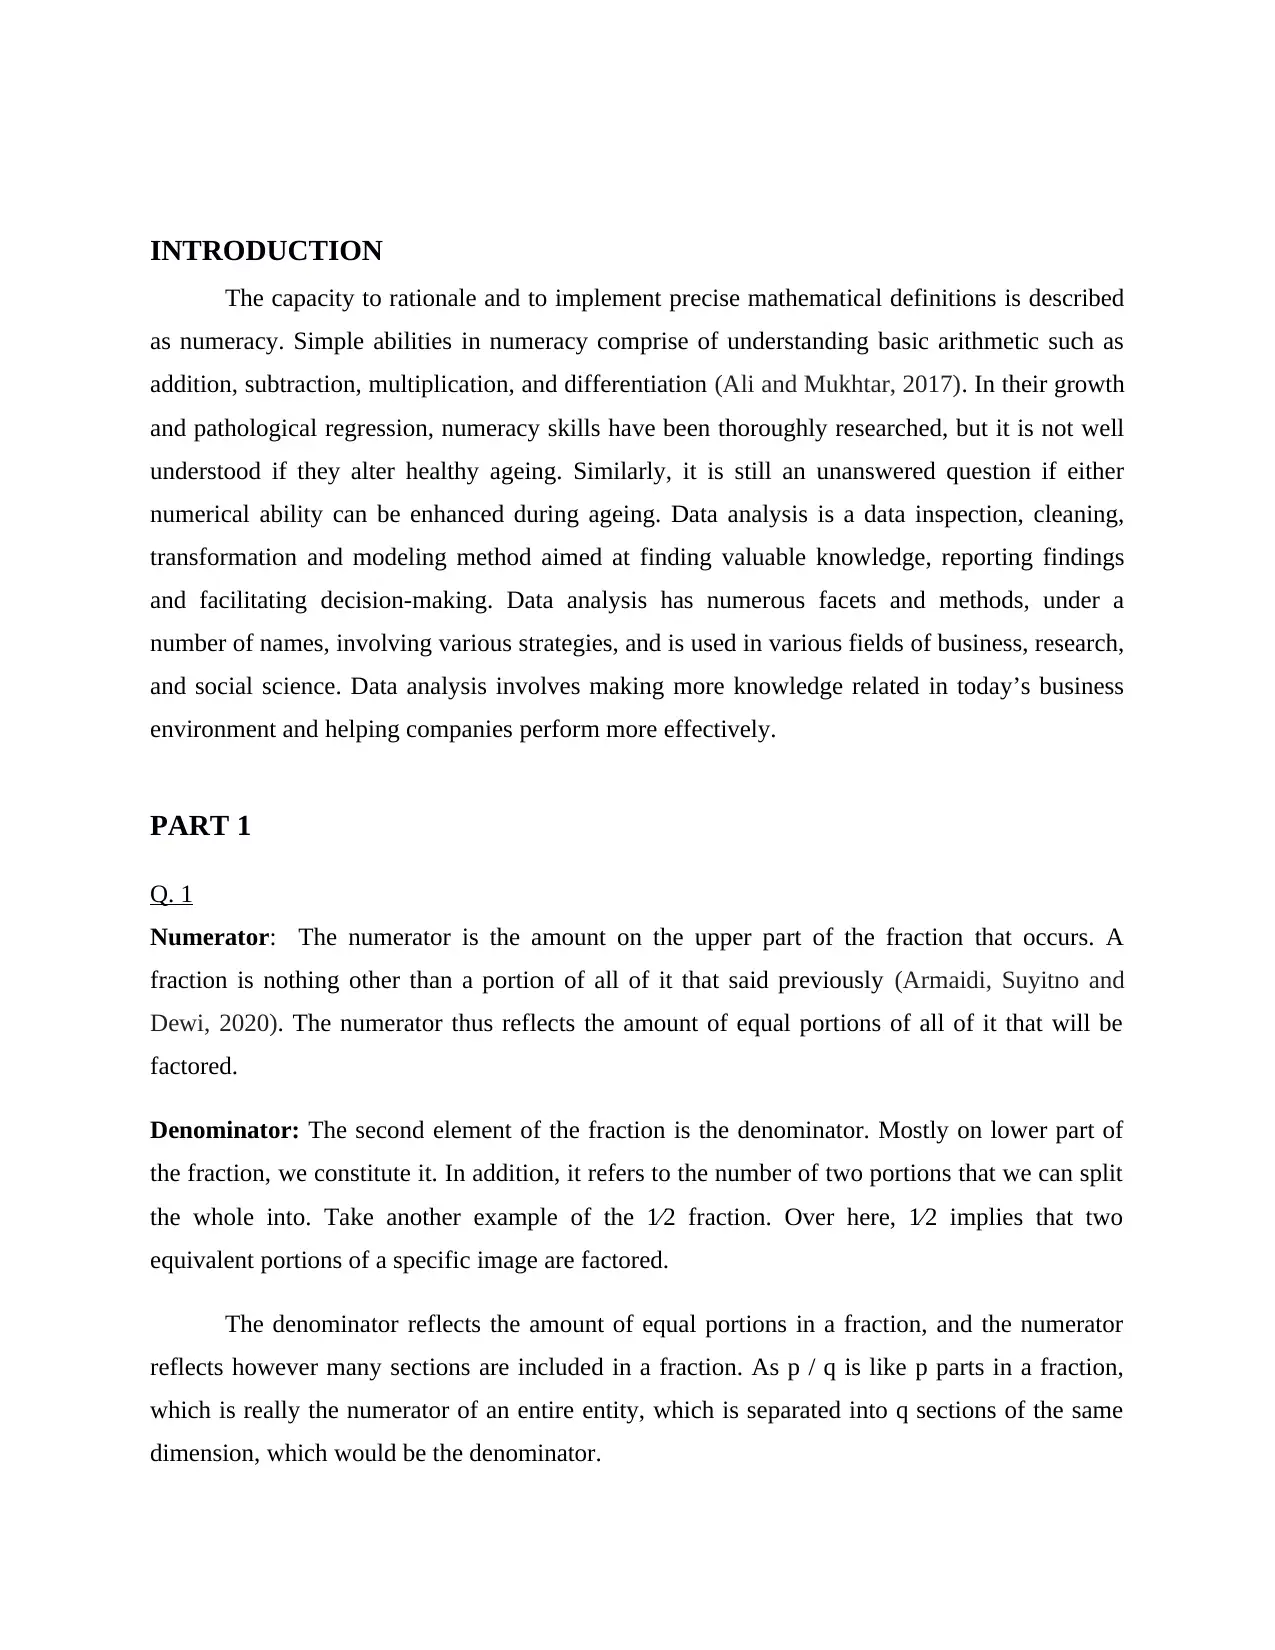
INTRODUCTION
The capacity to rationale and to implement precise mathematical definitions is described
as numeracy. Simple abilities in numeracy comprise of understanding basic arithmetic such as
addition, subtraction, multiplication, and differentiation (Ali and Mukhtar, 2017). In their growth
and pathological regression, numeracy skills have been thoroughly researched, but it is not well
understood if they alter healthy ageing. Similarly, it is still an unanswered question if either
numerical ability can be enhanced during ageing. Data analysis is a data inspection, cleaning,
transformation and modeling method aimed at finding valuable knowledge, reporting findings
and facilitating decision-making. Data analysis has numerous facets and methods, under a
number of names, involving various strategies, and is used in various fields of business, research,
and social science. Data analysis involves making more knowledge related in today’s business
environment and helping companies perform more effectively.
PART 1
Q. 1
Numerator: The numerator is the amount on the upper part of the fraction that occurs. A
fraction is nothing other than a portion of all of it that said previously (Armaidi, Suyitno and
Dewi, 2020). The numerator thus reflects the amount of equal portions of all of it that will be
factored.
Denominator: The second element of the fraction is the denominator. Mostly on lower part of
the fraction, we constitute it. In addition, it refers to the number of two portions that we can split
the whole into. Take another example of the 1⁄2 fraction. Over here, 1⁄2 implies that two
equivalent portions of a specific image are factored.
The denominator reflects the amount of equal portions in a fraction, and the numerator
reflects however many sections are included in a fraction. As p / q is like p parts in a fraction,
which is really the numerator of an entire entity, which is separated into q sections of the same
dimension, which would be the denominator.
Paraphrase This Document
Need a fresh take? Get an instant paraphrase of this document with our AI Paraphraser
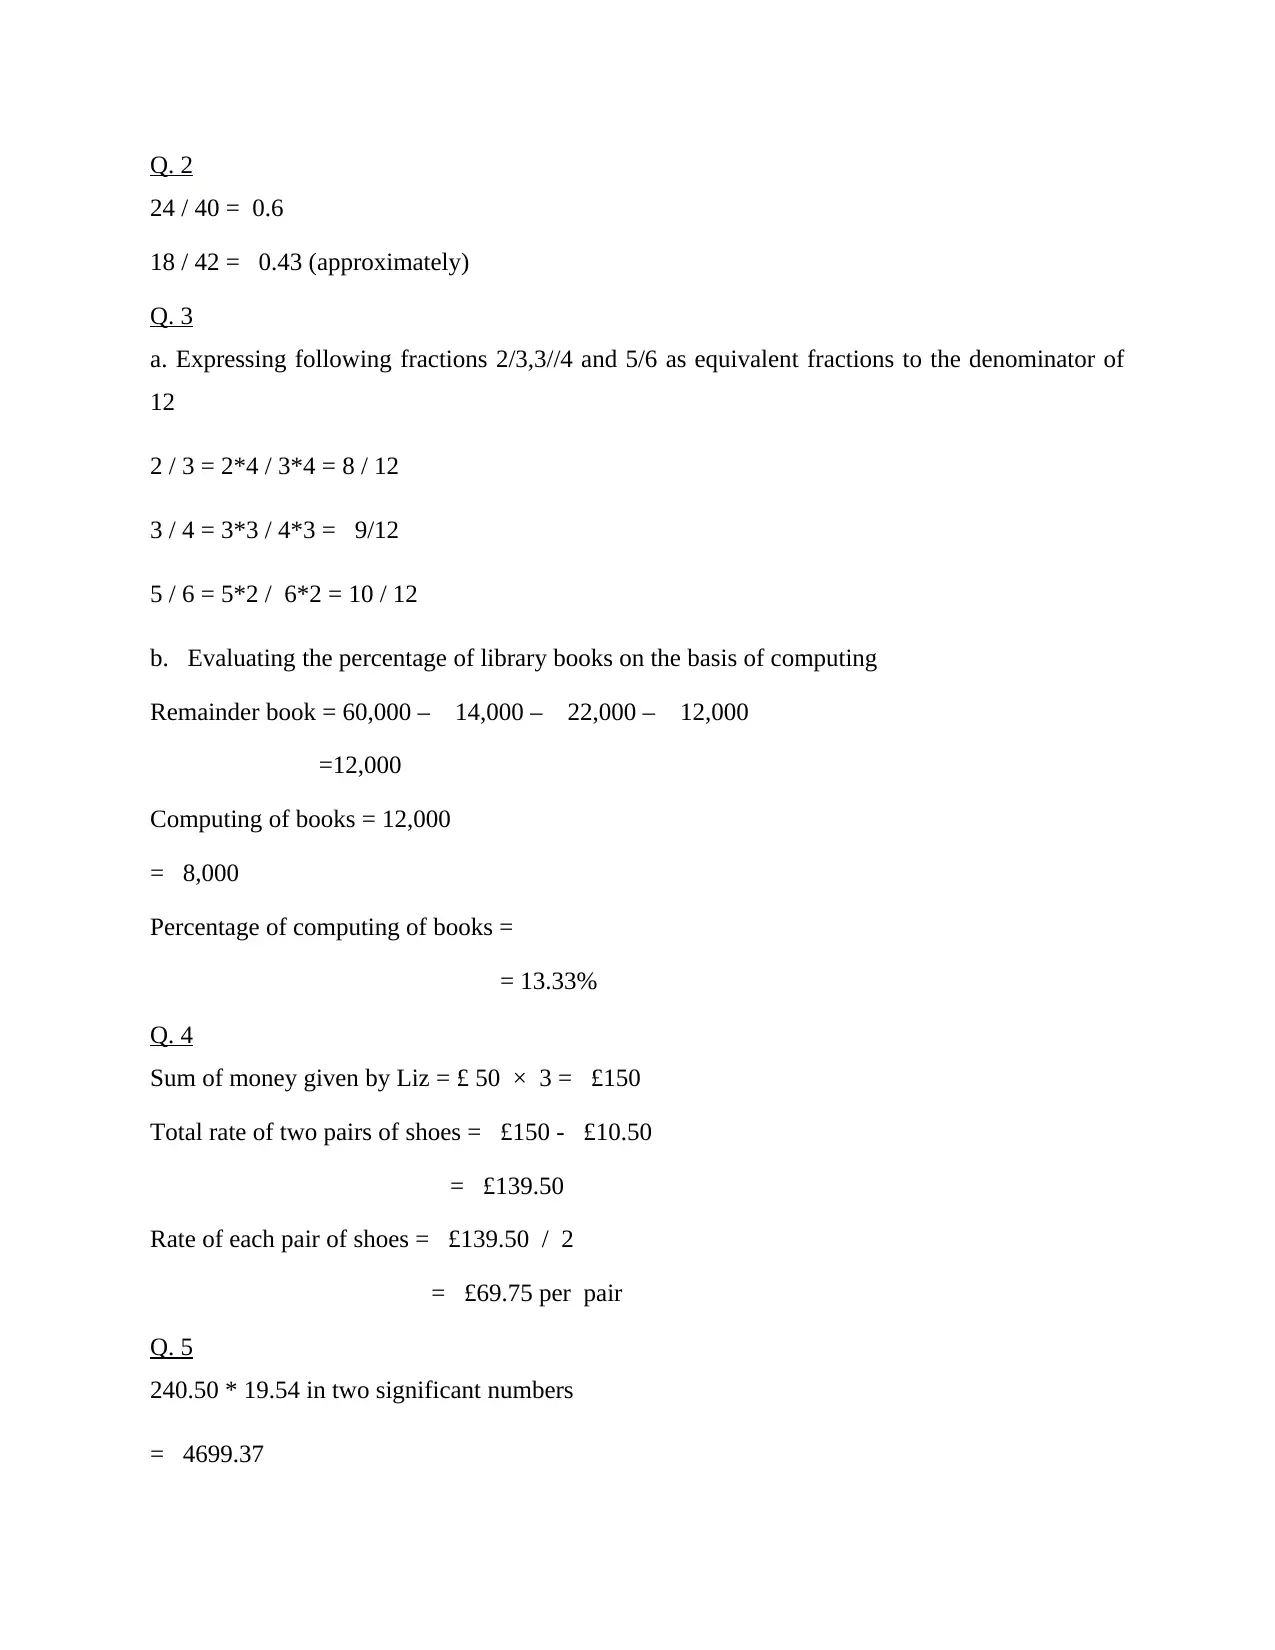
Q. 2
24 / 40 = 0.6
18 / 42 = 0.43 (approximately)
Q. 3
a. Expressing following fractions 2/3,3//4 and 5/6 as equivalent fractions to the denominator of
12
2 / 3 = 2*4 / 3*4 = 8 / 12
3 / 4 = 3*3 / 4*3 = 9/12
5 / 6 = 5*2 / 6*2 = 10 / 12
b. Evaluating the percentage of library books on the basis of computing
Remainder book = 60,000 – 14,000 – 22,000 – 12,000
=12,000
Computing of books = 12,000
= 8,000
Percentage of computing of books =
= 13.33%
Q. 4
Sum of money given by Liz = £ 50 × 3 = £150
Total rate of two pairs of shoes = £150 - £10.50
= £139.50
Rate of each pair of shoes = £139.50 / 2
= £69.75 per pair
Q. 5
240.50 * 19.54 in two significant numbers
= 4699.37
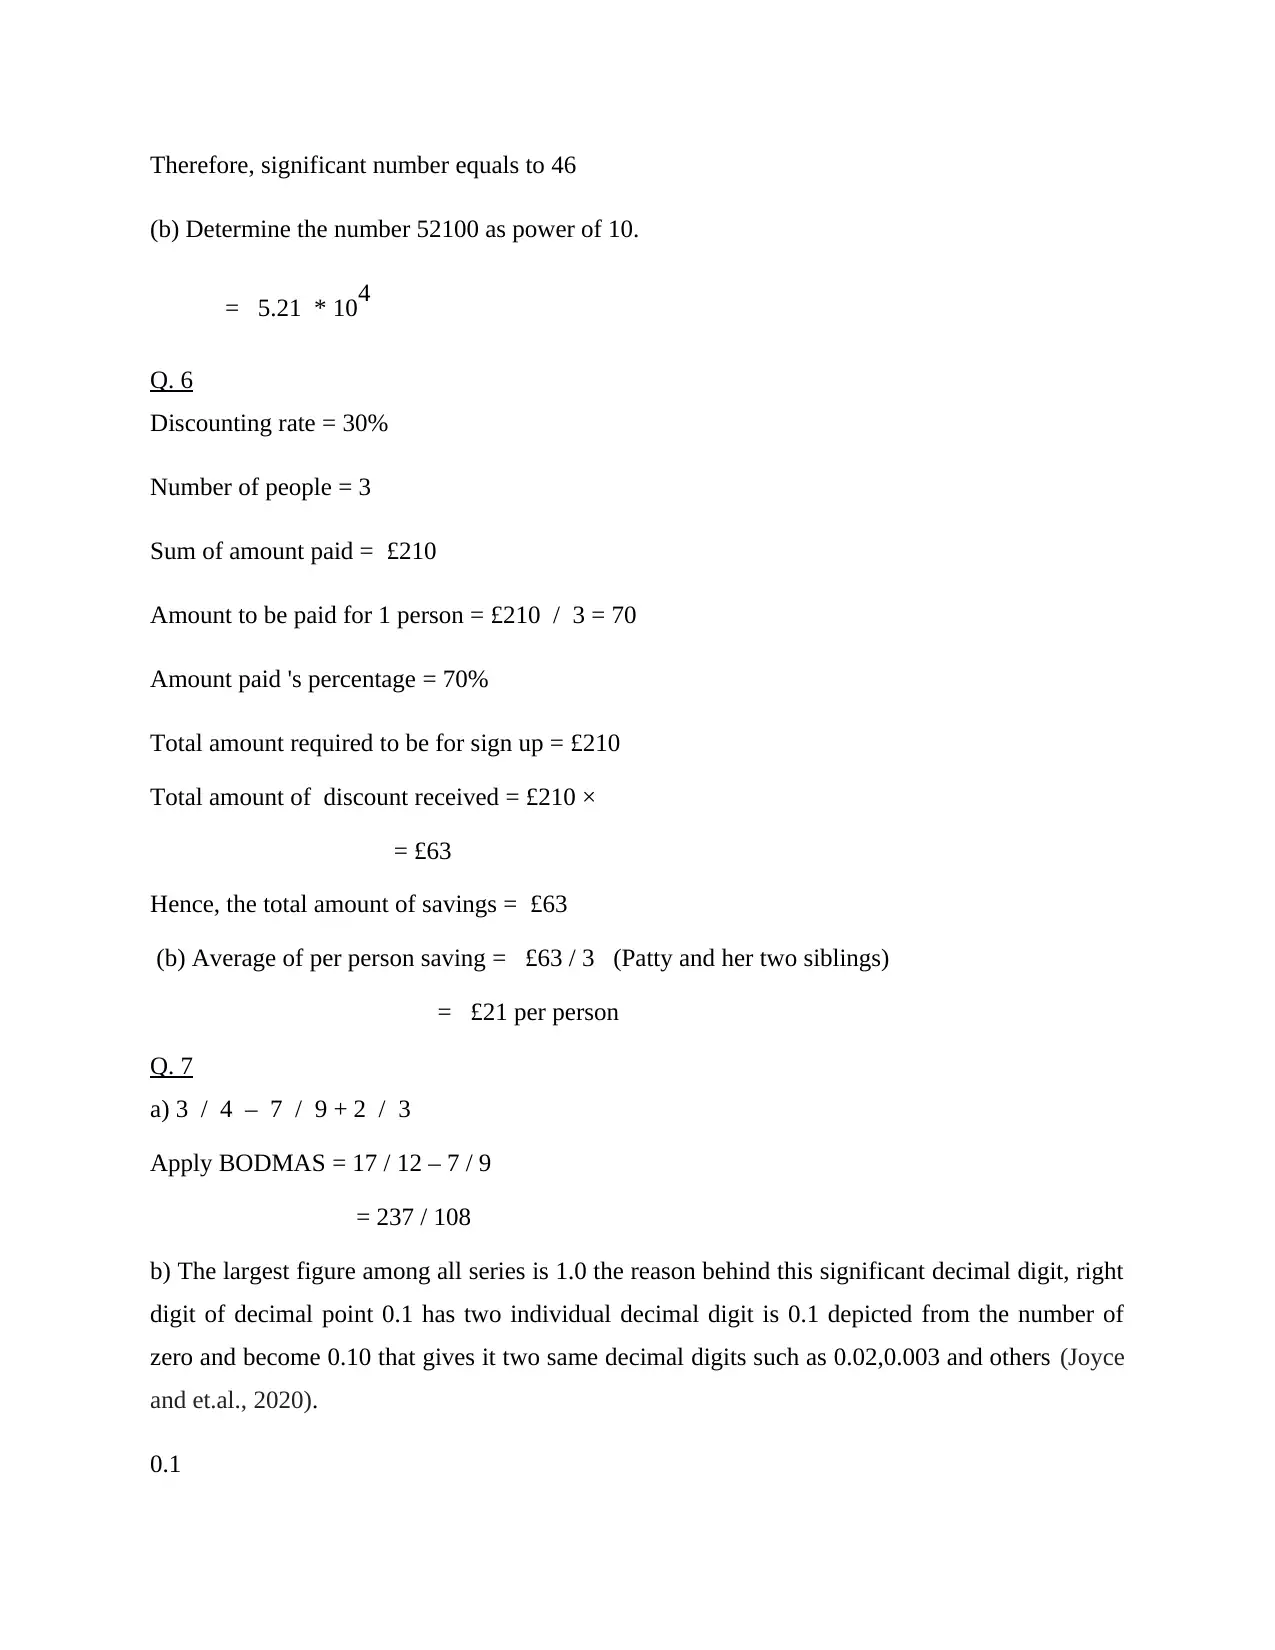
Therefore, significant number equals to 46
(b) Determine the number 52100 as power of 10.
= 5.21 * 104
Q. 6
Discounting rate = 30%
Number of people = 3
Sum of amount paid = £210
Amount to be paid for 1 person = £210 / 3 = 70
Amount paid 's percentage = 70%
Total amount required to be for sign up = £210
Total amount of discount received = £210 ×
= £63
Hence, the total amount of savings = £63
(b) Average of per person saving = £63 / 3 (Patty and her two siblings)
= £21 per person
Q. 7
a) 3 / 4 – 7 / 9 + 2 / 3
Apply BODMAS = 17 / 12 – 7 / 9
= 237 / 108
b) The largest figure among all series is 1.0 the reason behind this significant decimal digit, right
digit of decimal point 0.1 has two individual decimal digit is 0.1 depicted from the number of
zero and become 0.10 that gives it two same decimal digits such as 0.02,0.003 and others (Joyce
and et.al., 2020).
0.1
⊘ This is a preview!⊘
Do you want full access?
Subscribe today to unlock all pages.
Trusted by 1+ million students worldwide
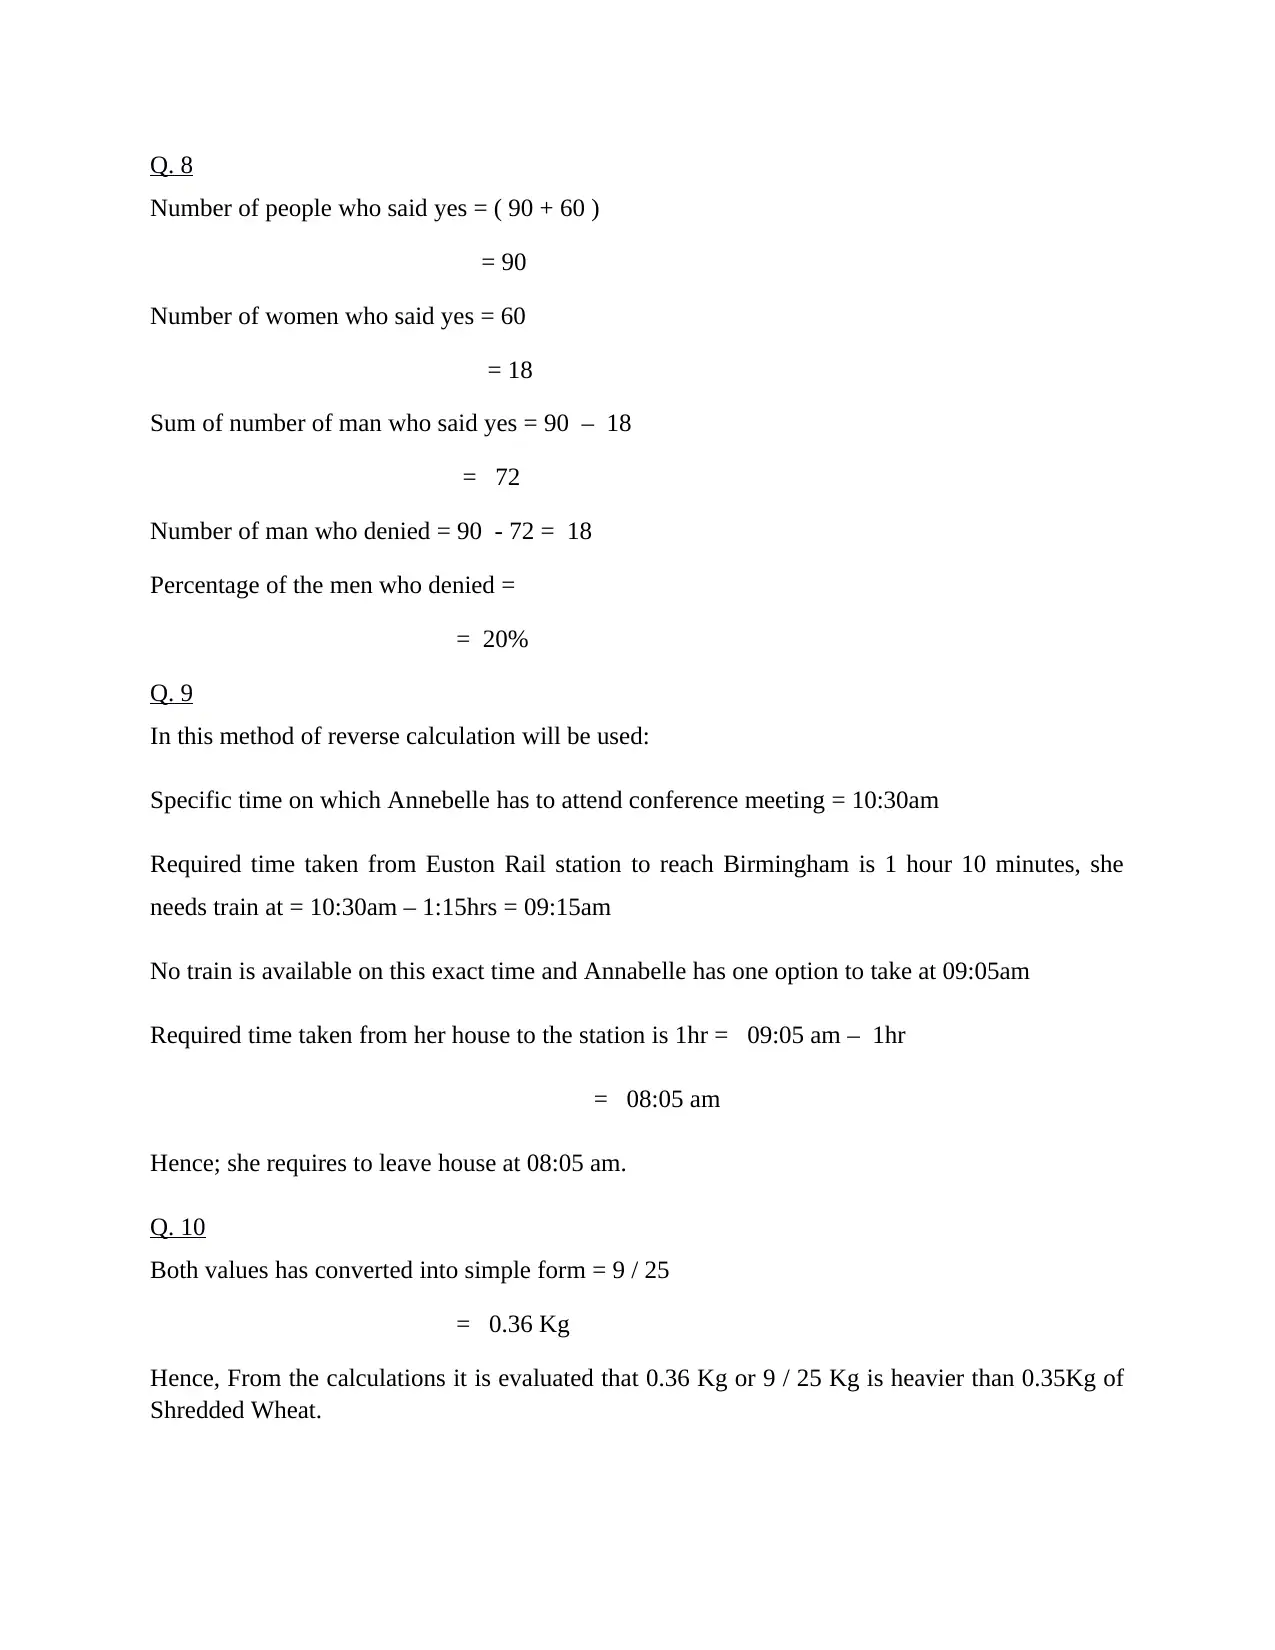
Q. 8
Number of people who said yes = ( 90 + 60 )
= 90
Number of women who said yes = 60
= 18
Sum of number of man who said yes = 90 – 18
= 72
Number of man who denied = 90 - 72 = 18
Percentage of the men who denied =
= 20%
Q. 9
In this method of reverse calculation will be used:
Specific time on which Annebelle has to attend conference meeting = 10:30am
Required time taken from Euston Rail station to reach Birmingham is 1 hour 10 minutes, she
needs train at = 10:30am – 1:15hrs = 09:15am
No train is available on this exact time and Annabelle has one option to take at 09:05am
Required time taken from her house to the station is 1hr = 09:05 am – 1hr
= 08:05 am
Hence; she requires to leave house at 08:05 am.
Q. 10
Both values has converted into simple form = 9 / 25
= 0.36 Kg
Hence, From the calculations it is evaluated that 0.36 Kg or 9 / 25 Kg is heavier than 0.35Kg of
Shredded Wheat.
Paraphrase This Document
Need a fresh take? Get an instant paraphrase of this document with our AI Paraphraser
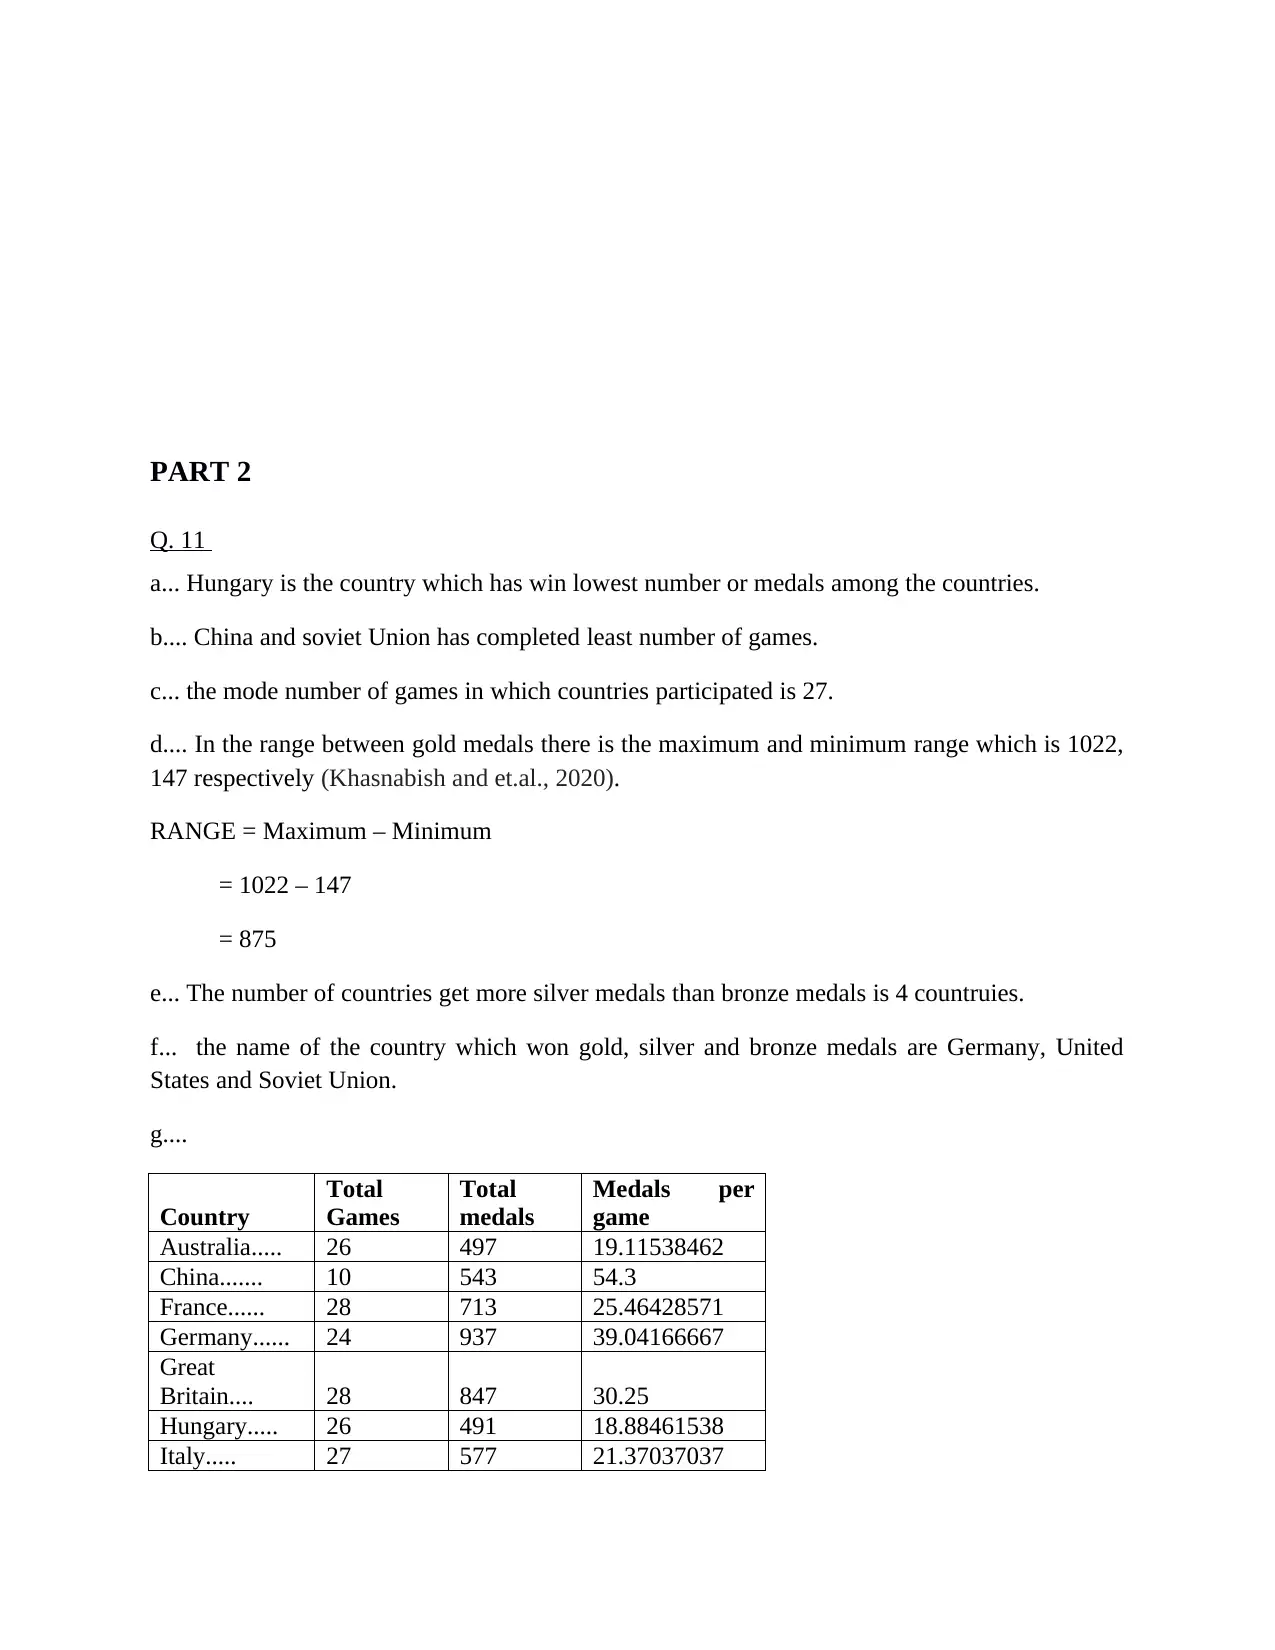
PART 2
Q. 11
a... Hungary is the country which has win lowest number or medals among the countries.
b.... China and soviet Union has completed least number of games.
c... the mode number of games in which countries participated is 27.
d.... In the range between gold medals there is the maximum and minimum range which is 1022,
147 respectively (Khasnabish and et.al., 2020).
RANGE = Maximum – Minimum
= 1022 – 147
= 875
e... The number of countries get more silver medals than bronze medals is 4 countruies.
f... the name of the country which won gold, silver and bronze medals are Germany, United
States and Soviet Union.
g....
Country
Total
Games
Total
medals
Medals per
game
Australia..... 26 497 19.11538462
China....... 10 543 54.3
France...... 28 713 25.46428571
Germany...... 24 937 39.04166667
Great
Britain.... 28 847 30.25
Hungary..... 26 491 18.88461538
Italy..... 27 577 21.37037037
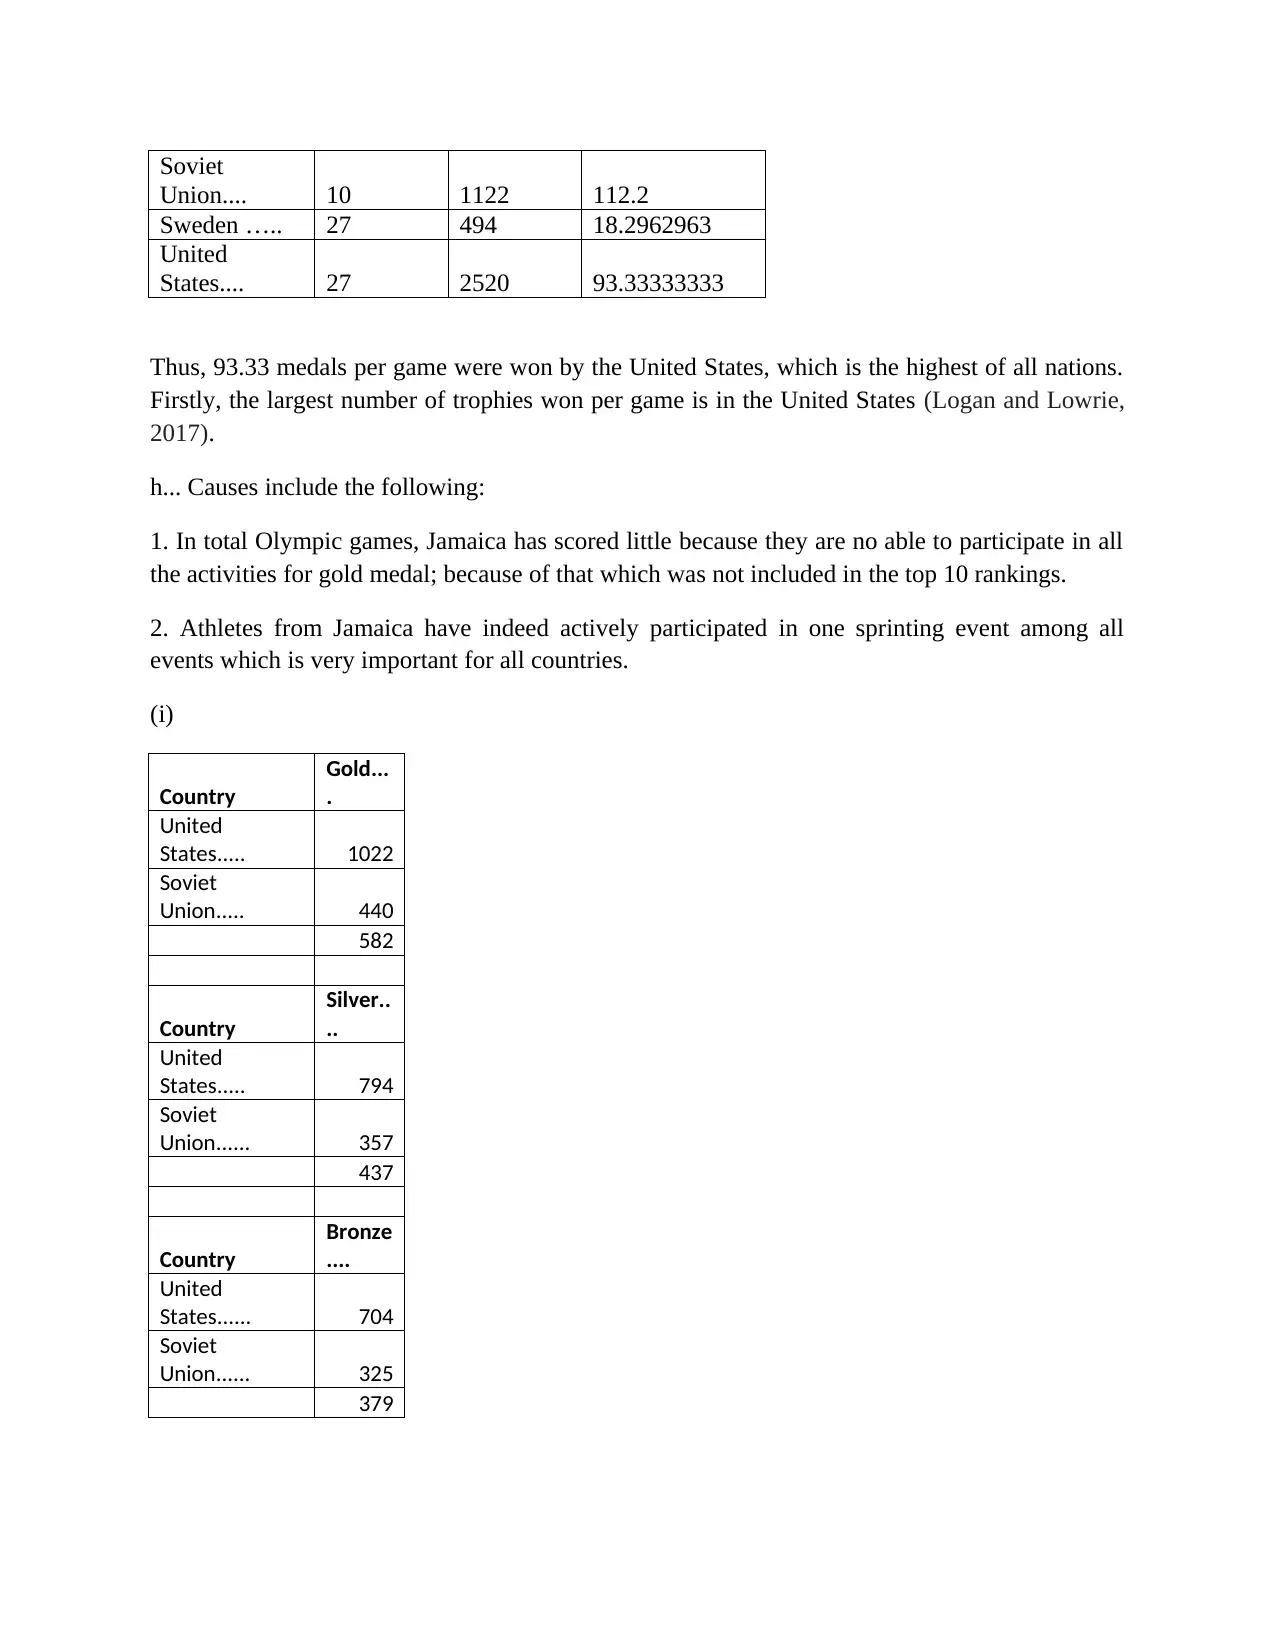
Soviet
Union.... 10 1122 112.2
Sweden ….. 27 494 18.2962963
United
States.... 27 2520 93.33333333
Thus, 93.33 medals per game were won by the United States, which is the highest of all nations.
Firstly, the largest number of trophies won per game is in the United States (Logan and Lowrie,
2017).
h... Causes include the following:
1. In total Olympic games, Jamaica has scored little because they are no able to participate in all
the activities for gold medal; because of that which was not included in the top 10 rankings.
2. Athletes from Jamaica have indeed actively participated in one sprinting event among all
events which is very important for all countries.
(i)
Country
Gold...
.
United
States..... 1022
Soviet
Union..... 440
582
Country
Silver..
..
United
States..... 794
Soviet
Union...... 357
437
Country
Bronze
....
United
States...... 704
Soviet
Union...... 325
379
⊘ This is a preview!⊘
Do you want full access?
Subscribe today to unlock all pages.
Trusted by 1+ million students worldwide
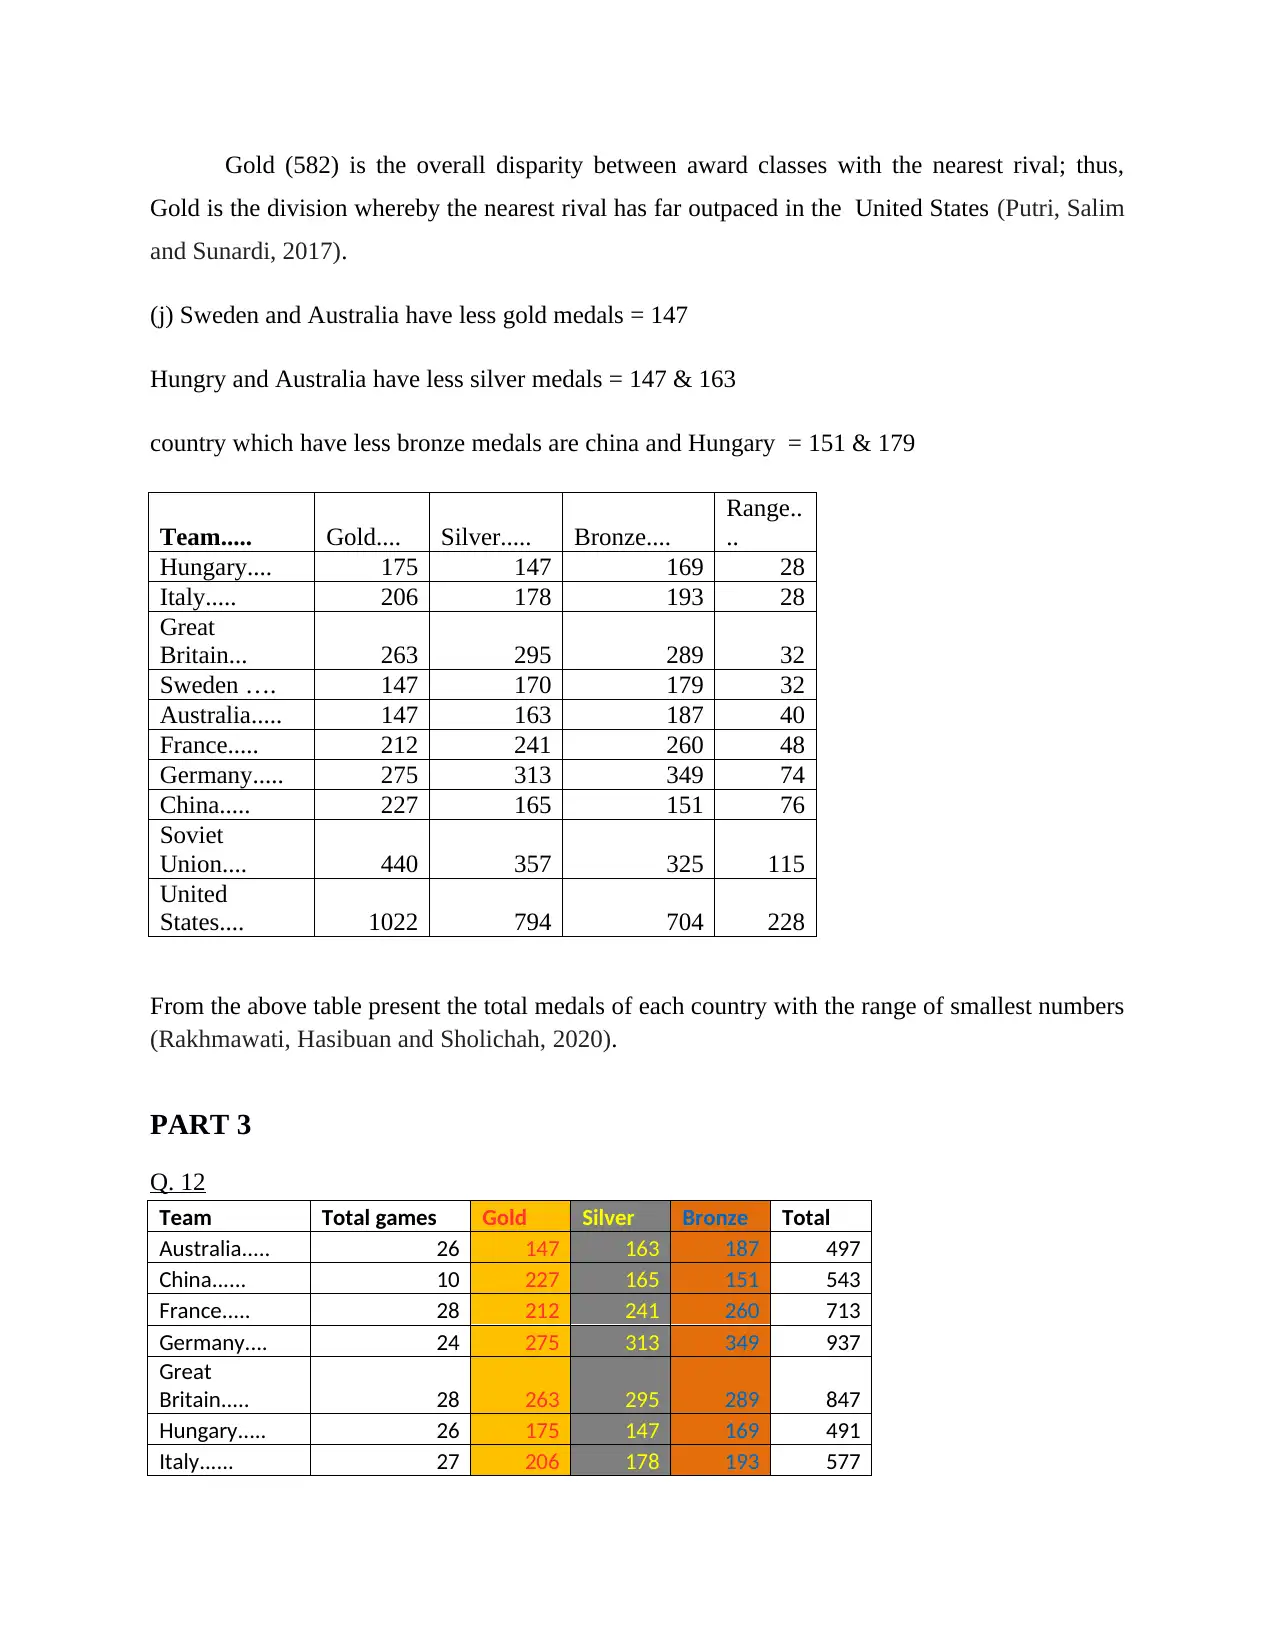
Gold (582) is the overall disparity between award classes with the nearest rival; thus,
Gold is the division whereby the nearest rival has far outpaced in the United States (Putri, Salim
and Sunardi, 2017).
(j) Sweden and Australia have less gold medals = 147
Hungry and Australia have less silver medals = 147 & 163
country which have less bronze medals are china and Hungary = 151 & 179
Team..... Gold.... Silver..... Bronze....
Range..
..
Hungary.... 175 147 169 28
Italy..... 206 178 193 28
Great
Britain... 263 295 289 32
Sweden …. 147 170 179 32
Australia..... 147 163 187 40
France..... 212 241 260 48
Germany..... 275 313 349 74
China..... 227 165 151 76
Soviet
Union.... 440 357 325 115
United
States.... 1022 794 704 228
From the above table present the total medals of each country with the range of smallest numbers
(Rakhmawati, Hasibuan and Sholichah, 2020).
PART 3
Q. 12
Team Total games Gold Silver Bronze Total
Australia..... 26 147 163 187 497
China...... 10 227 165 151 543
France..... 28 212 241 260 713
Germany.... 24 275 313 349 937
Great
Britain..... 28 263 295 289 847
Hungary..... 26 175 147 169 491
Italy...... 27 206 178 193 577
Paraphrase This Document
Need a fresh take? Get an instant paraphrase of this document with our AI Paraphraser
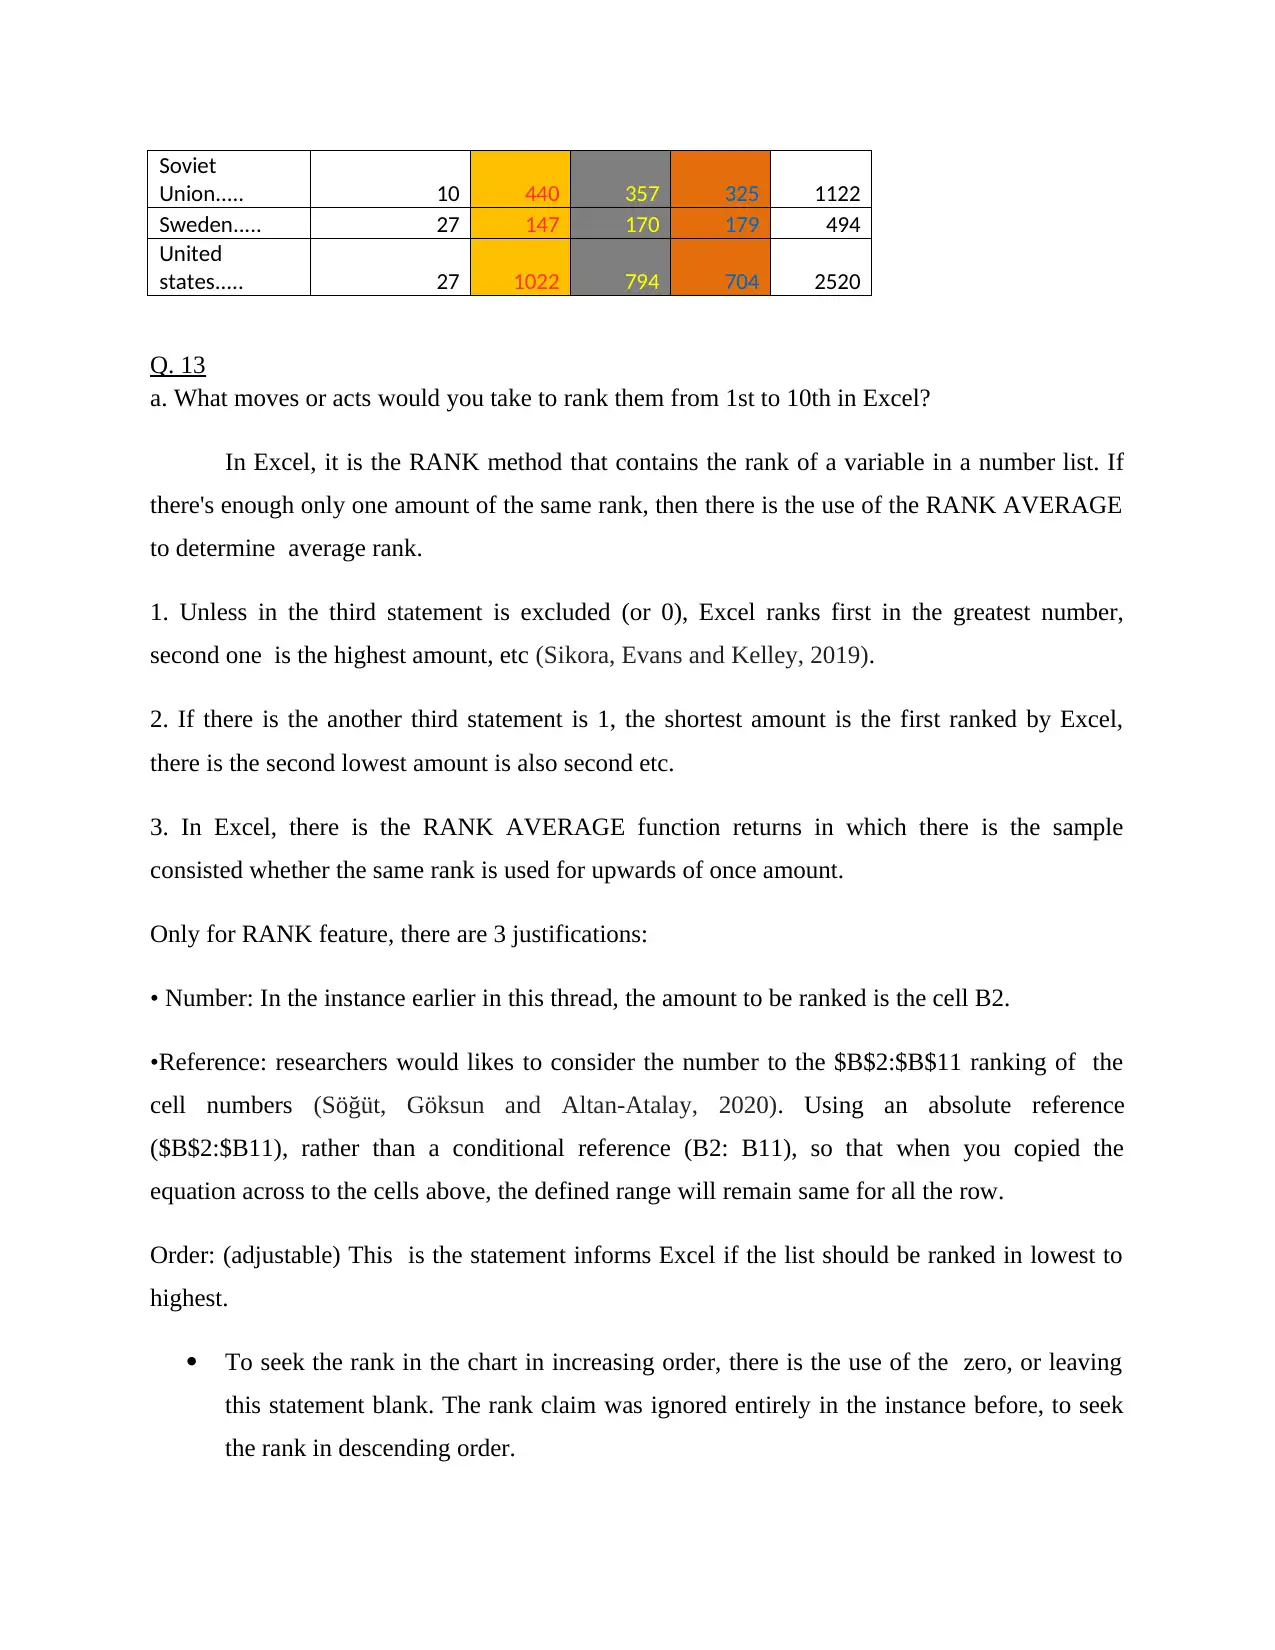
Soviet
Union..... 10 440 357 325 1122
Sweden..... 27 147 170 179 494
United
states..... 27 1022 794 704 2520
Q. 13
a. What moves or acts would you take to rank them from 1st to 10th in Excel?
In Excel, it is the RANK method that contains the rank of a variable in a number list. If
there's enough only one amount of the same rank, then there is the use of the RANK AVERAGE
to determine average rank.
1. Unless in the third statement is excluded (or 0), Excel ranks first in the greatest number,
second one is the highest amount, etc (Sikora, Evans and Kelley, 2019).
2. If there is the another third statement is 1, the shortest amount is the first ranked by Excel,
there is the second lowest amount is also second etc.
3. In Excel, there is the RANK AVERAGE function returns in which there is the sample
consisted whether the same rank is used for upwards of once amount.
Only for RANK feature, there are 3 justifications:
• Number: In the instance earlier in this thread, the amount to be ranked is the cell B2.
•Reference: researchers would likes to consider the number to the $B$2:$B$11 ranking of the
cell numbers (Söğüt, Göksun and Altan‐Atalay, 2020). Using an absolute reference
($B$2:$B11), rather than a conditional reference (B2: B11), so that when you copied the
equation across to the cells above, the defined range will remain same for all the row.
Order: (adjustable) This is the statement informs Excel if the list should be ranked in lowest to
highest.
To seek the rank in the chart in increasing order, there is the use of the zero, or leaving
this statement blank. The rank claim was ignored entirely in the instance before, to seek
the rank in descending order.
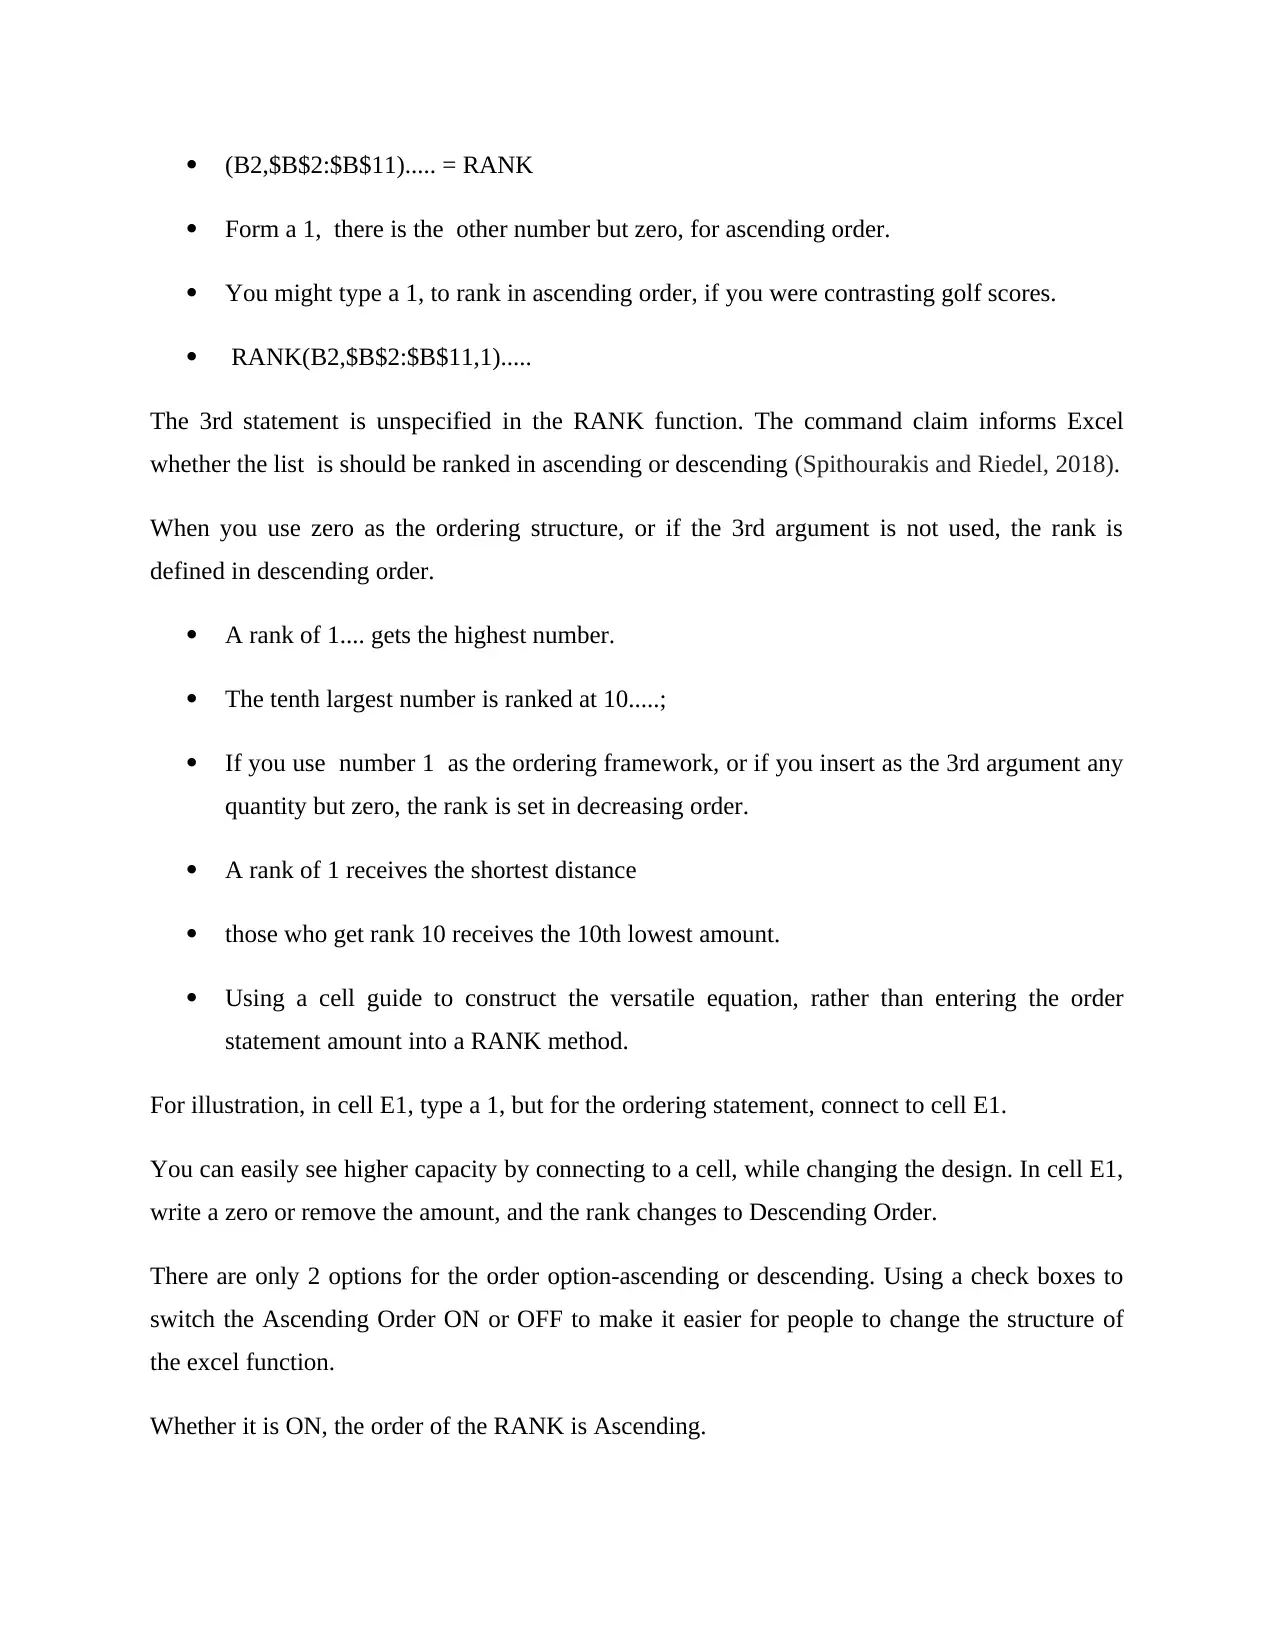
(B2,$B$2:$B$11)..... = RANK
Form a 1, there is the other number but zero, for ascending order.
You might type a 1, to rank in ascending order, if you were contrasting golf scores.
RANK(B2,$B$2:$B$11,1).....
The 3rd statement is unspecified in the RANK function. The command claim informs Excel
whether the list is should be ranked in ascending or descending (Spithourakis and Riedel, 2018).
When you use zero as the ordering structure, or if the 3rd argument is not used, the rank is
defined in descending order.
A rank of 1.... gets the highest number.
The tenth largest number is ranked at 10.....;
If you use number 1 as the ordering framework, or if you insert as the 3rd argument any
quantity but zero, the rank is set in decreasing order.
A rank of 1 receives the shortest distance
those who get rank 10 receives the 10th lowest amount.
Using a cell guide to construct the versatile equation, rather than entering the order
statement amount into a RANK method.
For illustration, in cell E1, type a 1, but for the ordering statement, connect to cell E1.
You can easily see higher capacity by connecting to a cell, while changing the design. In cell E1,
write a zero or remove the amount, and the rank changes to Descending Order.
There are only 2 options for the order option-ascending or descending. Using a check boxes to
switch the Ascending Order ON or OFF to make it easier for people to change the structure of
the excel function.
Whether it is ON, the order of the RANK is Ascending.
⊘ This is a preview!⊘
Do you want full access?
Subscribe today to unlock all pages.
Trusted by 1+ million students worldwide
1 out of 19
Related Documents


Your All-in-One AI-Powered Toolkit for Academic Success.
+13062052269
info@desklib.com
Available 24*7 on WhatsApp / Email
![[object Object]](/_next/static/media/star-bottom.7253800d.svg)
Unlock your academic potential
Copyright © 2020–2026 A2Z Services. All Rights Reserved. Developed and managed by ZUCOL.