Comprehensive Solution: Numeracy Data and IT Assignment
VerifiedAdded on 2023/06/17
|21
|2958
|437
Homework Assignment
AI Summary
This assignment solution provides detailed answers to questions related to numeracy data and IT skills. It covers topics such as fraction simplification, percentage calculations, data analysis using Excel, and statistical interpretation. The solution includes calculations for finding the simplest form of fractions, determining percentages, calculating discounts, and analyzing medal data for various countries in the Olympics. Excel formulas like RANK, IF, SUM, and AVERAGE are used to analyze and interpret the data. The assignment also involves creating charts and graphs to represent the data visually. Desklib offers this solution along with many other resources to aid students in their studies.
USING NUMERACY DATA
AND IT
AND IT
Paraphrase This Document
Need a fresh take? Get an instant paraphrase of this document with our AI Paraphraser
Table of Contents
PART-1............................................................................................................................................3
Q1................................................................................................................................................3
Q2................................................................................................................................................3
Q3................................................................................................................................................3
Q4................................................................................................................................................4
Q5................................................................................................................................................5
Q6................................................................................................................................................5
Q7................................................................................................................................................5
Q8................................................................................................................................................6
Q9................................................................................................................................................6
Q10..............................................................................................................................................7
PART-2 USING DATA..................................................................................................................7
Q11..............................................................................................................................................7
PART-3..........................................................................................................................................10
Q12............................................................................................................................................10
Q13............................................................................................................................................11
Q14............................................................................................................................................13
Q15............................................................................................................................................16
Q16............................................................................................................................................19
REFERENCES................................................................................................................................1
PART-1
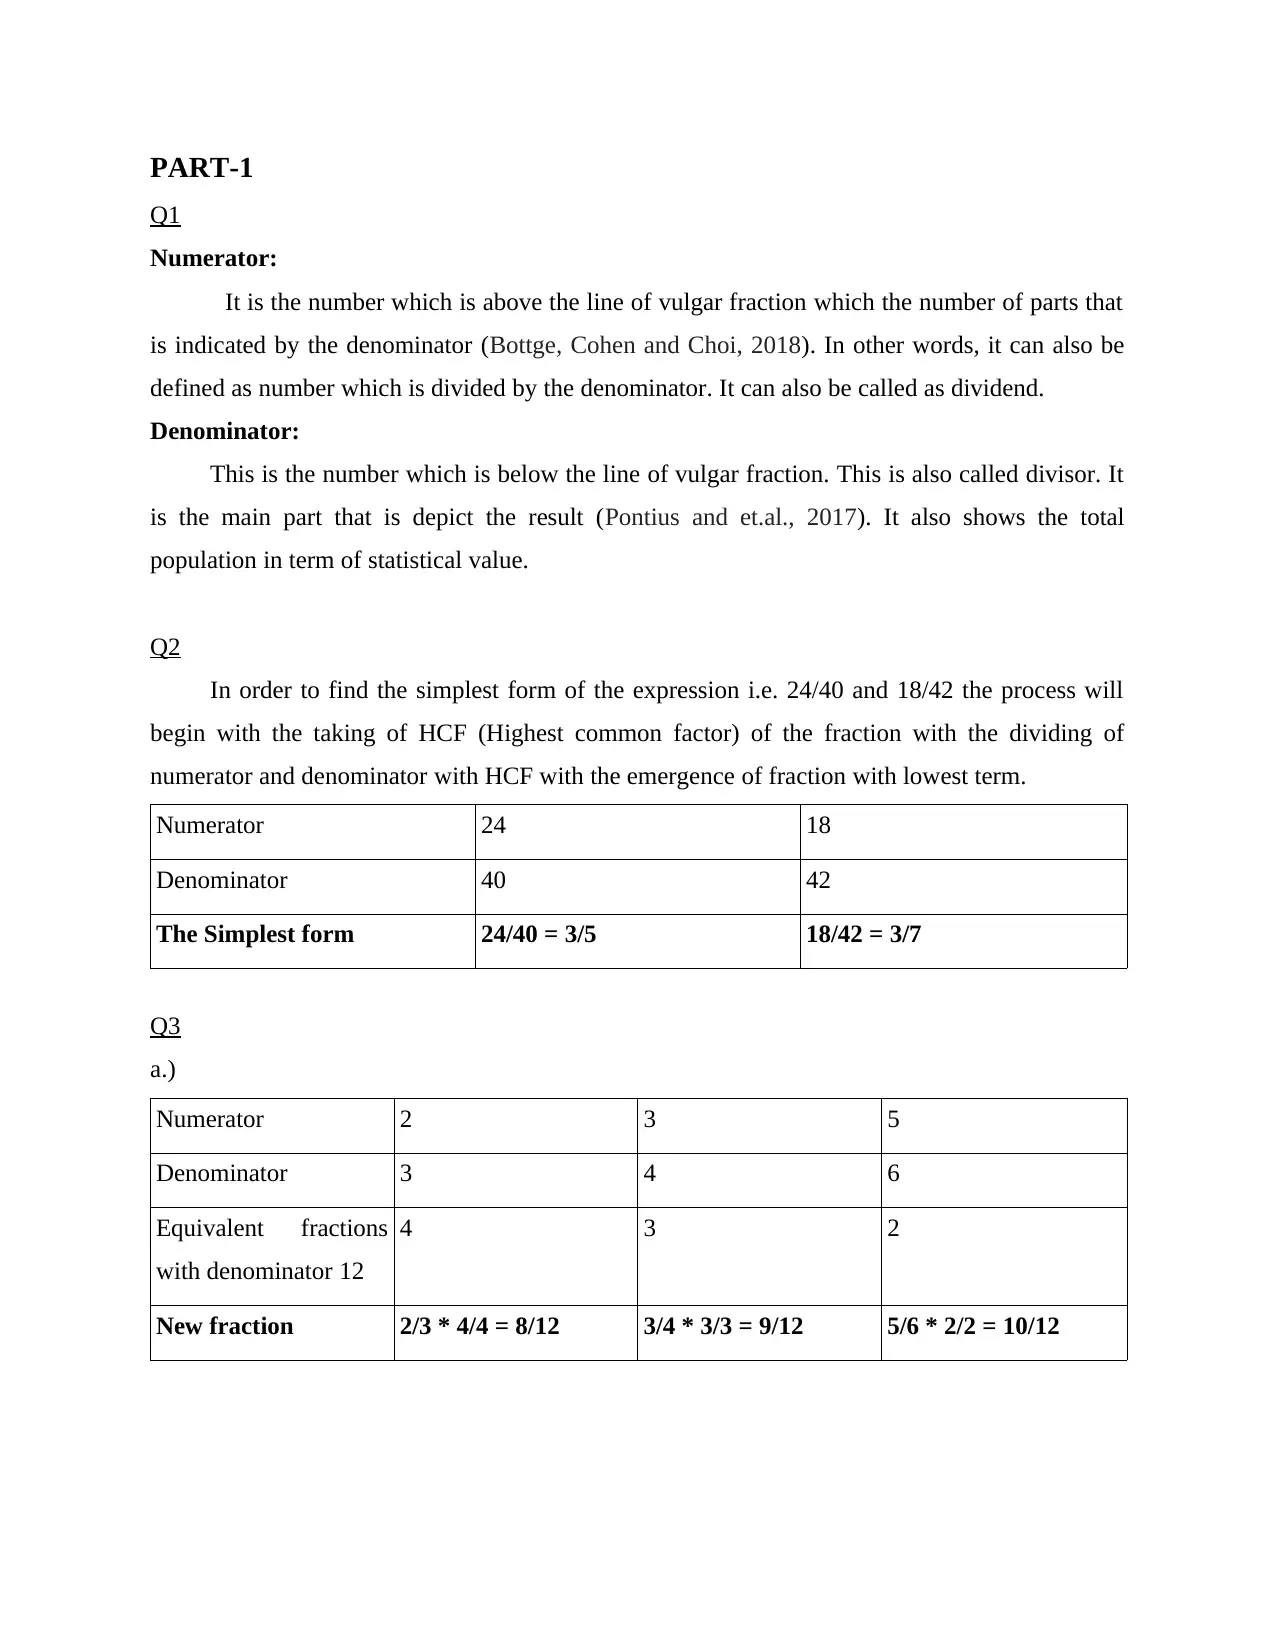
Q1
Numerator:
It is the number which is above the line of vulgar fraction which the number of parts that
is indicated by the denominator (Bottge, Cohen and Choi, 2018). In other words, it can also be
defined as number which is divided by the denominator. It can also be called as dividend.
Denominator:
This is the number which is below the line of vulgar fraction. This is also called divisor. It
is the main part that is depict the result (Pontius and et.al., 2017). It also shows the total
population in term of statistical value.
Q2
In order to find the simplest form of the expression i.e. 24/40 and 18/42 the process will
begin with the taking of HCF (Highest common factor) of the fraction with the dividing of
numerator and denominator with HCF with the emergence of fraction with lowest term.
Numerator 24 18
Denominator 40 42
The Simplest form 24/40 = 3/5 18/42 = 3/7
Q3
a.)
Numerator 2 3 5
Denominator 3 4 6
Equivalent fractions
with denominator 12
4 3 2
New fraction 2/3 * 4/4 = 8/12 3/4 * 3/3 = 9/12 5/6 * 2/2 = 10/12
⊘ This is a preview!⊘
Do you want full access?
Subscribe today to unlock all pages.
Trusted by 1+ million students worldwide
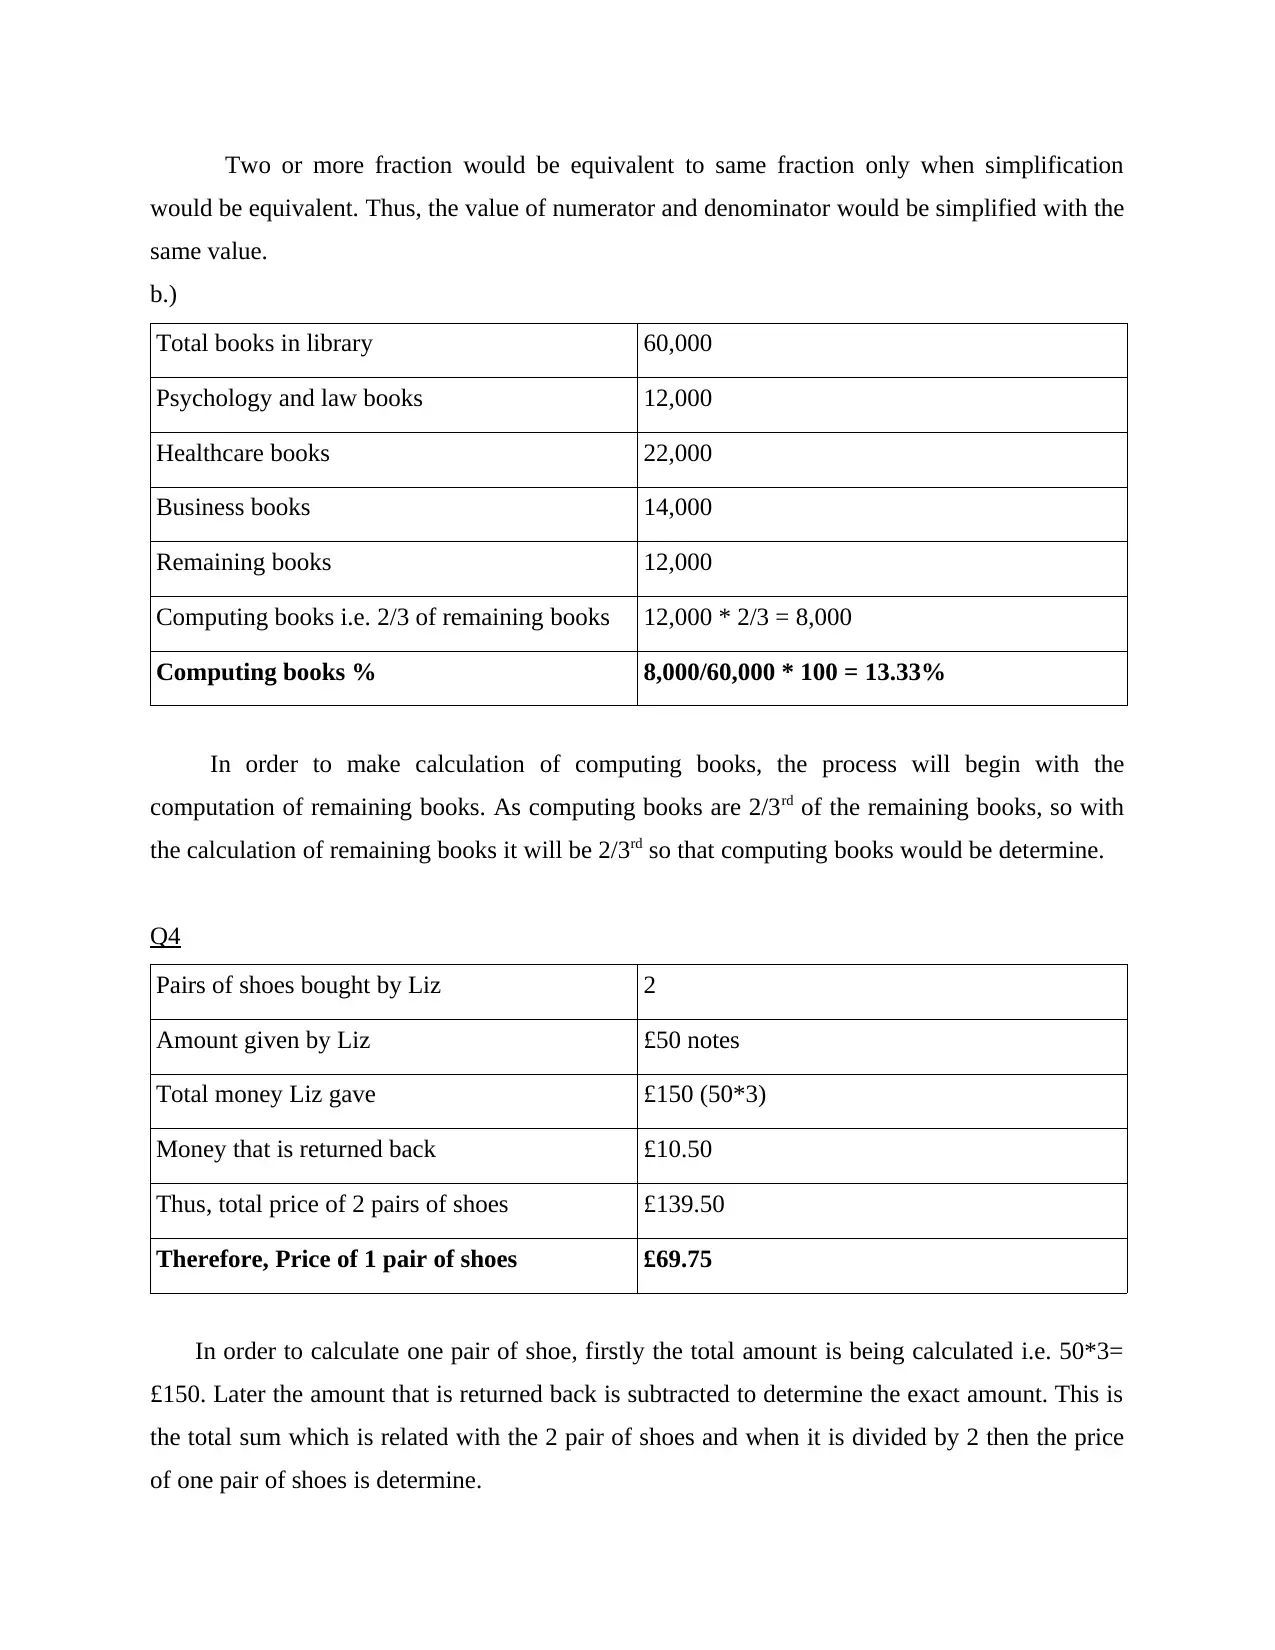
Two or more fraction would be equivalent to same fraction only when simplification
would be equivalent. Thus, the value of numerator and denominator would be simplified with the
same value.
b.)
Total books in library 60,000
Psychology and law books 12,000
Healthcare books 22,000
Business books 14,000
Remaining books 12,000
Computing books i.e. 2/3 of remaining books 12,000 * 2/3 = 8,000
Computing books % 8,000/60,000 * 100 = 13.33%
In order to make calculation of computing books, the process will begin with the
computation of remaining books. As computing books are 2/3rd of the remaining books, so with
the calculation of remaining books it will be 2/3rd so that computing books would be determine.
Q4
Pairs of shoes bought by Liz 2
Amount given by Liz £50 notes
Total money Liz gave £150 (50*3)
Money that is returned back £10.50
Thus, total price of 2 pairs of shoes £139.50
Therefore, Price of 1 pair of shoes £69.75
In order to calculate one pair of shoe, firstly the total amount is being calculated i.e. 50*3=
£150. Later the amount that is returned back is subtracted to determine the exact amount. This is
the total sum which is related with the 2 pair of shoes and when it is divided by 2 then the price
of one pair of shoes is determine.
Paraphrase This Document
Need a fresh take? Get an instant paraphrase of this document with our AI Paraphraser
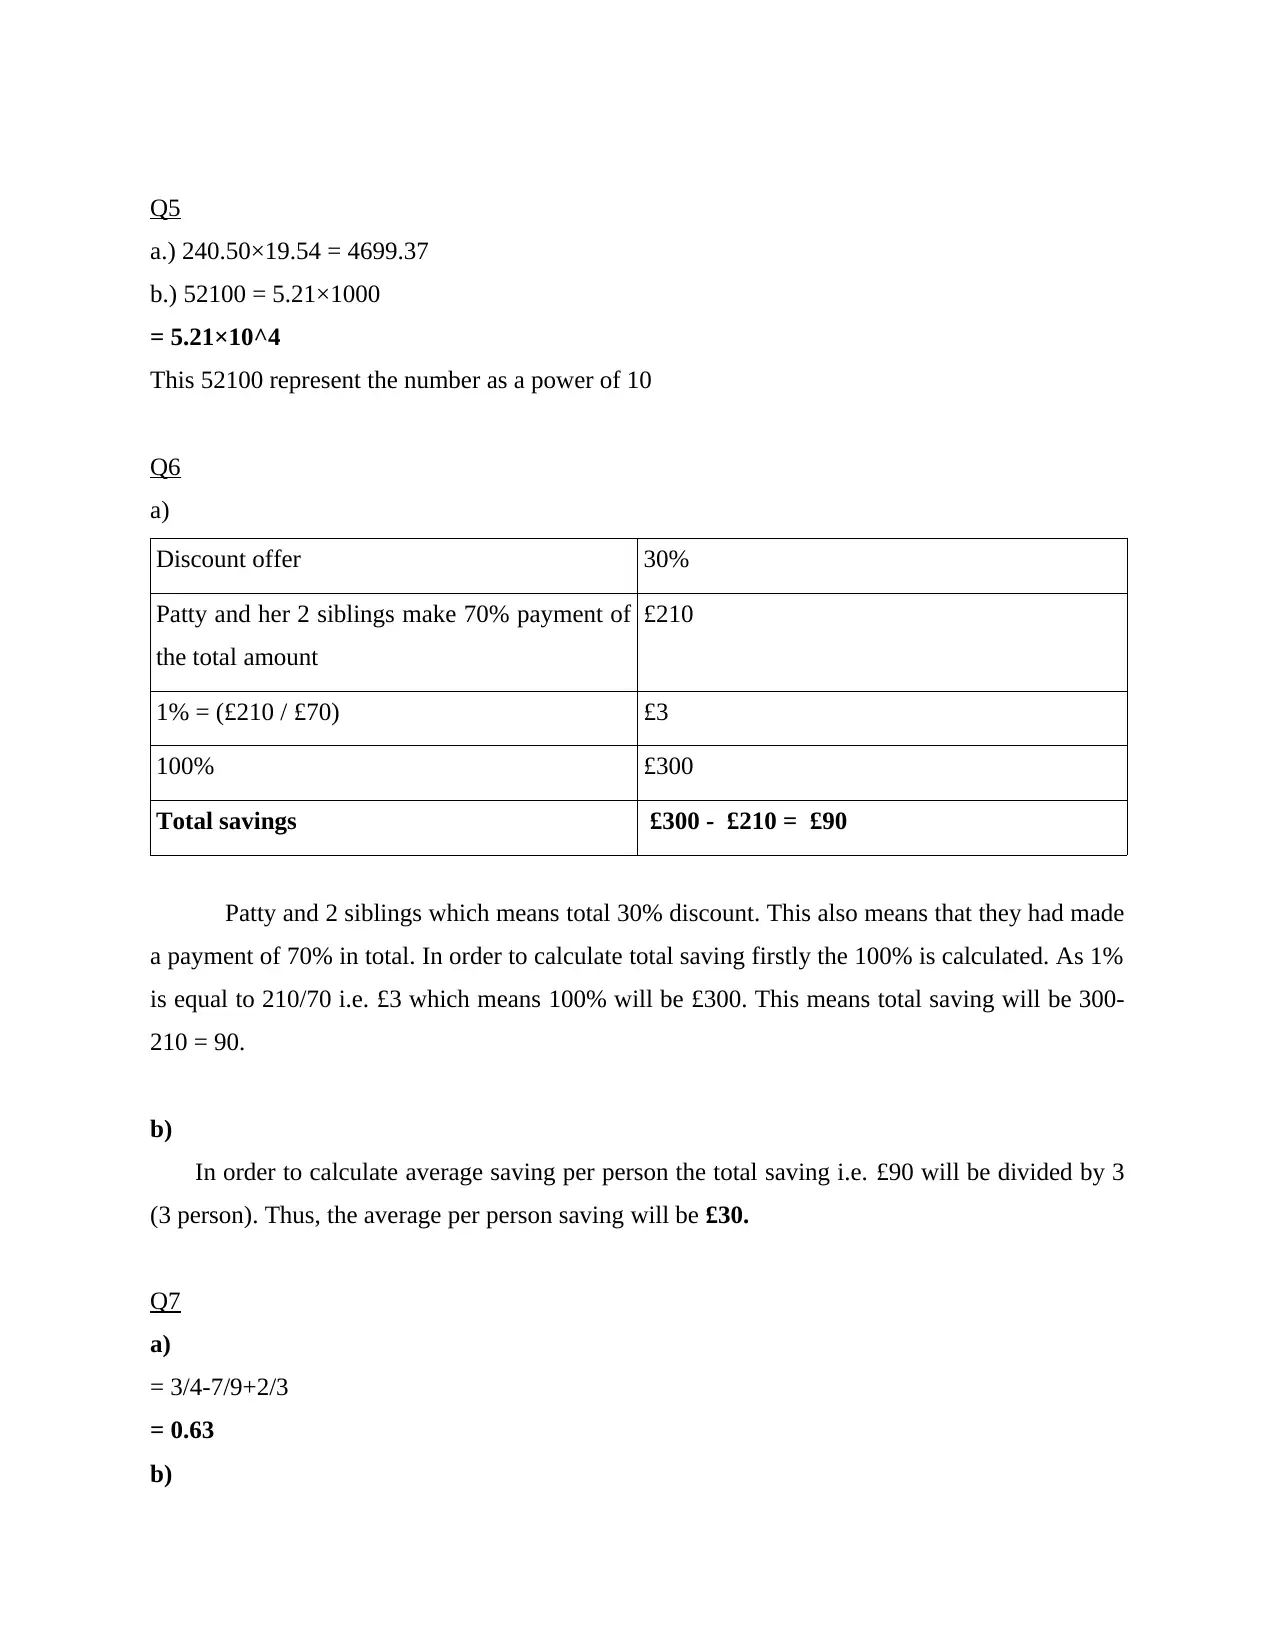
Q5
a.) 240.50×19.54 = 4699.37
b.) 52100 = 5.21×1000
= 5.21×10^4
This 52100 represent the number as a power of 10
Q6
a)
Discount offer 30%
Patty and her 2 siblings make 70% payment of
the total amount
£210
1% = (£210 / £70) £3
100% £300
Total savings £300 - £210 = £90
Patty and 2 siblings which means total 30% discount. This also means that they had made
a payment of 70% in total. In order to calculate total saving firstly the 100% is calculated. As 1%
is equal to 210/70 i.e. £3 which means 100% will be £300. This means total saving will be 300-
210 = 90.
b)
In order to calculate average saving per person the total saving i.e. £90 will be divided by 3
(3 person). Thus, the average per person saving will be £30.
Q7
a)
= 3/4-7/9+2/3
= 0.63
b)
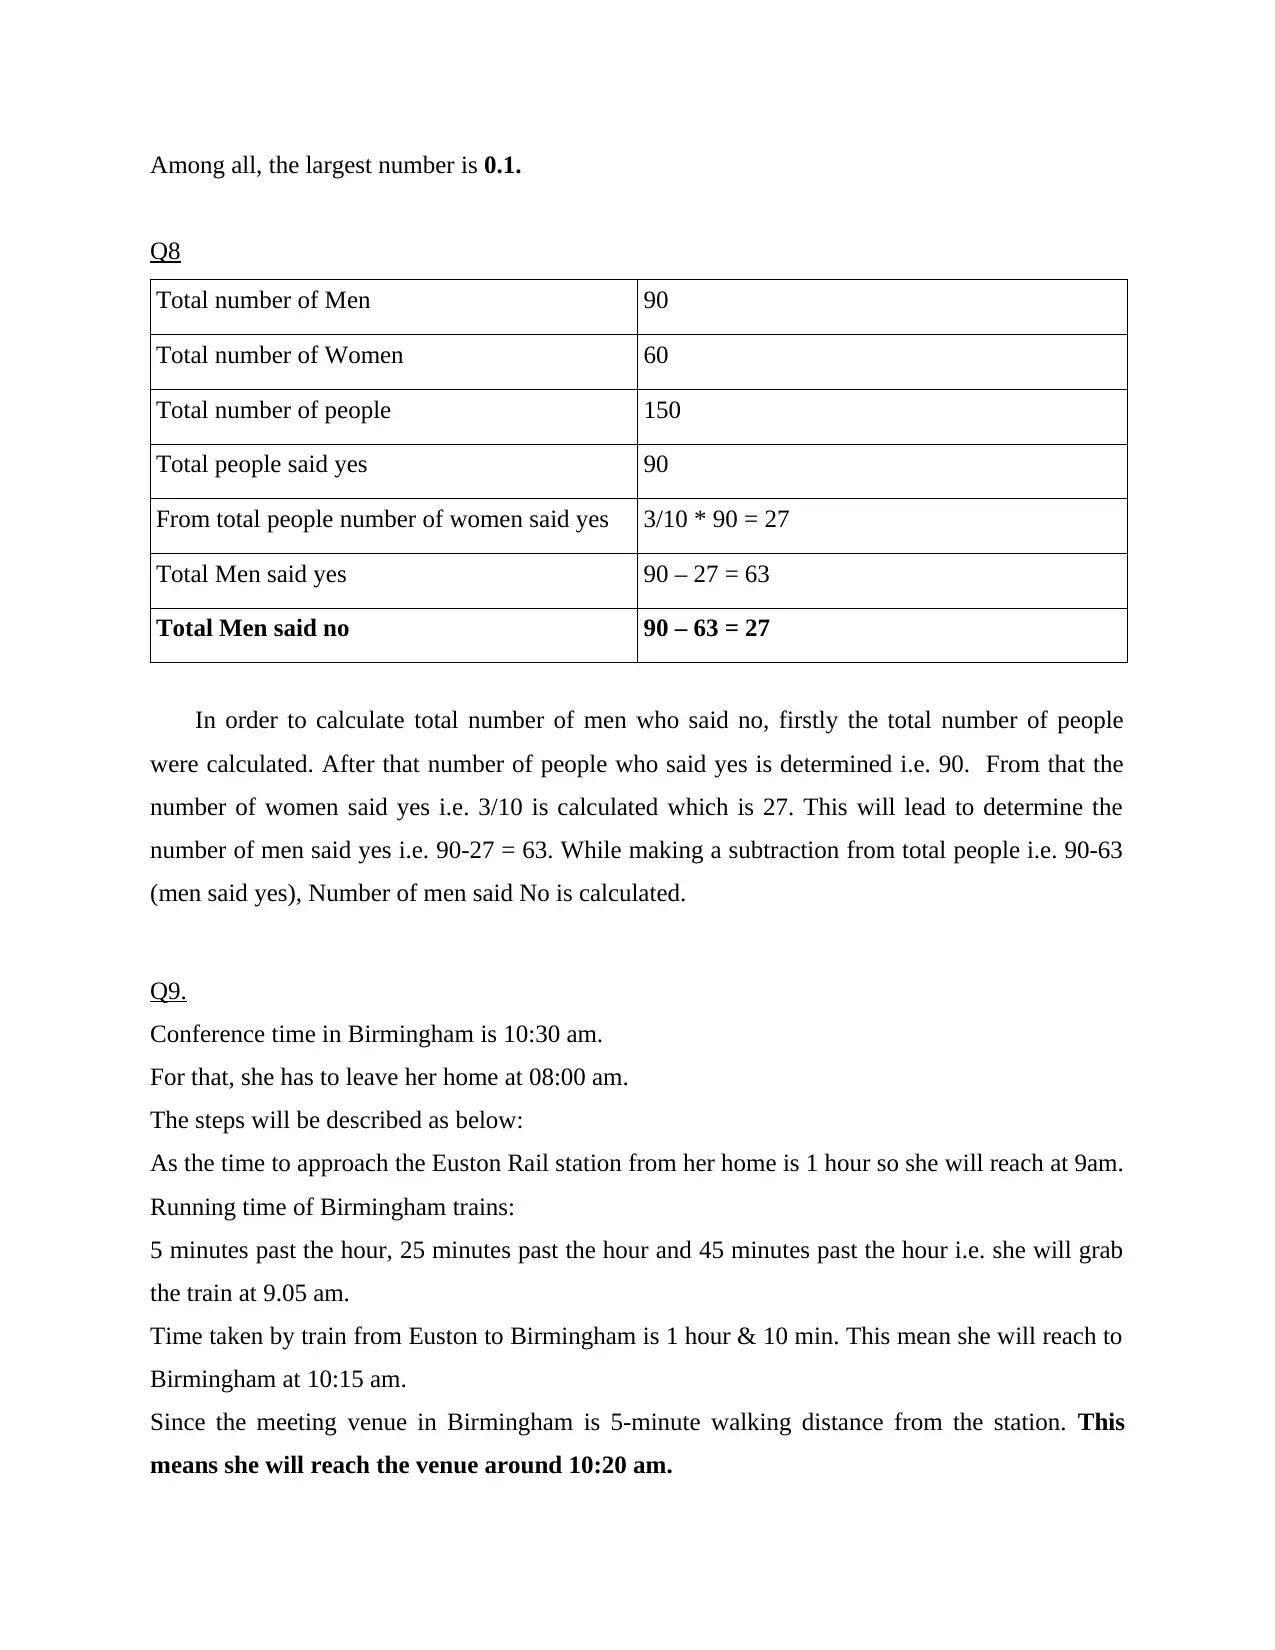
Among all, the largest number is 0.1.
Q8
Total number of Men 90
Total number of Women 60
Total number of people 150
Total people said yes 90
From total people number of women said yes 3/10 * 90 = 27
Total Men said yes 90 – 27 = 63
Total Men said no 90 – 63 = 27
In order to calculate total number of men who said no, firstly the total number of people
were calculated. After that number of people who said yes is determined i.e. 90. From that the
number of women said yes i.e. 3/10 is calculated which is 27. This will lead to determine the
number of men said yes i.e. 90-27 = 63. While making a subtraction from total people i.e. 90-63
(men said yes), Number of men said No is calculated.
Q9.
Conference time in Birmingham is 10:30 am.
For that, she has to leave her home at 08:00 am.
The steps will be described as below:
As the time to approach the Euston Rail station from her home is 1 hour so she will reach at 9am.
Running time of Birmingham trains:
5 minutes past the hour, 25 minutes past the hour and 45 minutes past the hour i.e. she will grab
the train at 9.05 am.
Time taken by train from Euston to Birmingham is 1 hour & 10 min. This mean she will reach to
Birmingham at 10:15 am.
Since the meeting venue in Birmingham is 5-minute walking distance from the station. This
means she will reach the venue around 10:20 am.
⊘ This is a preview!⊘
Do you want full access?
Subscribe today to unlock all pages.
Trusted by 1+ million students worldwide
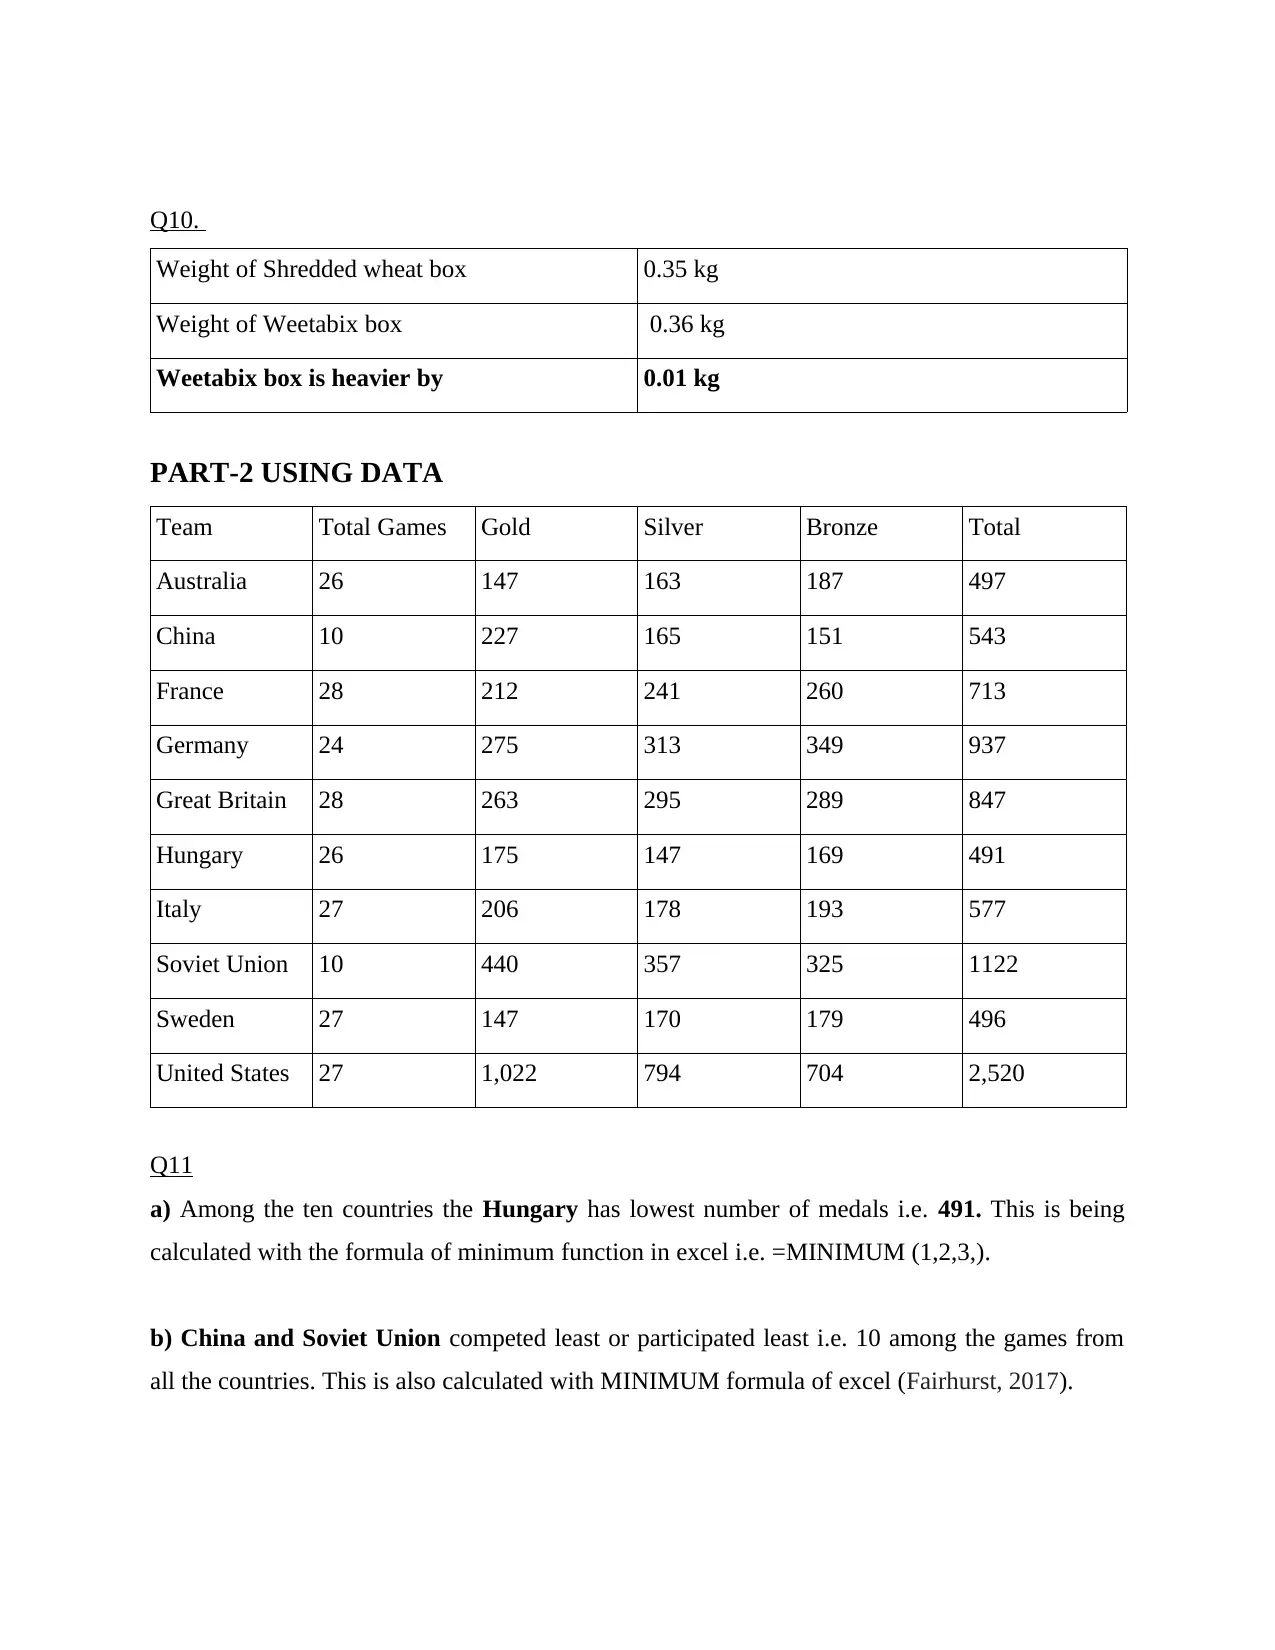
Q10.
Weight of Shredded wheat box 0.35 kg
Weight of Weetabix box 0.36 kg
Weetabix box is heavier by 0.01 kg
PART-2 USING DATA
Team Total Games Gold Silver Bronze Total
Australia 26 147 163 187 497
China 10 227 165 151 543
France 28 212 241 260 713
Germany 24 275 313 349 937
Great Britain 28 263 295 289 847
Hungary 26 175 147 169 491
Italy 27 206 178 193 577
Soviet Union 10 440 357 325 1122
Sweden 27 147 170 179 496
United States 27 1,022 794 704 2,520
Q11
a) Among the ten countries the Hungary has lowest number of medals i.e. 491. This is being
calculated with the formula of minimum function in excel i.e. =MINIMUM (1,2,3,).
b) China and Soviet Union competed least or participated least i.e. 10 among the games from
all the countries. This is also calculated with MINIMUM formula of excel (Fairhurst, 2017).
Paraphrase This Document
Need a fresh take? Get an instant paraphrase of this document with our AI Paraphraser
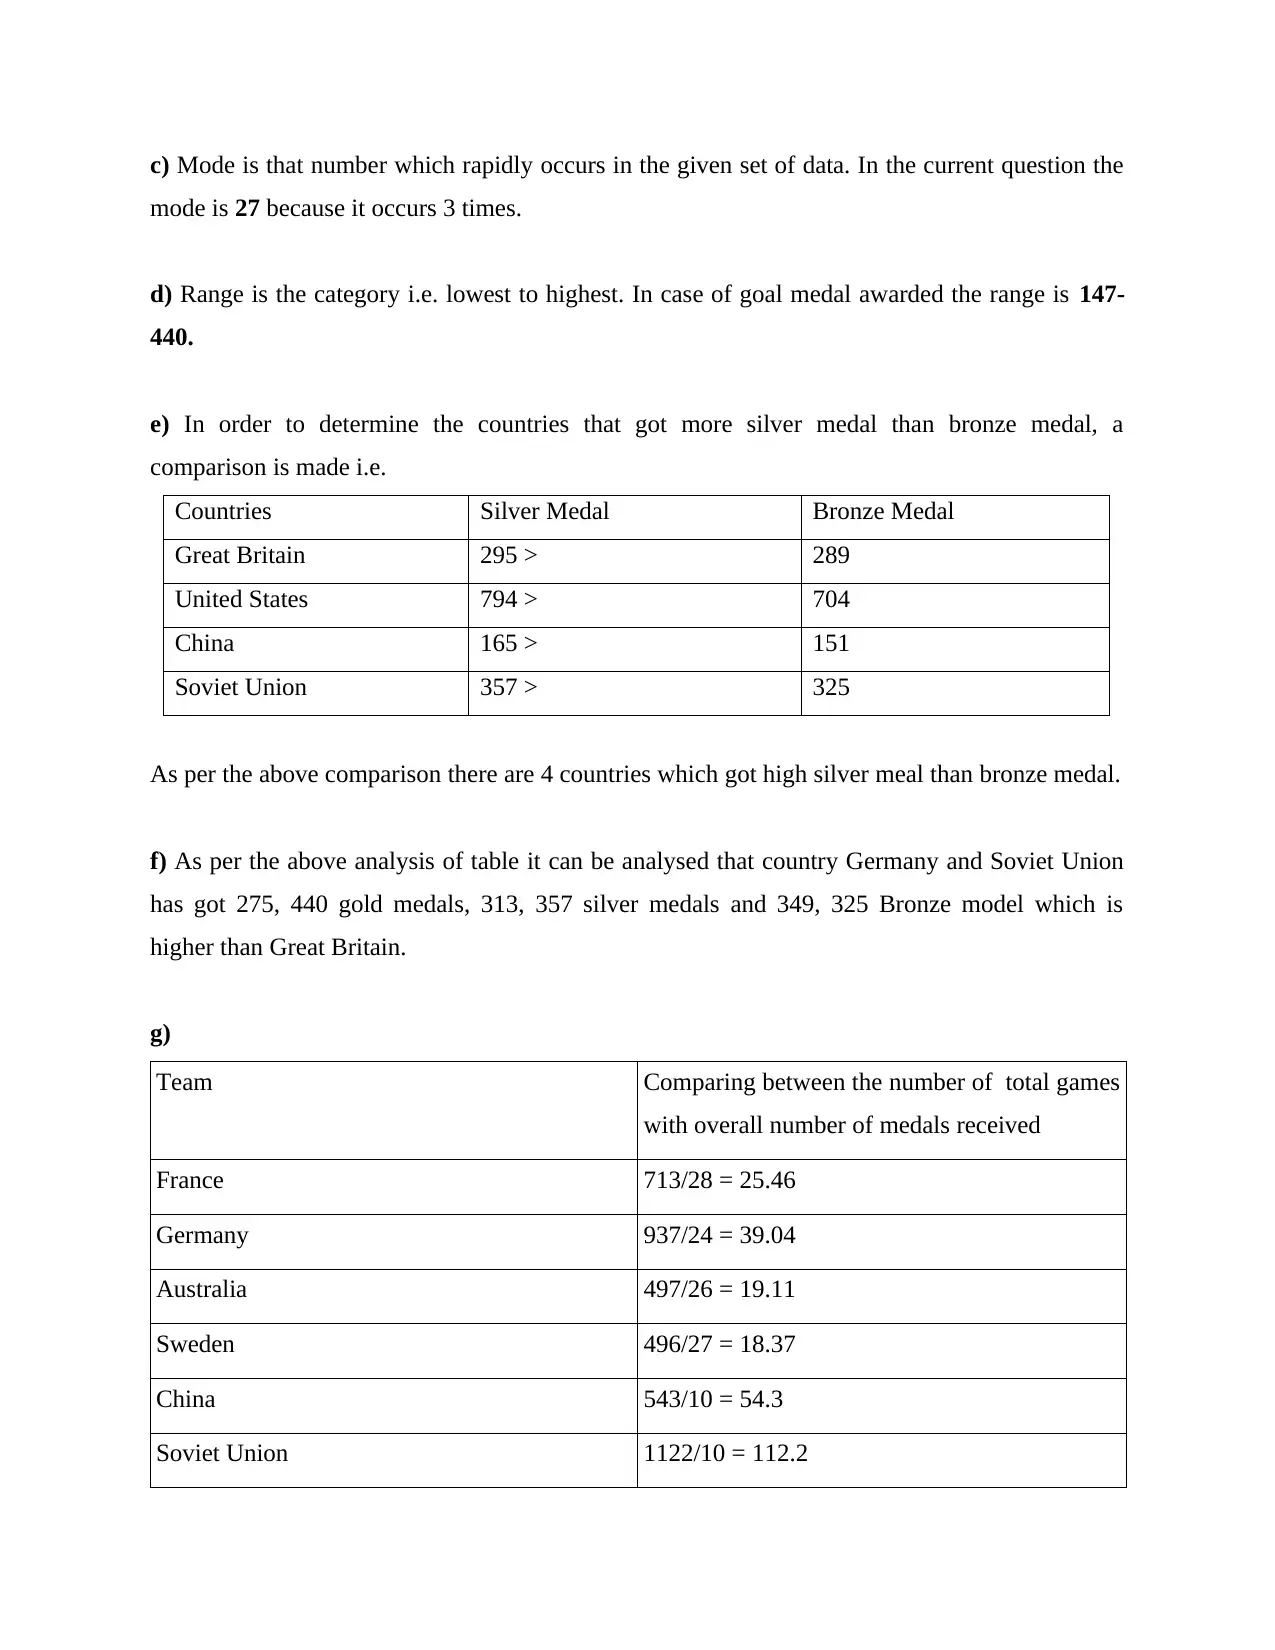
c) Mode is that number which rapidly occurs in the given set of data. In the current question the
mode is 27 because it occurs 3 times.
d) Range is the category i.e. lowest to highest. In case of goal medal awarded the range is 147-
440.
e) In order to determine the countries that got more silver medal than bronze medal, a
comparison is made i.e.
Countries Silver Medal Bronze Medal
Great Britain 295 > 289
United States 794 > 704
China 165 > 151
Soviet Union 357 > 325
As per the above comparison there are 4 countries which got high silver meal than bronze medal.
f) As per the above analysis of table it can be analysed that country Germany and Soviet Union
has got 275, 440 gold medals, 313, 357 silver medals and 349, 325 Bronze model which is
higher than Great Britain.
g)
Team Comparing between the number of total games
with overall number of medals received
France 713/28 = 25.46
Germany 937/24 = 39.04
Australia 497/26 = 19.11
Sweden 496/27 = 18.37
China 543/10 = 54.3
Soviet Union 1122/10 = 112.2
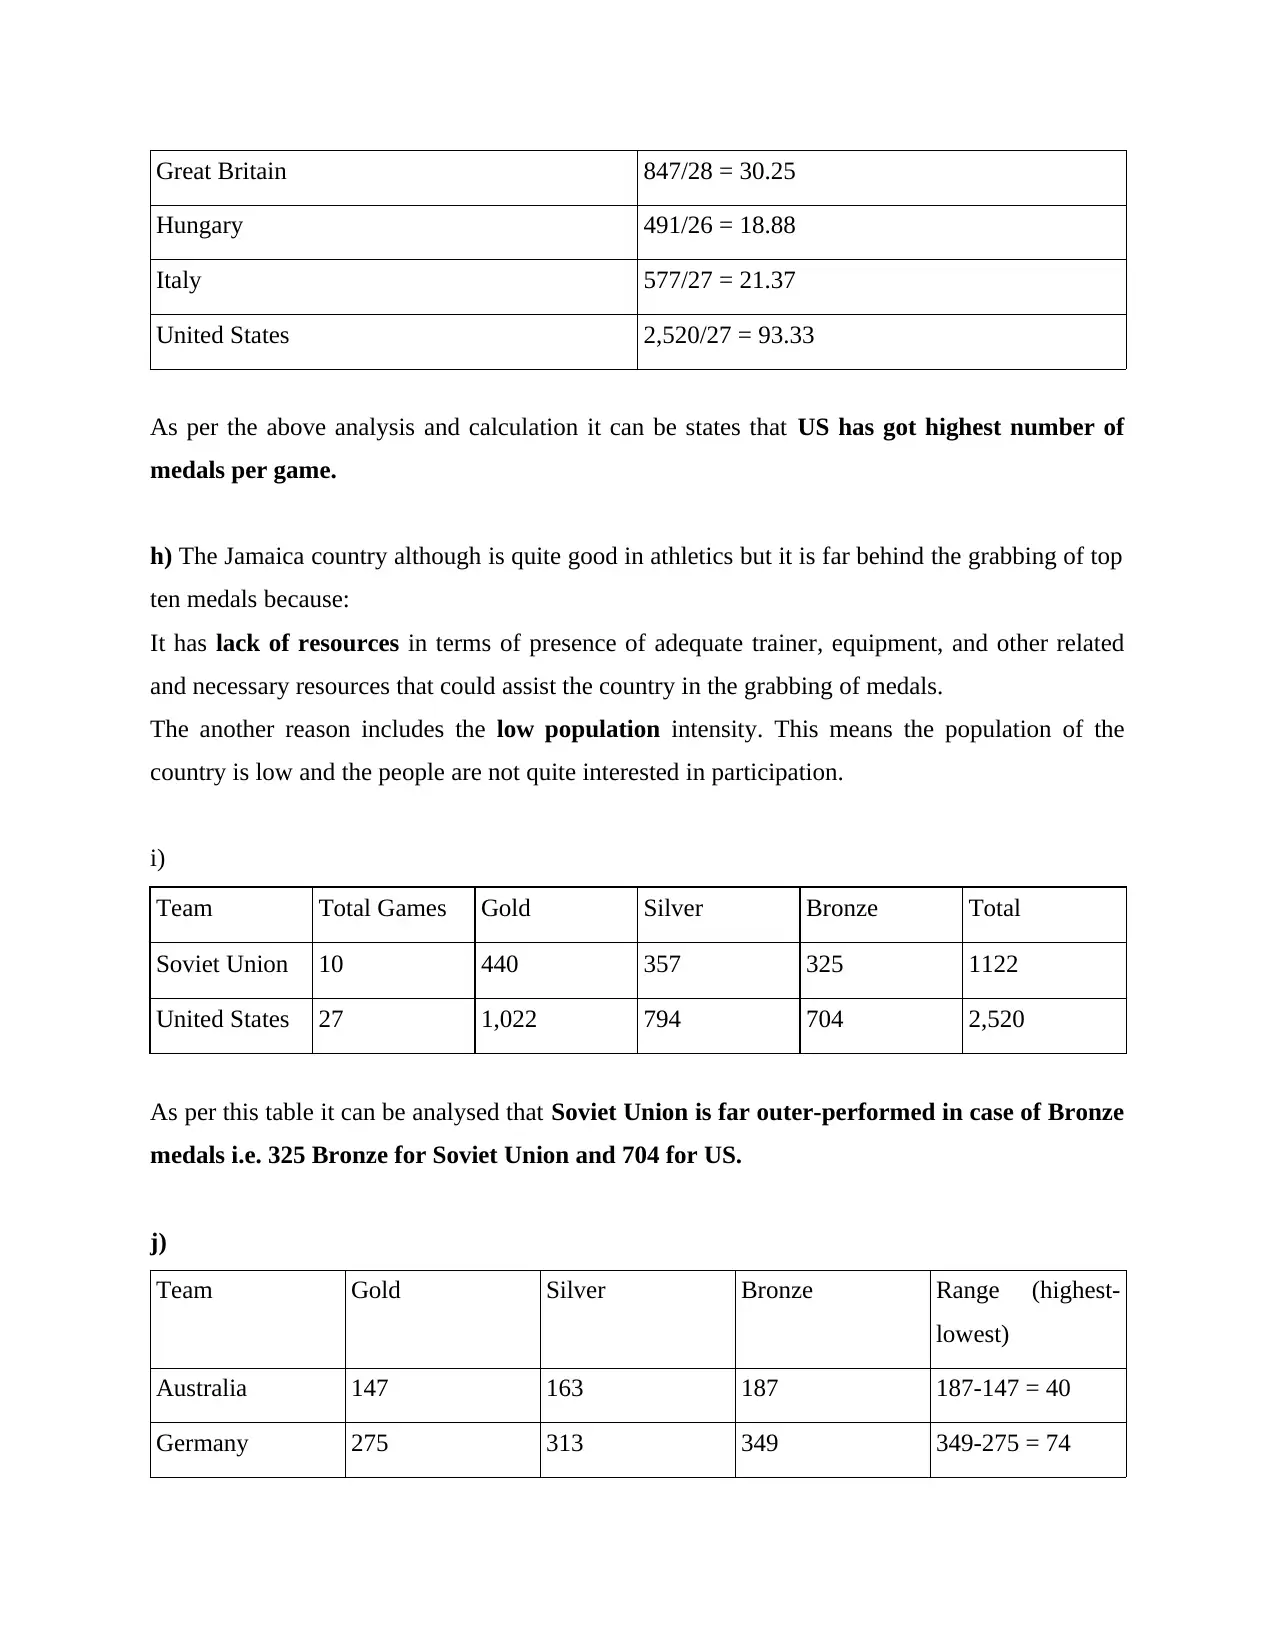
Great Britain 847/28 = 30.25
Hungary 491/26 = 18.88
Italy 577/27 = 21.37
United States 2,520/27 = 93.33
As per the above analysis and calculation it can be states that US has got highest number of
medals per game.
h) The Jamaica country although is quite good in athletics but it is far behind the grabbing of top
ten medals because:
It has lack of resources in terms of presence of adequate trainer, equipment, and other related
and necessary resources that could assist the country in the grabbing of medals.
The another reason includes the low population intensity. This means the population of the
country is low and the people are not quite interested in participation.
i)
Team Total Games Gold Silver Bronze Total
Soviet Union 10 440 357 325 1122
United States 27 1,022 794 704 2,520
As per this table it can be analysed that Soviet Union is far outer-performed in case of Bronze
medals i.e. 325 Bronze for Soviet Union and 704 for US.
j)
Team Gold Silver Bronze Range (highest-
lowest)
Australia 147 163 187 187-147 = 40
Germany 275 313 349 349-275 = 74
⊘ This is a preview!⊘
Do you want full access?
Subscribe today to unlock all pages.
Trusted by 1+ million students worldwide
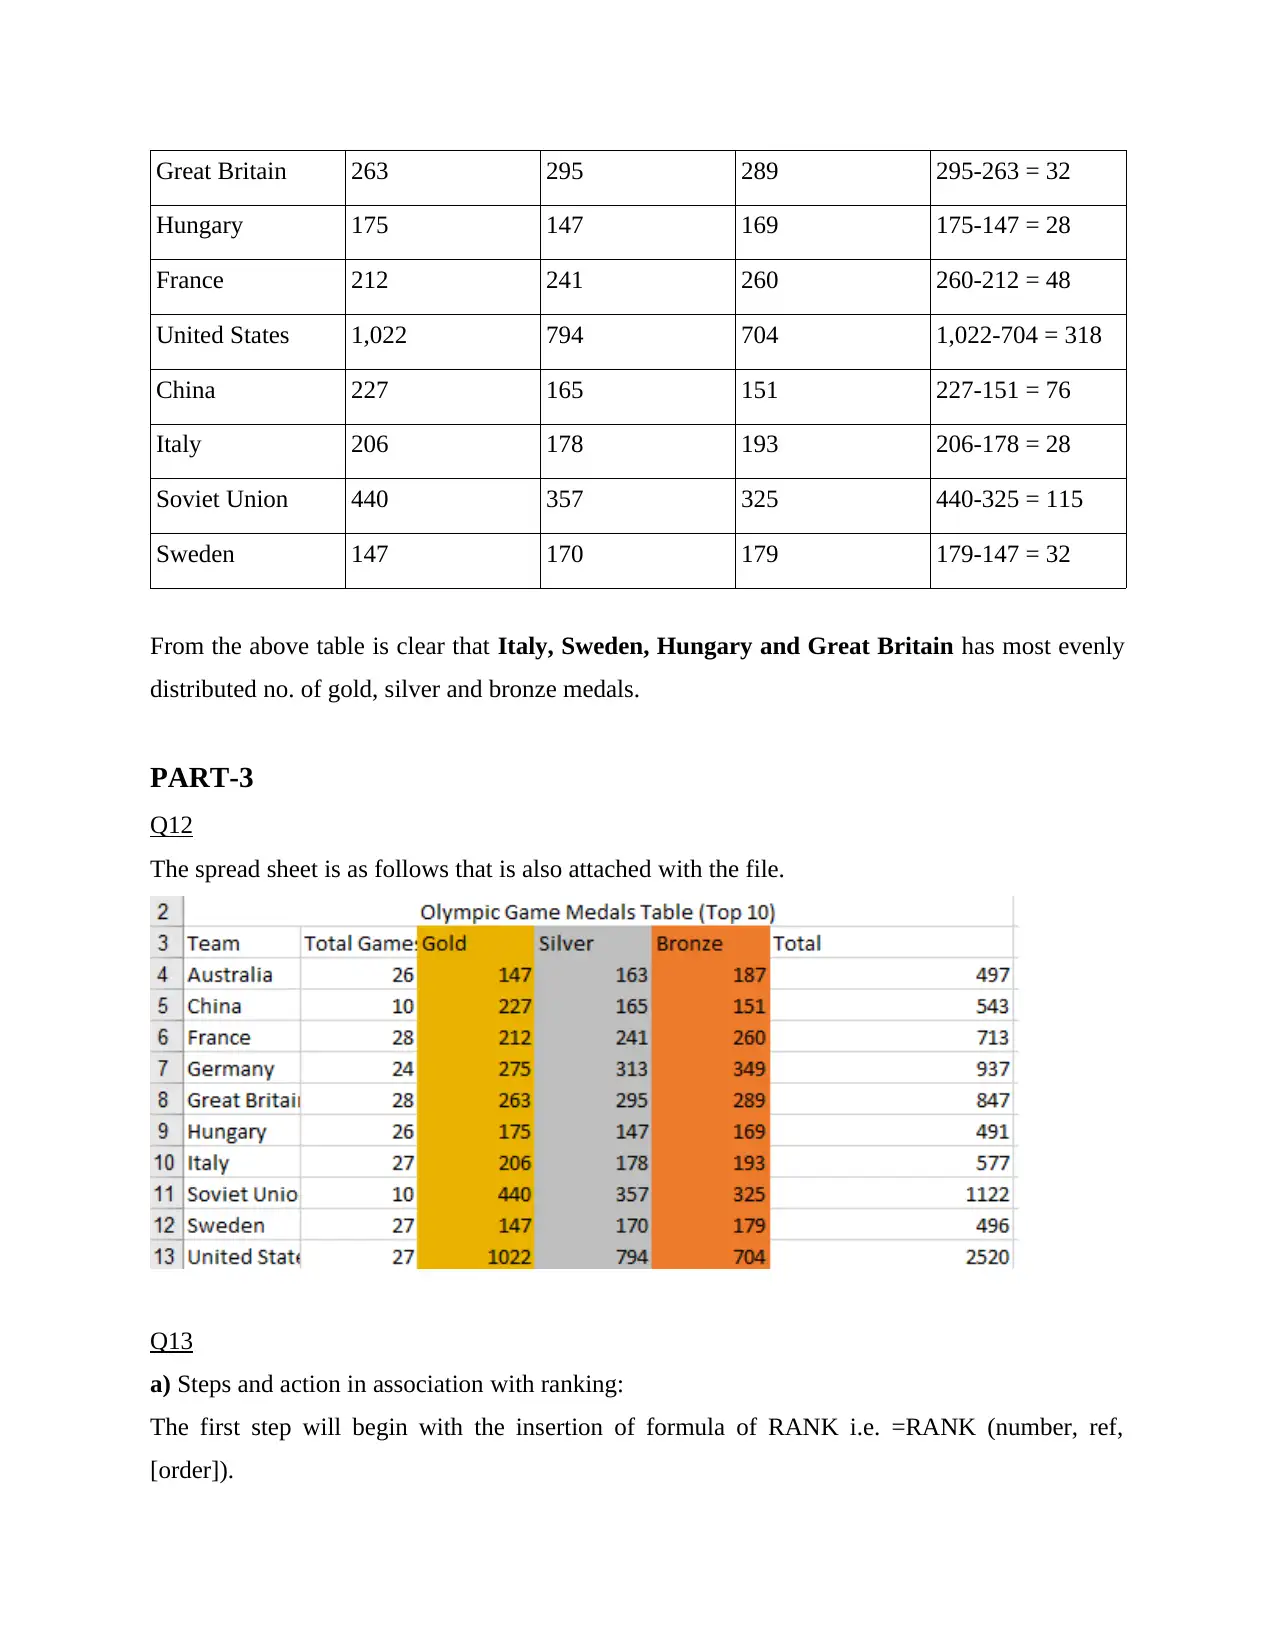
Great Britain 263 295 289 295-263 = 32
Hungary 175 147 169 175-147 = 28
France 212 241 260 260-212 = 48
United States 1,022 794 704 1,022-704 = 318
China 227 165 151 227-151 = 76
Italy 206 178 193 206-178 = 28
Soviet Union 440 357 325 440-325 = 115
Sweden 147 170 179 179-147 = 32
From the above table is clear that Italy, Sweden, Hungary and Great Britain has most evenly
distributed no. of gold, silver and bronze medals.
PART-3
Q12
The spread sheet is as follows that is also attached with the file.
Q13
a) Steps and action in association with ranking:
The first step will begin with the insertion of formula of RANK i.e. =RANK (number, ref,
[order]).
Paraphrase This Document
Need a fresh take? Get an instant paraphrase of this document with our AI Paraphraser
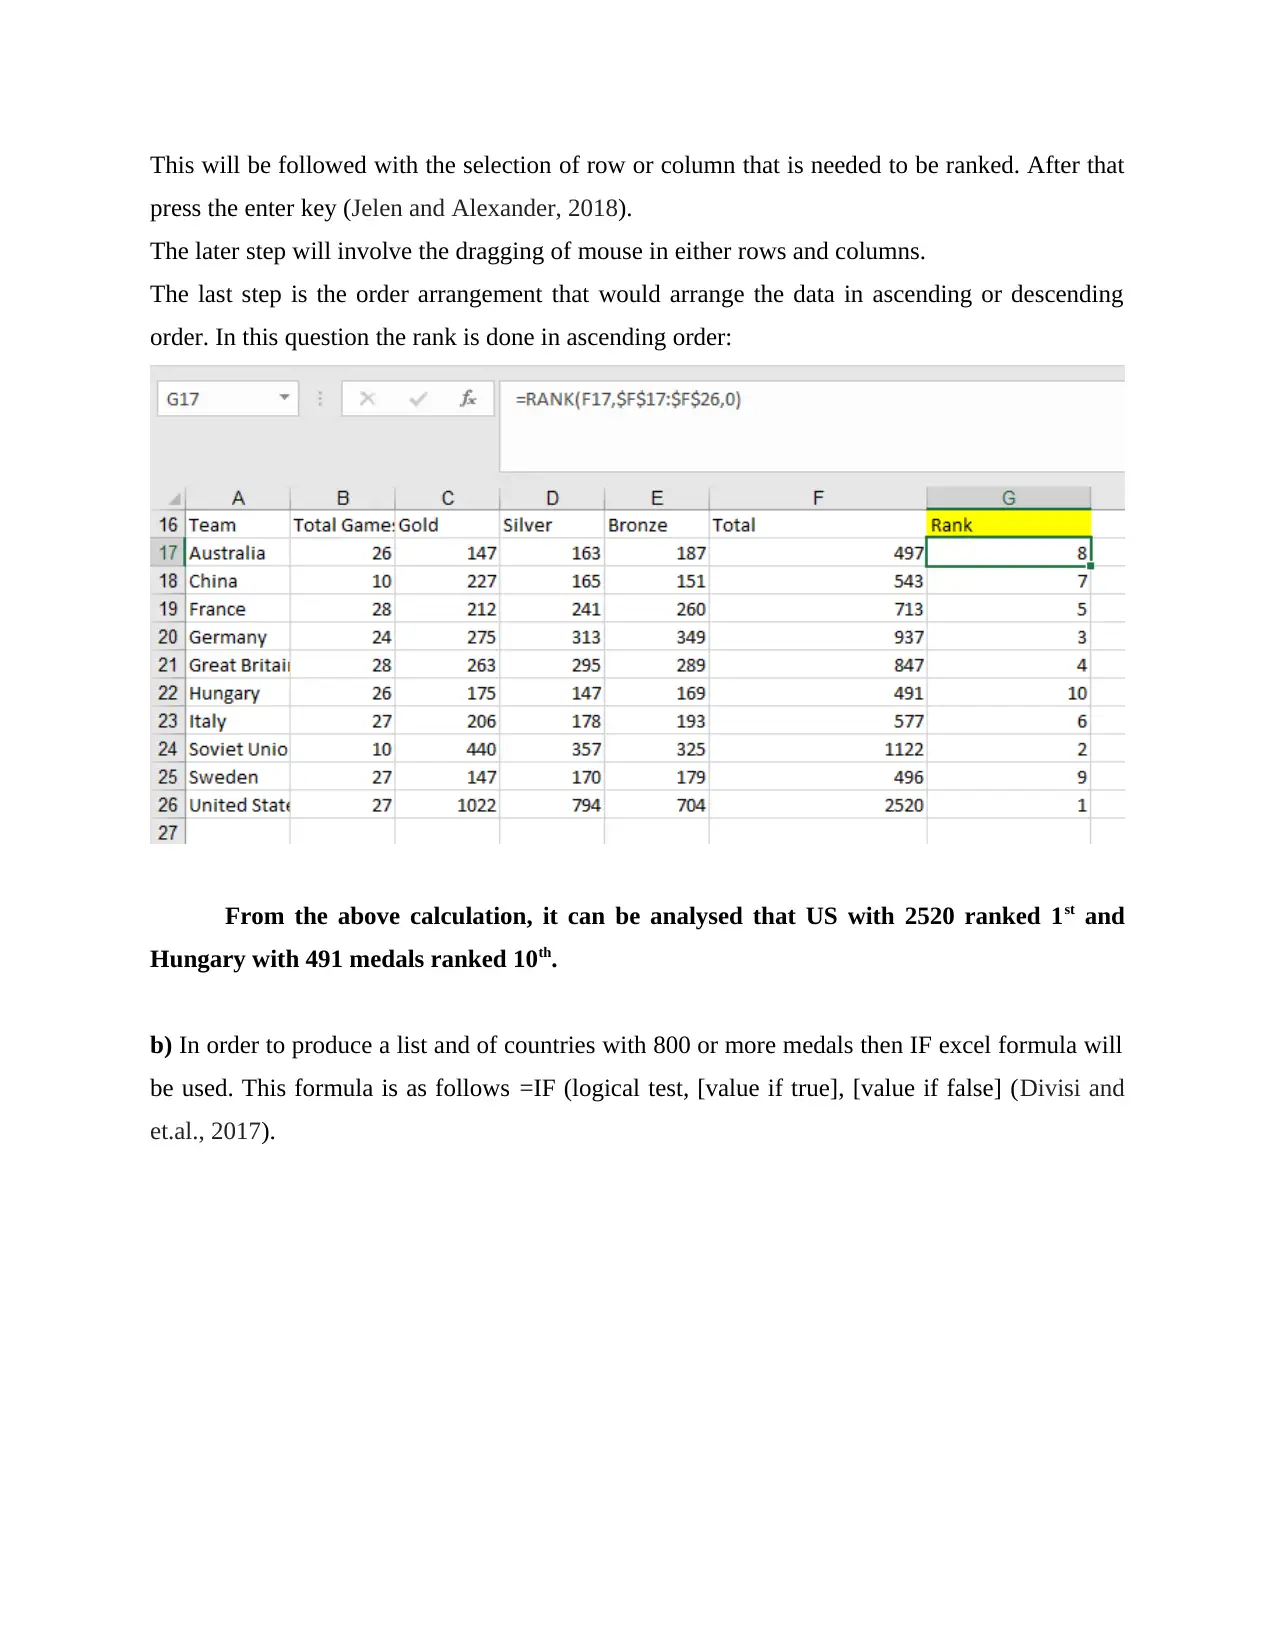
This will be followed with the selection of row or column that is needed to be ranked. After that
press the enter key (Jelen and Alexander, 2018).
The later step will involve the dragging of mouse in either rows and columns.
The last step is the order arrangement that would arrange the data in ascending or descending
order. In this question the rank is done in ascending order:
From the above calculation, it can be analysed that US with 2520 ranked 1st and
Hungary with 491 medals ranked 10th.
b) In order to produce a list and of countries with 800 or more medals then IF excel formula will
be used. This formula is as follows =IF (logical test, [value if true], [value if false] (Divisi and
et.al., 2017).
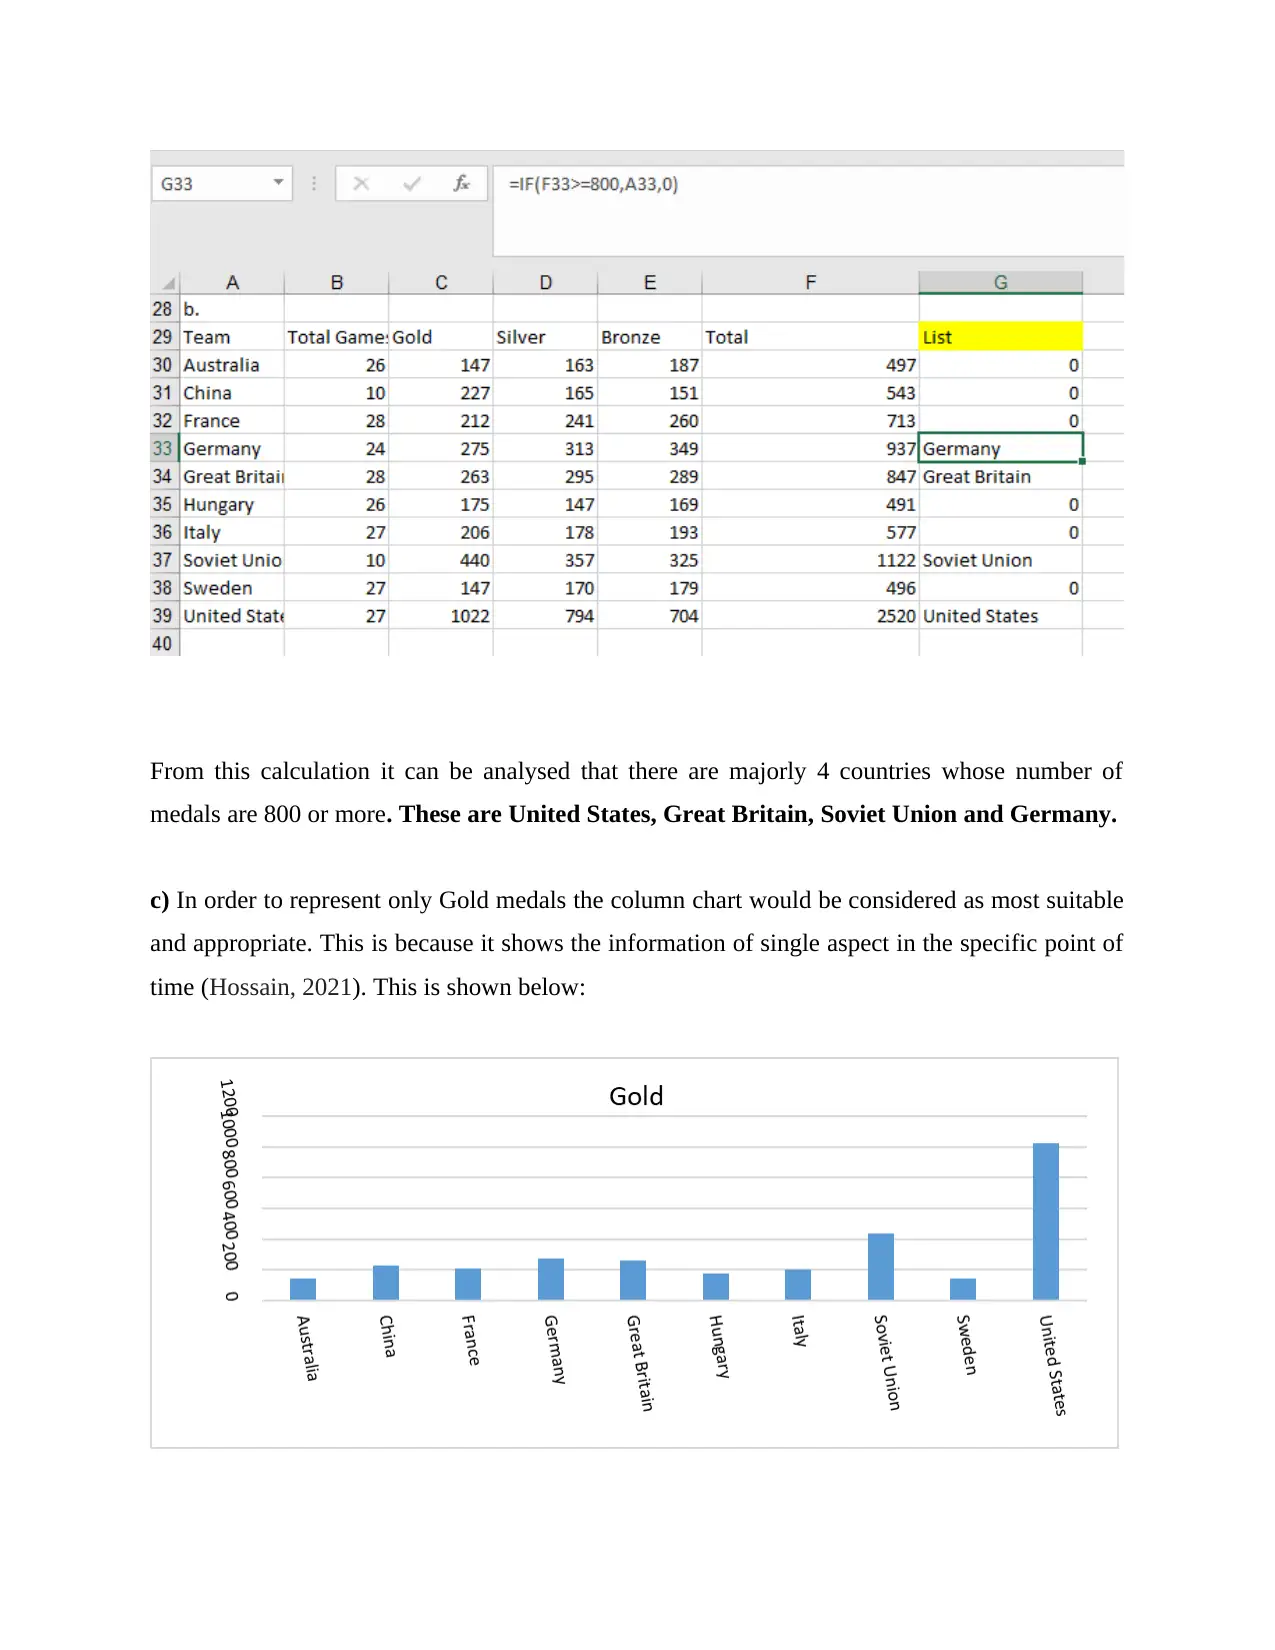
From this calculation it can be analysed that there are majorly 4 countries whose number of
medals are 800 or more. These are United States, Great Britain, Soviet Union and Germany.
c) In order to represent only Gold medals the column chart would be considered as most suitable
and appropriate. This is because it shows the information of single aspect in the specific point of
time (Hossain, 2021). This is shown below:
⊘ This is a preview!⊘
Do you want full access?
Subscribe today to unlock all pages.
Trusted by 1+ million students worldwide
1 out of 21
Related Documents


Your All-in-One AI-Powered Toolkit for Academic Success.
+13062052269
info@desklib.com
Available 24*7 on WhatsApp / Email
![[object Object]](/_next/static/media/star-bottom.7253800d.svg)
Unlock your academic potential
Copyright © 2020–2026 A2Z Services. All Rights Reserved. Developed and managed by ZUCOL.