Solved: Numeracy, Data, and IT Assignment - Detailed Answers
VerifiedAdded on 2023/06/18
|20
|3945
|316
Homework Assignment
AI Summary
This assignment solution covers various aspects of numeracy, data analysis, and IT concepts. It includes detailed explanations for problems related to fractions, percentages, and data interpretation. The solution demonstrates how to simplify fractions, calculate percentages in real-world scenarios, and perform data analysis tasks such as finding modes, ranges, and comparing data sets. The assignment also addresses practical problems involving time management and basic arithmetic calculations. Furthermore, it involves interpreting data from a medal table to identify countries with the lowest number of medals, countries competing in the least number of games, and analyzing medal distributions. Desklib provides this solved assignment and many other resources to aid students in their studies.
NUMERACY, DATA AND IT
Paraphrase This Document
Need a fresh take? Get an instant paraphrase of this document with our AI Paraphraser
TABLE OF CONTENT
PART 1............................................................................................................................................3
Question 1....................................................................................................................................3
Question 2....................................................................................................................................4
Question 3....................................................................................................................................4
Question 4....................................................................................................................................6
Question 5....................................................................................................................................6
Question 6....................................................................................................................................6
Question 7....................................................................................................................................8
Question 8....................................................................................................................................8
Question 9....................................................................................................................................9
Question 10..................................................................................................................................9
PART 2..........................................................................................................................................10
Question 11................................................................................................................................10
PART 3..........................................................................................................................................12
Question 12................................................................................................................................12
Question 13................................................................................................................................13
Question 14................................................................................................................................14
Question 15................................................................................................................................15
Question 16................................................................................................................................17
REFERENCES..............................................................................................................................20
PART 1
Question 1
Numerator:
Numerator term define as a number which is above the fraction line and it signifies that
the number is divided by the other number which is below the line (Mendez-Carbajo, Jefferson
and Stierholz, 2019). The numerator part can be termed as the dividend.
For an example: 24/4 = 6 Answer
Here it shows that the 24 is numerator which is above the fraction line called as a dividend.
Denominator:
Denominator term define as a number which present below the fraction line and it shows
as the divisor to the numerator. Denominator number can be shown as a divisor.
For an example: 40/10 = 4 solution
⊘ This is a preview!⊘
Do you want full access?
Subscribe today to unlock all pages.
Trusted by 1+ million students worldwide
This example shows that the 10 is the denominator which is below to the fraction line and can be
named as a divisor.
Question 2
The Simplest form: It defines as the numerator and denominator can be termed as in the
simplest form when the number are prime number. Prime numbers are those number which are
only divide by one or either by itself. As they do not consist of the common factor rather than
one (1) number which is allowed (Russo, 2019).
Step 1 Suggested steps to simplify the 24/40 are as follows.
Here, first to identify the HCF of the numr 24/40
The highest common factor of 24/40 is 8 which come from
2×2×2×3=24
2×2×2×5=40
so the common HCF factor will be 2×2×2=8
Now for the simplest form next step will be to divide both the numerator and denominator by the
HCF number which is 8
24÷8 / 40÷8
24 divides by 8 gives the outcome=3
40 divides by 8 gives the result=5
Therefore, the simplest form of the 24/40 is 3/5
So, the final outcome is 3/5
Step 2 The simplest form for the number 18/42 is as follows
First to find the highest common factor of the 18/42
HCF is as follow 2×3×3= 18
2×3×7=42
so the HCF factor of the 18/42 is 6
now divide both the numerator and denominator by the HCF factor which is 6
18÷ 6 / 42÷ 6
the number 18 divide by 6 gives the result= 3
number 42 divide by the 6 number gives the outcome as=7
so, the possible simplest form of the 18/42 is 3/7
Paraphrase This Document
Need a fresh take? Get an instant paraphrase of this document with our AI Paraphraser
Question 3
A)
Step 1To show the fraction 2/3, multiply the both numerator and denominator by 4
That is 2×4 / 3×4=8/12
To know the reason cross multiplication is the better option as 2×12=24 and 3×8= 24
Therefore, the fraction 2/3 is equivalent to 8/12
Step 2 fractions 3/4 multiply its dividend and divisor by the number 3 so the result will be
3×3 / 4×3= 9/12
by cross multiplying 3×12=36 and 4×9=36
so the fraction 3/4 is equivalent to 9/12
Step 3 fraction 5/6, multiply the denominator and numerator by 2
5×2 / 6×2= 10/12
Cross multiplication result will be 5×12=60 and 6×10=60
so the fraction 5/6 is equivalent to 10/12
hence the fractions 2/3, 3/4, 5/6 are equivalent to 10/12, 9/12, 8/12.
B)
given is that the library has the books (Russo, 2019) around 60,000
the number of books are on the subject business is 14,000
total number of books are based on the healthcare is 22,000
and the books are based on the psychology and law is 12,000
as to find the percentage of the computing books are (Woolcott and et.al 2019).
add all the books that is ( business+ healthcare +psychology and law)
(14,000+ 22,000
+12,000)= 48,000
subtract the 48000 from the total book present in the library that is 60,000
60,000- 48000= 12000
final remainder is 12000
So, the computing book is 2/3 of the remainder (Wallace and et.al 2019).
hence the computing book are=2/3 ×12000
final result is 8000
finally the percentage of the computing book are= 8000/60000 ×100= 13.33 hence solved
Question 4
As Liz gives the sales attendant a note of £50 to purchase the pair of running shoes
therefore she takes the change of £10.50
the price for each pair of the running shoes is to subtract the change money from the total money
that is 50- 10.50= 39.50
the number of shoes are=2
divide the 39.50 by 2 to get the result
39.50/2 =19.75
so the price of each pair of shoes is 19.75 answer
Question 5
A)
the multiplication of the number 240.50 x 19.54 =4699.37
b)
the number 52100 as a power of 10 is equal to
5.21×10
Question 6
A)
As the gym is offering about 30% discount it means they have paid the 70%
which is by that the total percentage is 100 so 100-30=70
it means they have already paid 705 out of 100%
to identify the total saving (Litkowski and et.al 2020). we want to find that total cost without
promo and eliminate it from the payment mode of 70%
payment mode 70%=£210
1% would be=210/70=£3
so point is if the 1% is £3 then the 100% of this will be £300
and the gym offer of 100% is equal to £300
⊘ This is a preview!⊘
Do you want full access?
Subscribe today to unlock all pages.
Trusted by 1+ million students worldwide
so the final total saving which is made= total number of the cost offered by gym- 70% of the
payment mode
that is £300-£210= £90
so the final saving made is £90 answer.
b)
the average saving per person define as
the total amount is =210
and the saving is =30%
hence the total saving mode= saving * amount
30%*210
=63
average saving would be =total saving divide by the number of person involved which is 3
so 63/3=21
so the final average saving by every person is 21 answer
Paraphrase This Document
Need a fresh take? Get an instant paraphrase of this document with our AI Paraphraser
Question 7
a)
the solution for the
3/4 - 7/9 + 2/3
3/4=0.75
7/9=0.77
2/3=0.66
therefore 0.75-0.77+0.66= 0.64 final answer
b)
the largest of the following numbers
0.1, 0.02, 0.003, 0.0004, 0.00005
0.1 is the largest in all the number second largest is 0.02 so the following order will be
0.1>0.02>0.003> 0.0004> 0.00005
Question 8
Total number of the men are=90
Total number of the women are=60
so the total number of the people would be =addition of women or men
that is 90+60
=150
the data of the people who have said yes that have watched the ‘Expendables’ movie =3/5
so 3/5 of total is 3/5*150= 90
total number of women who said yes=3/10 that is the total women
3/10*60=18
and the total number of men who said yes= the total number of people who said yes that they
have watched the movie-total number of women who said yes
=90-18
=72
the percentage of the men who said no = total number of the men who said yes is subtracted by
the total number of men
=90-72
=18
so the final percentage which the men said no is 18/90*100
=20%
Question 9
As the Birmingham conference start from 10.30am time. So Annabelle have to leave her house
at the 8:00 AM as because to reach at the Euston rail station it required an 1 hour so that she will
reach at the station at the time of 9:00 AM. The Birmingham train depart at 5 minute after an
hour, it takes 25 minute in the hour and 45 minutes in the hour (Patterson and Xu, 2020). Which
analyse that she will board at the train around 9:05 AM. And she will reach to the Birmingham
station at 10:15AM after 1:10 minutes on the train from the Euston station. She will reach to the
Birmingham meeting conference at time 10:20 AM because the Birmingham station is only 5
minute walk away from meeting place. She will reach the conference before the scheduled time
of the meeting, to give the time for preparation of the meeting. To chase the mark of 10 minutes
and that she lives at 8:30 Am she will reach to the station at time of 9:10 AM based on the
schedule of the train then she board at the train on 9:25 AM time which suggests that she will
late for the meeting by the 10 minutes of time (Grebitus and Davis, 2019).
Question 10
The box of the shredded wheat weigh=0.35 kg
and the box of the Weetabix weighs =9/25 kg
therefore the weetabix box is heavier by the 0.001 kg
weetabix box 9/25=0.36 kg
so that the weetabix box is 0.36 kg and the shredded wheat weigh is 0.35 kg
therefore the weetabix box is heavy by 0.001 kg than the shredded wheat box.
⊘ This is a preview!⊘
Do you want full access?
Subscribe today to unlock all pages.
Trusted by 1+ million students worldwide
PART 2
Question 11
A)
the country which have the lowest number of the medals among all the countries is Hungary they
have only 491 medals which is they have played total 26 games in which they get the 175 gold
medals, 147 silver medals, 169 bronze medals (Mutaf-Yıldız and et.al 2020).
so the total number of medals are=175+147+169
=491 medals
B)
the country which have competed in the least number of games are two country which is China
and the Soviet union (Piper and et.al 2018). Both countries have played only 10 games each.
C)
Mode define as the number which occur more often therefore in the game. Therefore the number
of games in which the countries have been participated is 27
D)
the range of the gold medals awarded to the 10 countries is 147- 1022
China, Great Britain, Soviet Union and United State. China gold medal=227
Great Britain gold medal=263
Soviet Union gold medal=440
United State gold medal=1022
E)
the countries which have got the more silver medals than the bronze medals are-
china, Great Britain, Soviet union and United state
China country won 165 silver and 151 bronze medal which is 14 more silver medal
Great Britain country won 295 silver and 289 bronze medal which is 6 silver medal
Soviet union country won 357 silver and 325 bronze medal which is 32 silver medal
United state country won 794 silver and 704 bronze medal which is 90 silver medal
F)
the countries who have got more gold, silver and bronze medal than the Great Britain are
Germany and the Soviet union
Paraphrase This Document
Need a fresh take? Get an instant paraphrase of this document with our AI Paraphraser
Germany gold medal=275, silver medal=313, bronze medal=349
Soviet union gold medal=440, silver medal=357, bronze medal=325 and the medals of the Great
Britain are gold medal=263, silver medal=295, bronze medal=289 which is lower than the both
Soviet Union and the Germany country.
G)
United states play a good game they have won maximum medals in their game as the country
played the total number of game which is 27 as compared to the Sweden and Italy both country
also played 27 games but US won the maximum gold, silver and the Bronze medal
the total number of medal country won in every game is 2,520
total number of gold medal are= 1,022
total number of gold medal are= 794
total number of gold medal are= 704
this ratio is maximum hence US country won the medals which is comparatively more than
every country's medal.
H)
After performing well in their games still Jamaica country does not register their position in the
top 10 because of lack of training among the players. Players of the team does nit get the proper
training and coaching it reflects in their game (Kalogeropoulos and et.al 2019). Also, because of
this they do not able to maintain their coordination. So lack of the coordination also affects the
game of their player so the player loose their concentration in the game and not able to win the
maximum medals for the country. Another reason would be the physical fitness issue among the
players as some players are fit and some were injured it affects their game. Therefore, these are
the two reason which stops the Jamaica country to make position in the top 10.
I)
United state score the maximum in their game therefore they have won more medals than the
other countries but the Soviet union country also did better in their game they also got good
range of gold, silver and bronze medal.
US medal range is 1022 gold medal, 794 silver medal, 704 bronze medal total medals are 2,520
and the total medal won by the Soviet union country is 1122 in which the gold medal=440
silver medal=357
Bronze medal=325
J)
the three countries which have the most evenly distributed number of golds, silver and the
Bronze medals are Australia, Hungary, Sweden country
Australia gold medal=147 , silver medal=163 bronze medal=187 total medal=497
Hungary gold medal=175 , silver medal=147 bronze medal=169 total medal=491
Sweden gold medal=147 , silver medal=170 bronze medal=179 total medal=496
PART 3
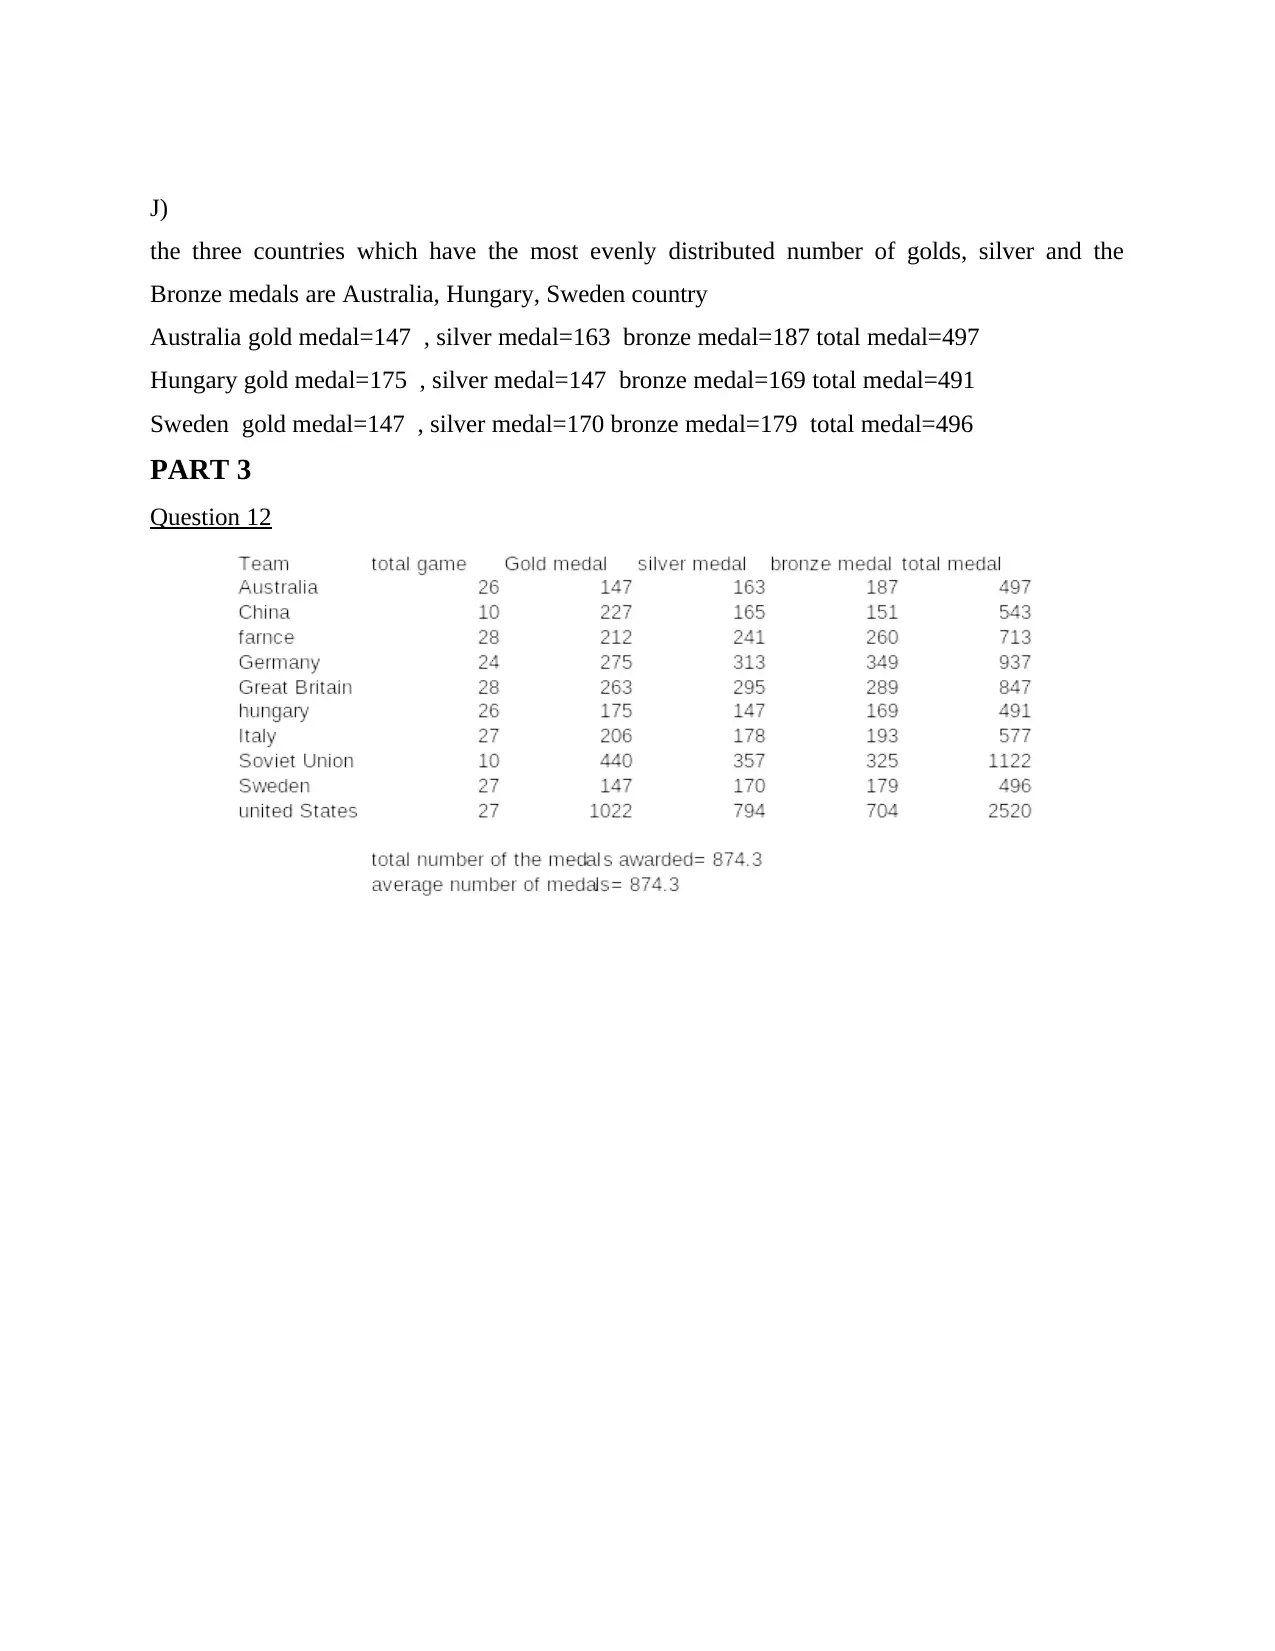
Question 12
the three countries which have the most evenly distributed number of golds, silver and the
Bronze medals are Australia, Hungary, Sweden country
Australia gold medal=147 , silver medal=163 bronze medal=187 total medal=497
Hungary gold medal=175 , silver medal=147 bronze medal=169 total medal=491
Sweden gold medal=147 , silver medal=170 bronze medal=179 total medal=496
PART 3
Question 12
⊘ This is a preview!⊘
Do you want full access?
Subscribe today to unlock all pages.
Trusted by 1+ million students worldwide
1 out of 20
Related Documents


Your All-in-One AI-Powered Toolkit for Academic Success.
+13062052269
info@desklib.com
Available 24*7 on WhatsApp / Email
![[object Object]](/_next/static/media/star-bottom.7253800d.svg)
Unlock your academic potential
Copyright © 2020–2026 A2Z Services. All Rights Reserved. Developed and managed by ZUCOL.