Numeracy Data and IT Assignment: Step-by-Step Solutions & Analysis
VerifiedAdded on 2023/06/17
|22
|3449
|483
Homework Assignment
AI Summary
This document presents a comprehensive solution to a Numeracy Data and IT assignment, covering various aspects of data interpretation, statistical analysis, and IT applications. The solution includes calculations related to fractions, percentages, and data analysis using tools like Excel. It addresses questions on simplifying fractions, calculating equivalent fractions, and applying formulas for rank and conditional logic. The assignment also involves interpreting data from the Olympic Games, calculating averages, and identifying trends. Furthermore, it demonstrates the use of Excel for data manipulation, chart creation, and replication of formulas. The document provides step-by-step explanations and solutions to each question, offering valuable insights into numeracy and IT skills. Desklib provides more solved assignments for students.
USING NUMERACY DATA AND
IT
IT
Paraphrase This Document
Need a fresh take? Get an instant paraphrase of this document with our AI Paraphraser
Table of Contents
PART 1..............................................................................................................................................4
Q1.................................................................................................................................................4
Q2.................................................................................................................................................4
Q3.................................................................................................................................................4
Q4.................................................................................................................................................5
Q5.................................................................................................................................................5
Q6.................................................................................................................................................5
Q7.................................................................................................................................................6
Q8.................................................................................................................................................6
Q9.................................................................................................................................................7
Q10...............................................................................................................................................7
PART 2..............................................................................................................................................7
Question 11.a...............................................................................................................................7
Question 11.b...............................................................................................................................7
Question 11.c...............................................................................................................................7
Question 11.d...............................................................................................................................7
Question 11.e...............................................................................................................................7
Question 11.f...............................................................................................................................8
Question 11.g...............................................................................................................................8
Question 11.h...............................................................................................................................8
Question 11.i................................................................................................................................8
Question 11.j................................................................................................................................9
PART 3: USING IT..............................................................................................................................9
Question 12..................................................................................................................................9
Question 13................................................................................................................................10
a)................................................................................................................................................10
b)................................................................................................................................................10
c).................................................................................................................................................11
d)................................................................................................................................................12
e)................................................................................................................................................12
Question 14................................................................................................................................13
a)................................................................................................................................................13
b)................................................................................................................................................13
c).................................................................................................................................................14
d)................................................................................................................................................15
Question 15................................................................................................................................15
a)................................................................................................................................................15
b)................................................................................................................................................16
c).................................................................................................................................................17
d)................................................................................................................................................18
Question 16................................................................................................................................19
a)................................................................................................................................................19
b)................................................................................................................................................19
REFERENCES.....................................................................................................................................1
⊘ This is a preview!⊘
Do you want full access?
Subscribe today to unlock all pages.
Trusted by 1+ million students worldwide
PART 1
Q1
Numerator and denominator are two parts of the mathematical term fraction. Fraction is
basically a manner of presenting any number where there are two integers separated by a
division sign. Number before the division sign is referred to as numerator while number after
the division i.e. below numerator is termed as denominator (Bentley and Bossé, 2018). Further,
it can be said that numerator is the selected data out of the total available data set which is
denominator. For instance, ½ indicates 1 as numerator and 2 as denominator i.e. 1 part is
selected out of total 2 parts that are available.
Q2
The process of simplifying any fraction involves identification of Highest Common Factor
i.e. HCF in the integer values present in numerator and denominator (Aksoy and Yazlik, 2017).
In the present case the simplification of 24/40 involves 8 as its HCF. Therefore, both numerator
and denominator are divided by the HCF and it results in the simplest form of fraction i.e. 3/5.
Further on, another fraction i.e. 18/42 involves HCF of 6. Hence the simplest form of this
fraction is 3/7. Conclusively, it can be said that HCF can be used in order to derive any fraction
to its simplest form.
Q3
a) Equivalent fractions basically indicates those fractions which represent similar part out of the
whole i.e. their numbers might be different but they indicate the same fraction value ( Rinne, Ye
and Jordan, 2017). The fraction 2/3, 3/4 and 5/6 can be turned into equivalent fractions having
denominator of 12 by multiplying both numerator and denominator with the same values. For
instance:
2/3 when multiplied by 4/4 will result in new fraction i.e. 8/12.
3/4 will be multiplied by 3/3 to develop new fraction of 9/12.
5/6 can be multiplied with 2/2 thus resulting in fraction 10/12.
Now all of these fractions have similar denominator of 12 and are equivalent fractions as they
represent similar value.
Paraphrase This Document
Need a fresh take? Get an instant paraphrase of this document with our AI Paraphraser
b) First of all the remaining number of books need to be calculated in order to derive the
percentage of computing books in the library.
Remaining books = 60000 – 14000 – 22000 – 12000 = 12000 books are remaining.
Now it has been said in that computing related books constitute 2/3 of the remaining books i.e.
2/3 of 12000. Hence,
2/3 * 12000 = 8000 books in the library are computing books.
In order to determine the percentage of computer books out of the total number of books in
the library i.e. 60000, computing books will be divided by total and then multiplied by 100 in
order to convert fraction into percentage:
8000/ 60000 * 100 = 13.33% books are related to computing out of all the books.
Q4
Total pair of shoes purchased = 2 pairs
Amount given by Liz to sales attendant = £50 * 3 = £150
Amount given by sales attendant = £10.50.
Hence, cost of 2 pair of shoes actually charged = £150 - £10.50 = £139.5
Now the cost of each pair can be calculated as: £139.5/2 = £69.75
Q5
a)
240.50 * 19.54 can be computed as 4699.37. The result obtained is already in two significant
figures thus showing relevant results.
b)
52100, in the form of power of 10, can be written as 5.21 * 104.
Q6
a)
Total amount paid for Patty and her 2 siblings i.e. 3 people is £210 and they registered in
the first month when discount was being given by the gym @ 30%. This indicates that the £210
is equivalent to the 70% of payment made. Therefore, in order to calculate 100% amount i.e. x:
£210 = 70% of x
x = (£210 / 70) * 100
x = £300
Hence the total amount that would have been paid if discount would not have been given is
£300. Therefore, total discount availed by Patty and her 2 siblings is £300 - £210 = £90.
b)
As it was calculated in the first part, the total discount utilised by Patty and her siblings
i.e. the total savings that they made was £90. And since these savings are for 3 people the
average number of savings per person can be obtained by dividing the total savings with 3:
Average savings per person = £90/3 = £30 savings per person.
Q7
a)
The equation can be solved in following manner:
3/4 -7/9 + 2/3
0.75 – 0.78 + 0.67
0.64 or 16/25
b)
From all the selected numbers, 0.1 is the highest number.
Q8
There were 90 men and 60 women i.e. there were a total of 150 people who were
questioned about the Expendables movie.
Out of total 150 people, 3/5 said yes which indicates that remaining 2/5 said no. Hence,
People saying yes = 150 * 3/5 = 90 people
People who said no = 150 – 90 or 150 * 2/5 i.e. 60 people who said no.
Further, it is indicated clearly that out of 60 women 3/10 of them said yes which means:
60* 3/10 = 18 women said yes i.e.,
60 – 18 = 42 women said no.
It is already identified that total number of people who denies were 60 out of which 42 were
found to be women. This indicates that the number of men who denied watching movie are 18.
The percentage can be calculated as 18/150 * 100 = 12% of men said no.
Q9
It is evident from the above question that Annabelle needs to speak at 10:30 a.ma in
Birmingham and she lives in Bermondsey. She needs to leave her home at 8:00 a.m. because:
⊘ This is a preview!⊘
Do you want full access?
Subscribe today to unlock all pages.
Trusted by 1+ million students worldwide
Time taken to reach Euston Rail Station: 8:00 a.m. + 1 hour = 9:00 a.m.
She will board the train leaving for Birmingham at 9:05 a.m.
Time taken to reach Birmingham = 9:05 a.m. + 1 hour 10 minutes = 10:15 a.m.
Time taken to reach the venue of meeting = 10:15 a.m. + 5 minutes = 10:20 a.m.
Thus she will be able to reach 10 minutes prior to the beginning of the meeting.
Q10
Weight of Shredded wheat box = 0.35 kg
Weight of Weetabix box = 9/25 kg = 0.36 kg
Hence, Weetabix weighs more as it is 0.01 kg heavier than box of Shredded Wheat.
PART 2
Question 11.a
While comparing overall medals received, it can be identified that Hungary is at the
lowest position as it has obtained only 491 medals in total.
Question 11.b
It can be concluded that China and Soviet Union are those countries who played least
number of games in the Olympic Games.
Question 11.c
Mode is that value which is the most repeated observation amongst a set of observations.
Hence, most of the countries have participated in 27 number of total games.
Question 11.d
Range can be calculated by subtracting the lowest value from the highest value in a
recorded set of observations. In the recorded data highest number of gold medals have been
obtained by US with score of 1022 and lowest are 147 obtained by Australia and Sweden.
Hence, range is: 1022 – 147 = 875.
Question 11.e
US, Soviet Union, Great Britain and China are those countries who were able to collect or
achieve more silver medals than bronze ones in Olympic Games.
Question 11.f
Without considering US, countries who got more gold, silver and bronze medals as
compared to Great Britain are Soviet Union and Germany (Wisdom and Kingston, 2017). While
Paraphrase This Document
Need a fresh take? Get an instant paraphrase of this document with our AI Paraphraser
Soviet Union scored 177 gold, 62 silver and 36 bronze medals; Germany scored 12 gold, 18
silver and 60 bronze medals more than Great Britain.
Question 11.g
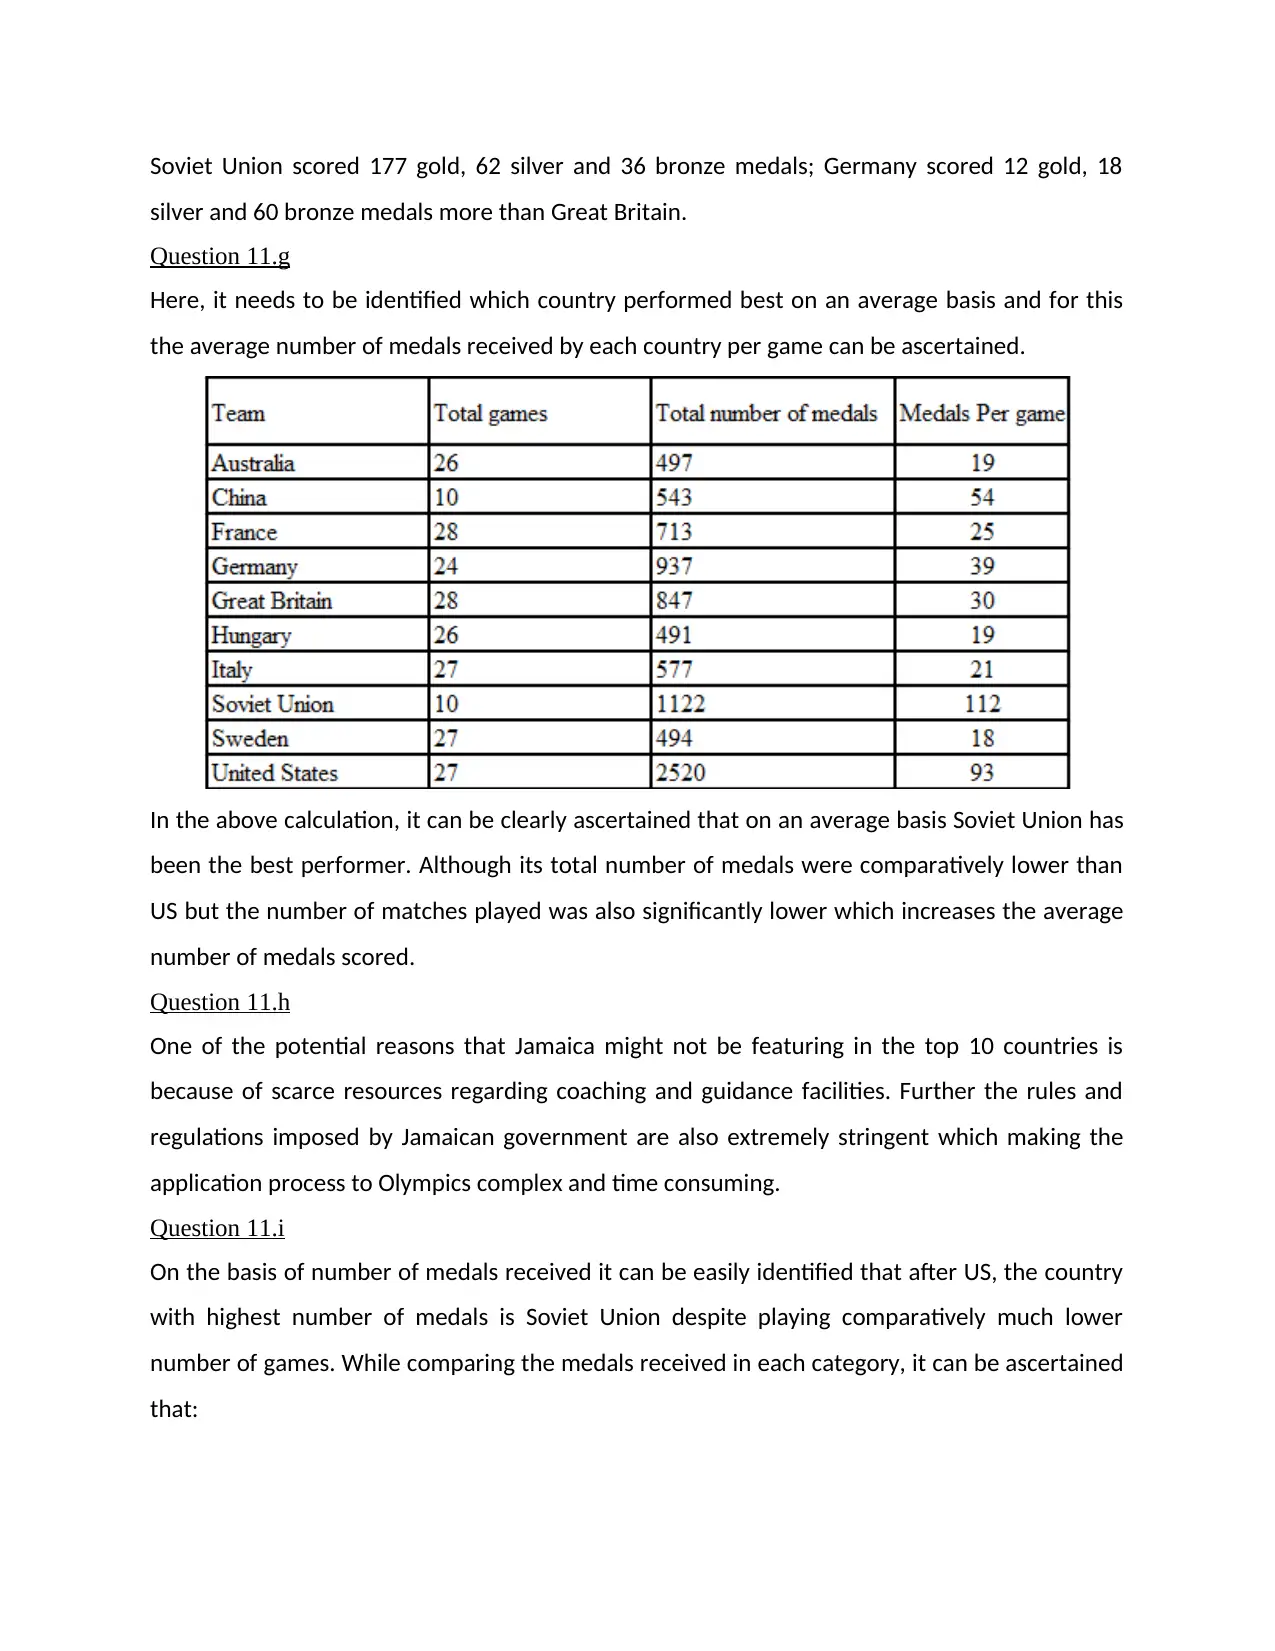
Here, it needs to be identified which country performed best on an average basis and for this
the average number of medals received by each country per game can be ascertained.
In the above calculation, it can be clearly ascertained that on an average basis Soviet Union has
been the best performer. Although its total number of medals were comparatively lower than
US but the number of matches played was also significantly lower which increases the average
number of medals scored.
Question 11.h
One of the potential reasons that Jamaica might not be featuring in the top 10 countries is
because of scarce resources regarding coaching and guidance facilities. Further the rules and
regulations imposed by Jamaican government are also extremely stringent which making the
application process to Olympics complex and time consuming.
Question 11.i
On the basis of number of medals received it can be easily identified that after US, the country
with highest number of medals is Soviet Union despite playing comparatively much lower
number of games. While comparing the medals received in each category, it can be ascertained
that:
silver and 60 bronze medals more than Great Britain.
Question 11.g
Here, it needs to be identified which country performed best on an average basis and for this
the average number of medals received by each country per game can be ascertained.
In the above calculation, it can be clearly ascertained that on an average basis Soviet Union has
been the best performer. Although its total number of medals were comparatively lower than
US but the number of matches played was also significantly lower which increases the average
number of medals scored.
Question 11.h
One of the potential reasons that Jamaica might not be featuring in the top 10 countries is
because of scarce resources regarding coaching and guidance facilities. Further the rules and
regulations imposed by Jamaican government are also extremely stringent which making the
application process to Olympics complex and time consuming.
Question 11.i
On the basis of number of medals received it can be easily identified that after US, the country
with highest number of medals is Soviet Union despite playing comparatively much lower
number of games. While comparing the medals received in each category, it can be ascertained
that:
Gold Medal category: 440/1022 *100 = 43% i.e. Soviet Union was able to score 43% gold
medals as compared to US.
Silver: 357/794 * 100 = 45% i.e. Soviet Union was able to achieve only 45% of the silver medals.
Bronze: 325/704 * 100 = 46% of the bronze medals were scored by Soviet Union in comparison
to US.
Therefore, since the percentage is lowest in Gold category, it indicates that Soviet Union was
able to score only 43% of the total gold medals achieved by USA. Hence it can be said that US
performed best in Gold medal category.
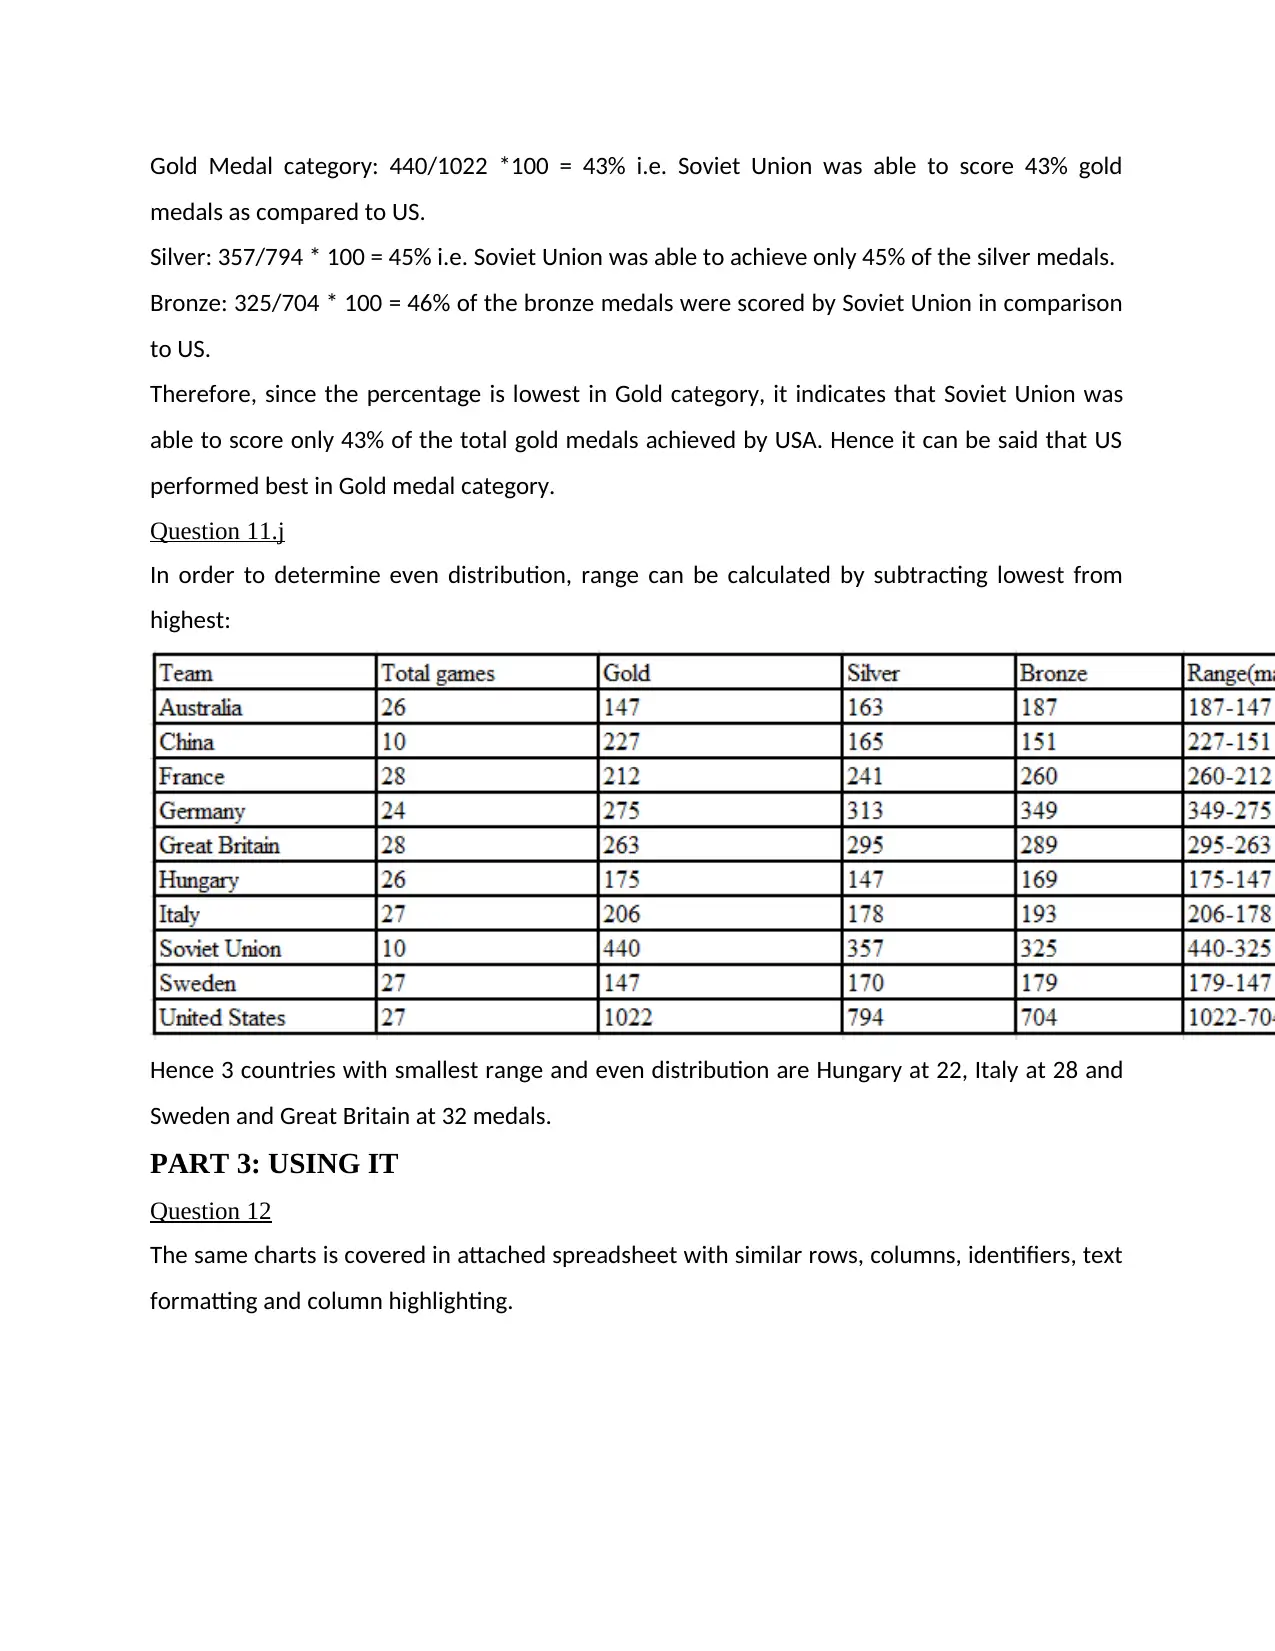
Question 11.j
In order to determine even distribution, range can be calculated by subtracting lowest from
highest:
Hence 3 countries with smallest range and even distribution are Hungary at 22, Italy at 28 and
Sweden and Great Britain at 32 medals.
PART 3: USING IT
Question 12
The same charts is covered in attached spreadsheet with similar rows, columns, identifiers, text
formatting and column highlighting.
medals as compared to US.
Silver: 357/794 * 100 = 45% i.e. Soviet Union was able to achieve only 45% of the silver medals.
Bronze: 325/704 * 100 = 46% of the bronze medals were scored by Soviet Union in comparison
to US.
Therefore, since the percentage is lowest in Gold category, it indicates that Soviet Union was
able to score only 43% of the total gold medals achieved by USA. Hence it can be said that US
performed best in Gold medal category.
Question 11.j
In order to determine even distribution, range can be calculated by subtracting lowest from
highest:
Hence 3 countries with smallest range and even distribution are Hungary at 22, Italy at 28 and
Sweden and Great Britain at 32 medals.
PART 3: USING IT
Question 12
The same charts is covered in attached spreadsheet with similar rows, columns, identifiers, text
formatting and column highlighting.
⊘ This is a preview!⊘
Do you want full access?
Subscribe today to unlock all pages.
Trusted by 1+ million students worldwide
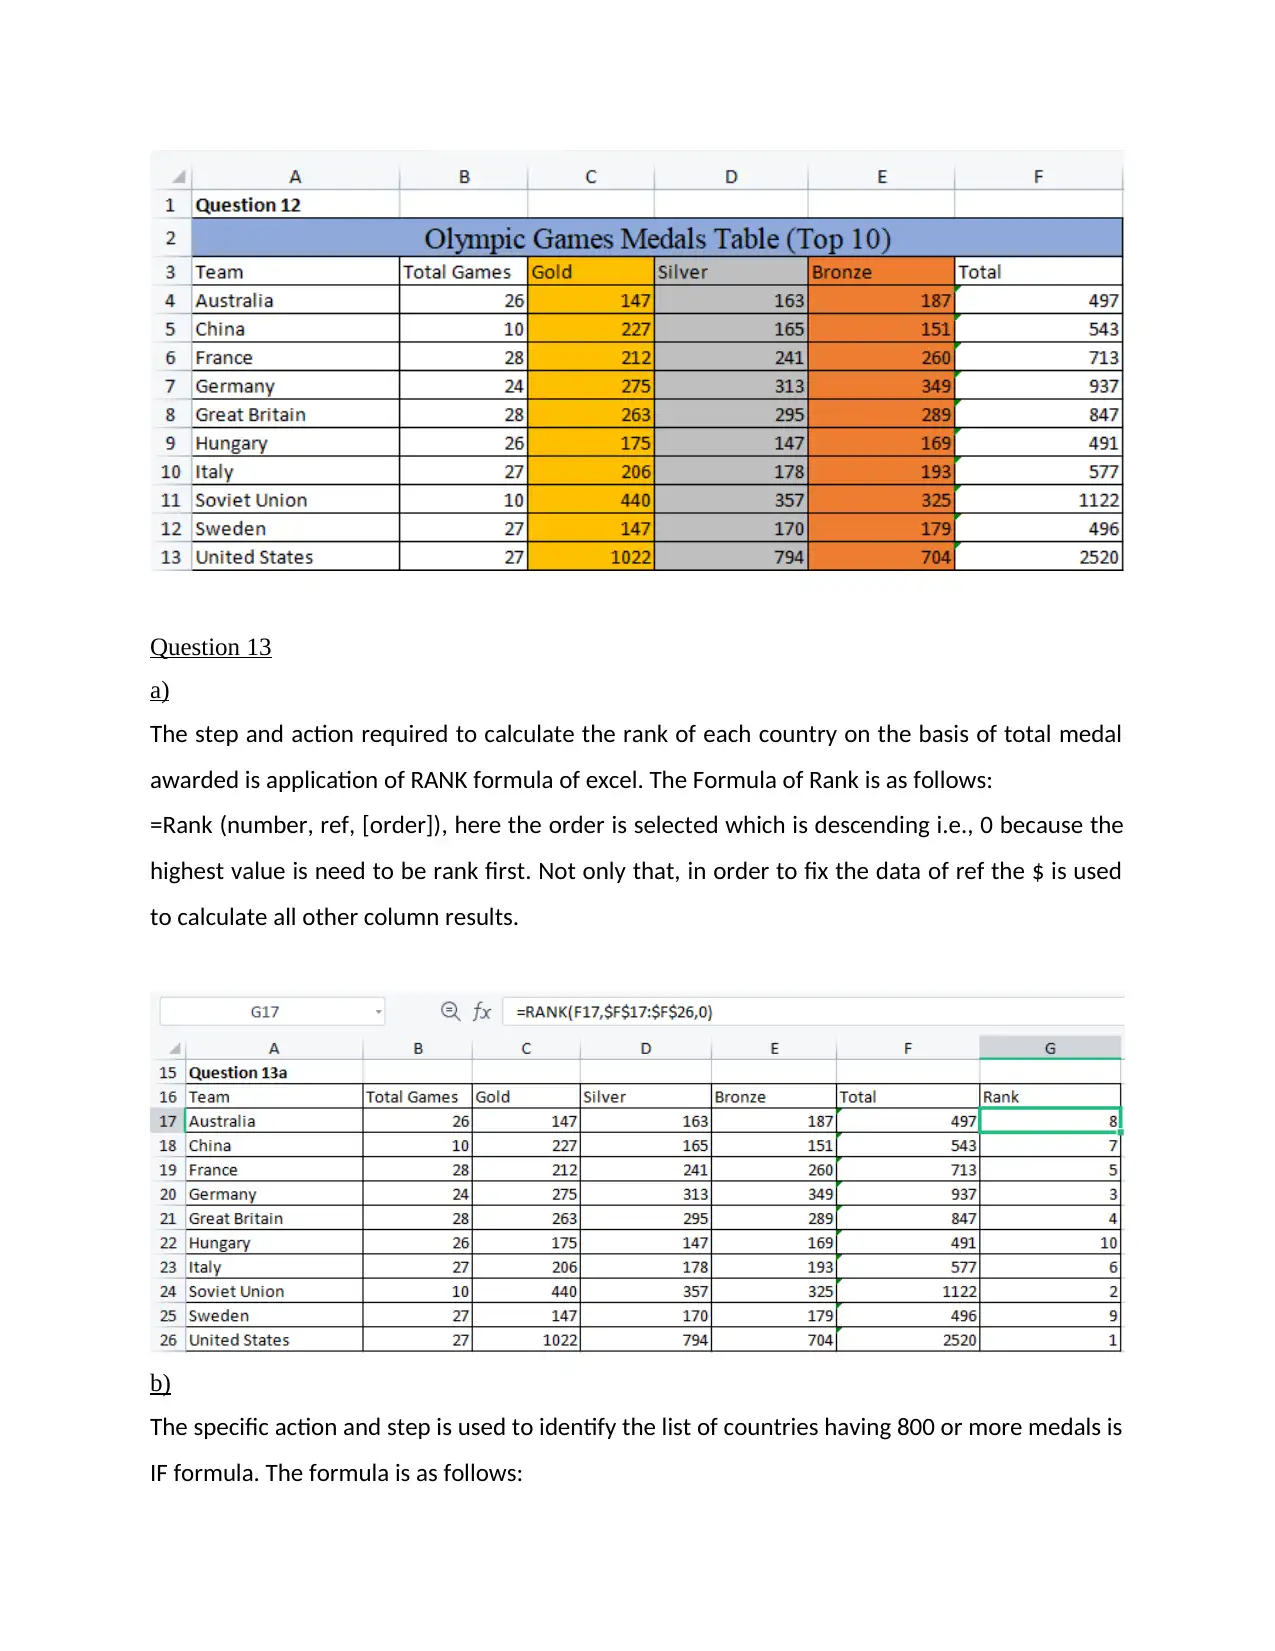
Question 13
a)
The step and action required to calculate the rank of each country on the basis of total medal
awarded is application of RANK formula of excel. The Formula of Rank is as follows:
=Rank (number, ref, [order]), here the order is selected which is descending i.e., 0 because the
highest value is need to be rank first. Not only that, in order to fix the data of ref the $ is used
to calculate all other column results.
b)
The specific action and step is used to identify the list of countries having 800 or more medals is
IF formula. The formula is as follows:
Paraphrase This Document
Need a fresh take? Get an instant paraphrase of this document with our AI Paraphraser
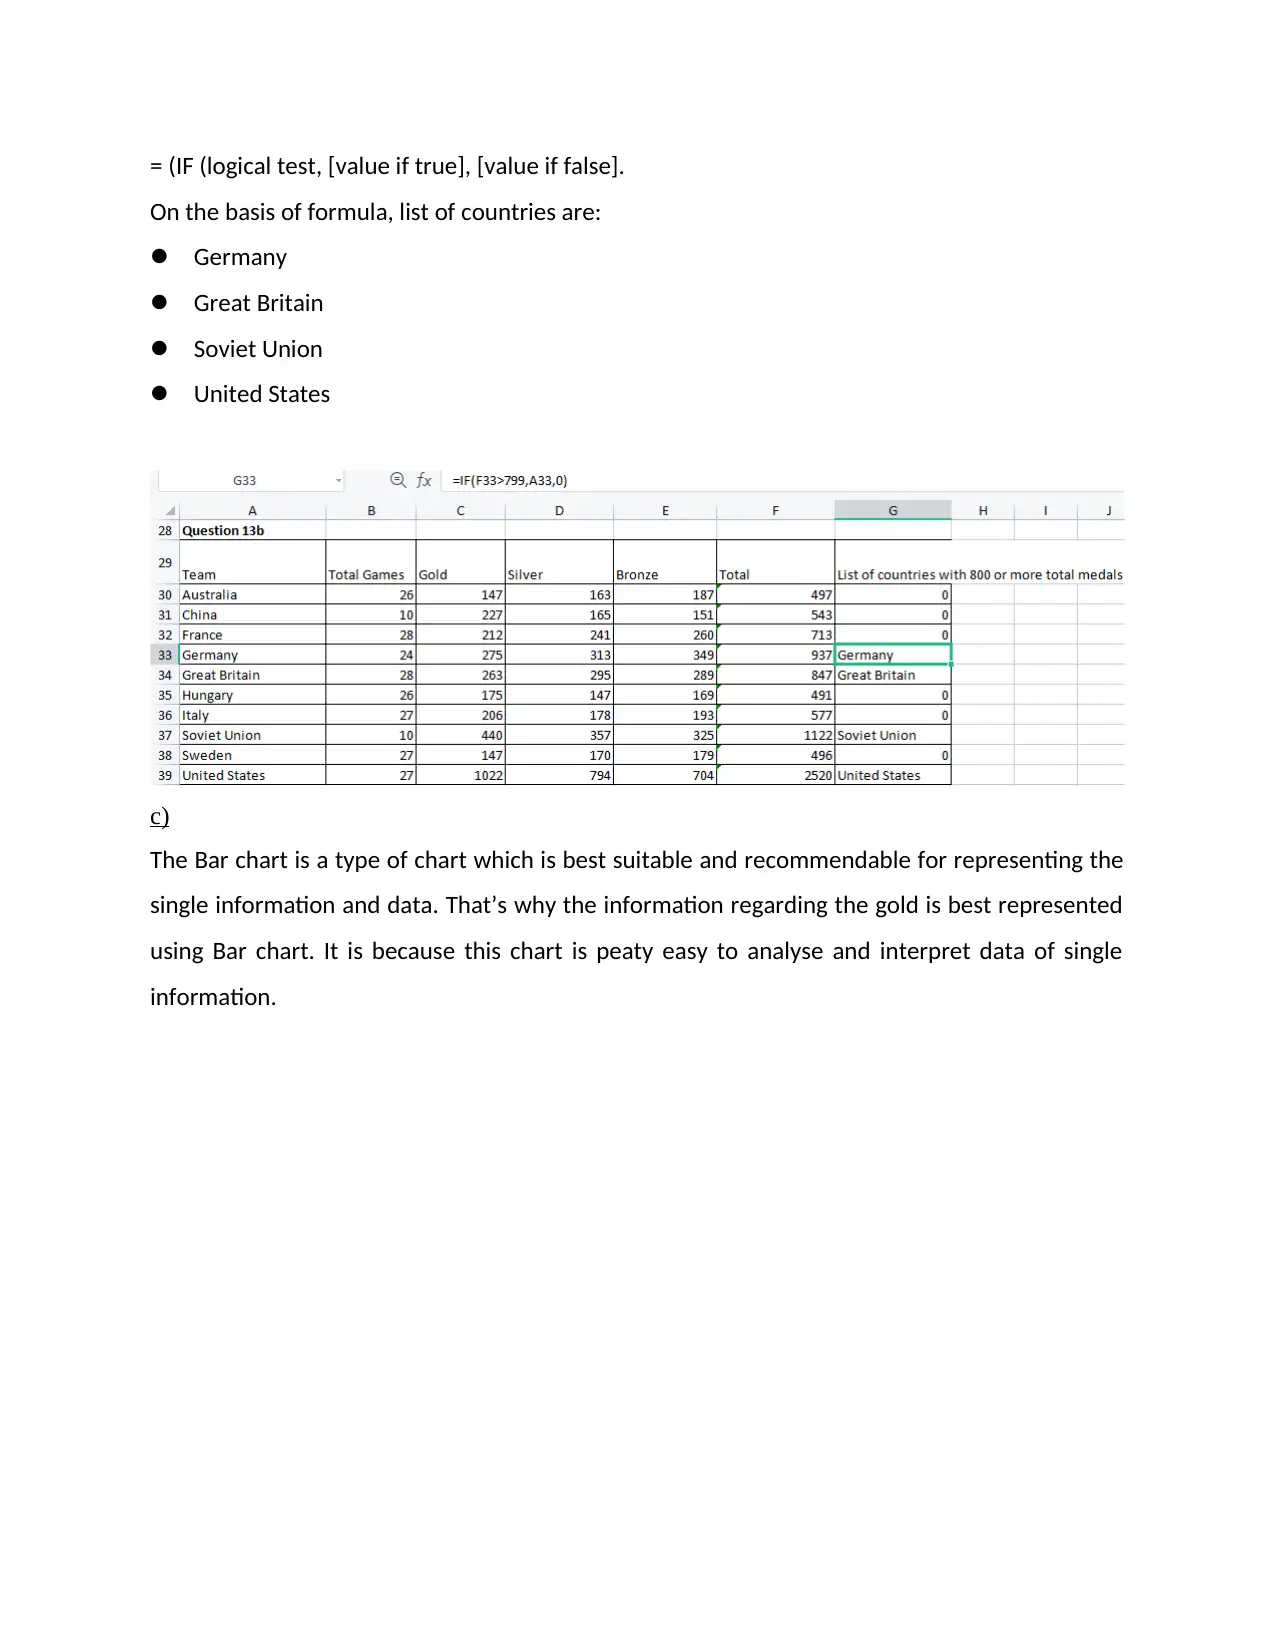
= (IF (logical test, [value if true], [value if false].
On the basis of formula, list of countries are:
Germany
Great Britain
Soviet Union
United States
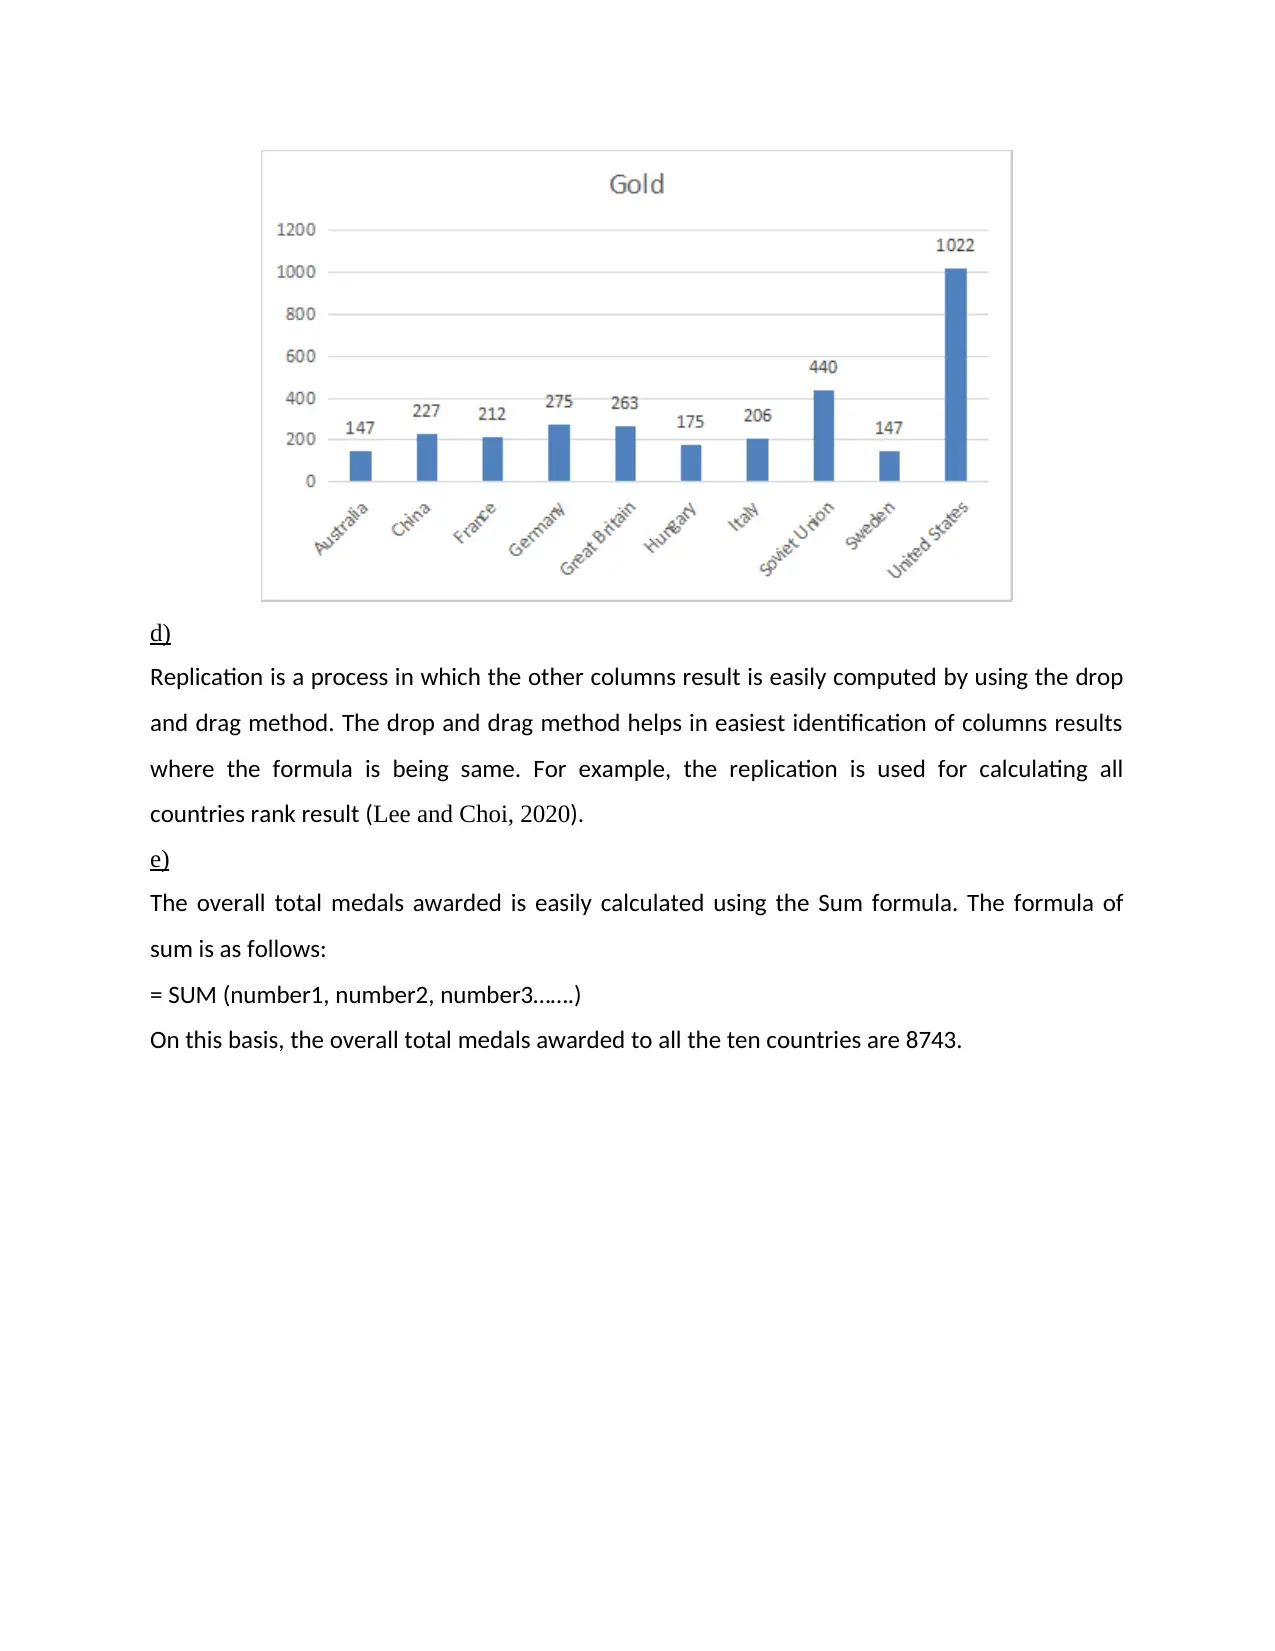
c)
The Bar chart is a type of chart which is best suitable and recommendable for representing the
single information and data. That’s why the information regarding the gold is best represented
using Bar chart. It is because this chart is peaty easy to analyse and interpret data of single
information.
On the basis of formula, list of countries are:
Germany
Great Britain
Soviet Union
United States
c)
The Bar chart is a type of chart which is best suitable and recommendable for representing the
single information and data. That’s why the information regarding the gold is best represented
using Bar chart. It is because this chart is peaty easy to analyse and interpret data of single
information.
d)
Replication is a process in which the other columns result is easily computed by using the drop
and drag method. The drop and drag method helps in easiest identification of columns results
where the formula is being same. For example, the replication is used for calculating all
countries rank result (Lee and Choi, 2020).
e)
The overall total medals awarded is easily calculated using the Sum formula. The formula of
sum is as follows:
= SUM (number1, number2, number3…….)
On this basis, the overall total medals awarded to all the ten countries are 8743.
⊘ This is a preview!⊘
Do you want full access?
Subscribe today to unlock all pages.
Trusted by 1+ million students worldwide
1 out of 22
Related Documents


Your All-in-One AI-Powered Toolkit for Academic Success.
+13062052269
info@desklib.com
Available 24*7 on WhatsApp / Email
![[object Object]](/_next/static/media/star-bottom.7253800d.svg)
Unlock your academic potential
Copyright © 2020–2026 A2Z Services. All Rights Reserved. Developed and managed by ZUCOL.