Numeracy, Data & IT: Analyzing Olympic Medal Data with Spreadsheets
VerifiedAdded on 2023/06/18
|17
|3464
|105
Practical Assignment
AI Summary
This assignment solution covers various aspects of numeracy, data, and IT, including basic mathematical concepts like numerators and denominators, fraction simplification, and percentage calculations. It involves practical application of these concepts to real-world scenarios, such as calculating the price of shoes, determining savings, and analyzing Olympic medal data. The solution also demonstrates the use of spreadsheets for data organization, ranking, and analysis. Furthermore, it delves into statistical concepts like mode, range, and percentage change, offering a comprehensive overview of how numeracy and IT skills can be applied to solve data-related problems. The document concludes with spreadsheet creation for the Olympic games medal table and ranking based on total medals.
Numeracy, Data & IT
Paraphrase This Document
Need a fresh take? Get an instant paraphrase of this document with our AI Paraphraser
TABLE OF CONTENTS
INTRODUCTION...........................................................................................................................3
PART 1............................................................................................................................................3
Q 1...............................................................................................................................................3
Discuss the two mathematical terms numerator and denominator..............................................3
Q 2...............................................................................................................................................4
Derive the two equations 24/40 and 18/42 into the most simplest forms...................................4
Q 3...............................................................................................................................................4
Derive the fraction formats 2/3, 3/4 and 5/6 as equal fractions with the 12 as the denominator4
b. from the data given in the table related to different types of books calculate the percentage
of the computing books in the library and check if books are making 2/3 of the remainder. ....4
Q 4...............................................................................................................................................5
Q 5...............................................................................................................................................5
Q 6...............................................................................................................................................6
Q 7...............................................................................................................................................6
Q 8...............................................................................................................................................7
Q 9...............................................................................................................................................7
Q 10.............................................................................................................................................7
PART 2............................................................................................................................................8
Q 11.............................................................................................................................................8
PART 3..........................................................................................................................................10
Q 12...........................................................................................................................................10
Q 13...........................................................................................................................................10
Q 14...........................................................................................................................................12
Q 15...........................................................................................................................................14
Q 16...........................................................................................................................................15
REFERENCES..............................................................................................................................17
INTRODUCTION
Numeracy refers to the ability to think in terms of numbers. It is the learner's knowledge and
skills that enable him or her to perform mathematical calculations. Students learn procedures that
allow them to perform a wide range of numeric calculations. Numeracy includes numbers,
statistics, probability, measurement, and geometry (Mutaf-Yıldız, B. and et. al., 2020) . Their
relationship is a function of algebra. In numeracy, logic and working are equally crucial. In real
terms, these calculations are carried out on a regular basis by a youngster, a homemaker, a
businessman, and so on. The concept of number is learned by a person from the moment he or
she begins to study things. There are several levels at which this concept is created among
individuals.
Data are the raw materials with which calculations are made. The actual calculation is done
and the result is obtained utilising these data. The data is an input that is used to generate output.
It can take the shape of data, numbers, pictures, graphs, and so on. Quantitative and qualitative
data are the two categories of data. Quantitative data is used in the majority of mathematical
calculations. The term “information technology” refers to the field of computer science. It is a
rising notion because it works on a digital platform. The computation performed as a result of
this is precise, and the individual can trust it. In reality, many companies are increasingly using
information technology into their daily operations.
PART 1
Q 1
Discuss the two mathematical terms numerator and denominator
a) Numerator: it is being outlined as the digit which comes preceding of the line that is above
value under the fraction. Numerator is derived from the Latin word "enumerate," which means
⊘ This is a preview!⊘
Do you want full access?
Subscribe today to unlock all pages.
Trusted by 1+ million students worldwide
"to count." The numerator is a type of fraction that is used to count the number of equal-sized
parts of a given value expressed as a fraction (Nahdi, D.S and et. al., 2020) .
b) The term "denominator" comes from the Latin word "nomnen," which means "name." The
denominator is a fractional portion that represents the total part of the fraction.this is the value
which comes below the line that is the number written in fraction below the line.
The highest part of a fraction is called the numerator, while the bottom component is called the
denominator (Mutaf Yildiz, B and et. al., 2018).
Q 2
Derive the two equations 24/40 and 18/42 into the most simplest forms
Simplest form of
24/40 is 3/5
18/42 is 3/7
Q 3
Derive the fraction formats 2/3, 3/4 and 5/6 as equal fractions with the 12 as the denominator
a.
2/3 * 4/4 = 8/12
3/4 * 3/3 = 9/12
5/6 * 2/2 = 10/12
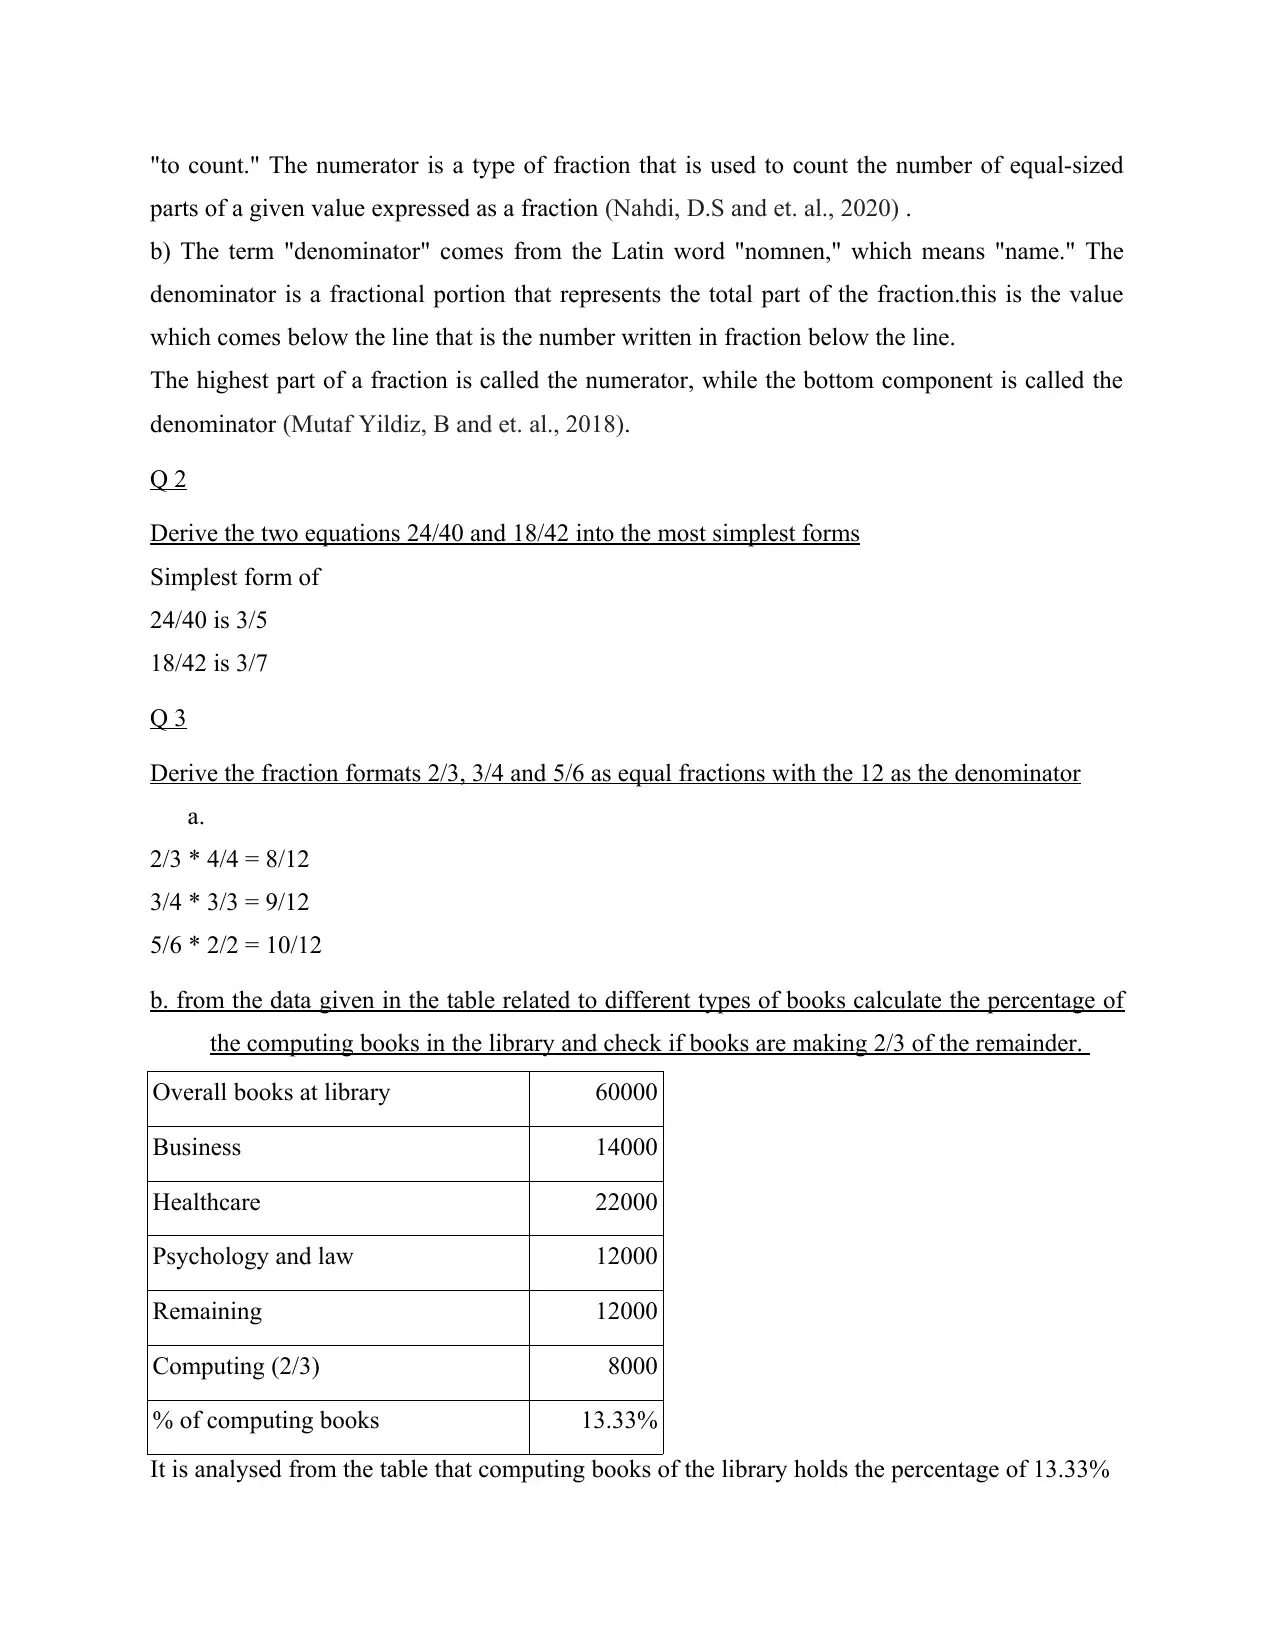
b. from the data given in the table related to different types of books calculate the percentage of
the computing books in the library and check if books are making 2/3 of the remainder.
Overall books at library 60000
Business 14000
Healthcare 22000
Psychology and law 12000
Remaining 12000
Computing (2/3) 8000
% of computing books 13.33%
It is analysed from the table that computing books of the library holds the percentage of 13.33%
parts of a given value expressed as a fraction (Nahdi, D.S and et. al., 2020) .
b) The term "denominator" comes from the Latin word "nomnen," which means "name." The
denominator is a fractional portion that represents the total part of the fraction.this is the value
which comes below the line that is the number written in fraction below the line.
The highest part of a fraction is called the numerator, while the bottom component is called the
denominator (Mutaf Yildiz, B and et. al., 2018).
Q 2
Derive the two equations 24/40 and 18/42 into the most simplest forms
Simplest form of
24/40 is 3/5
18/42 is 3/7
Q 3
Derive the fraction formats 2/3, 3/4 and 5/6 as equal fractions with the 12 as the denominator
a.
2/3 * 4/4 = 8/12
3/4 * 3/3 = 9/12
5/6 * 2/2 = 10/12
b. from the data given in the table related to different types of books calculate the percentage of
the computing books in the library and check if books are making 2/3 of the remainder.
Overall books at library 60000
Business 14000
Healthcare 22000
Psychology and law 12000
Remaining 12000
Computing (2/3) 8000
% of computing books 13.33%
It is analysed from the table that computing books of the library holds the percentage of 13.33%
Paraphrase This Document
Need a fresh take? Get an instant paraphrase of this document with our AI Paraphraser
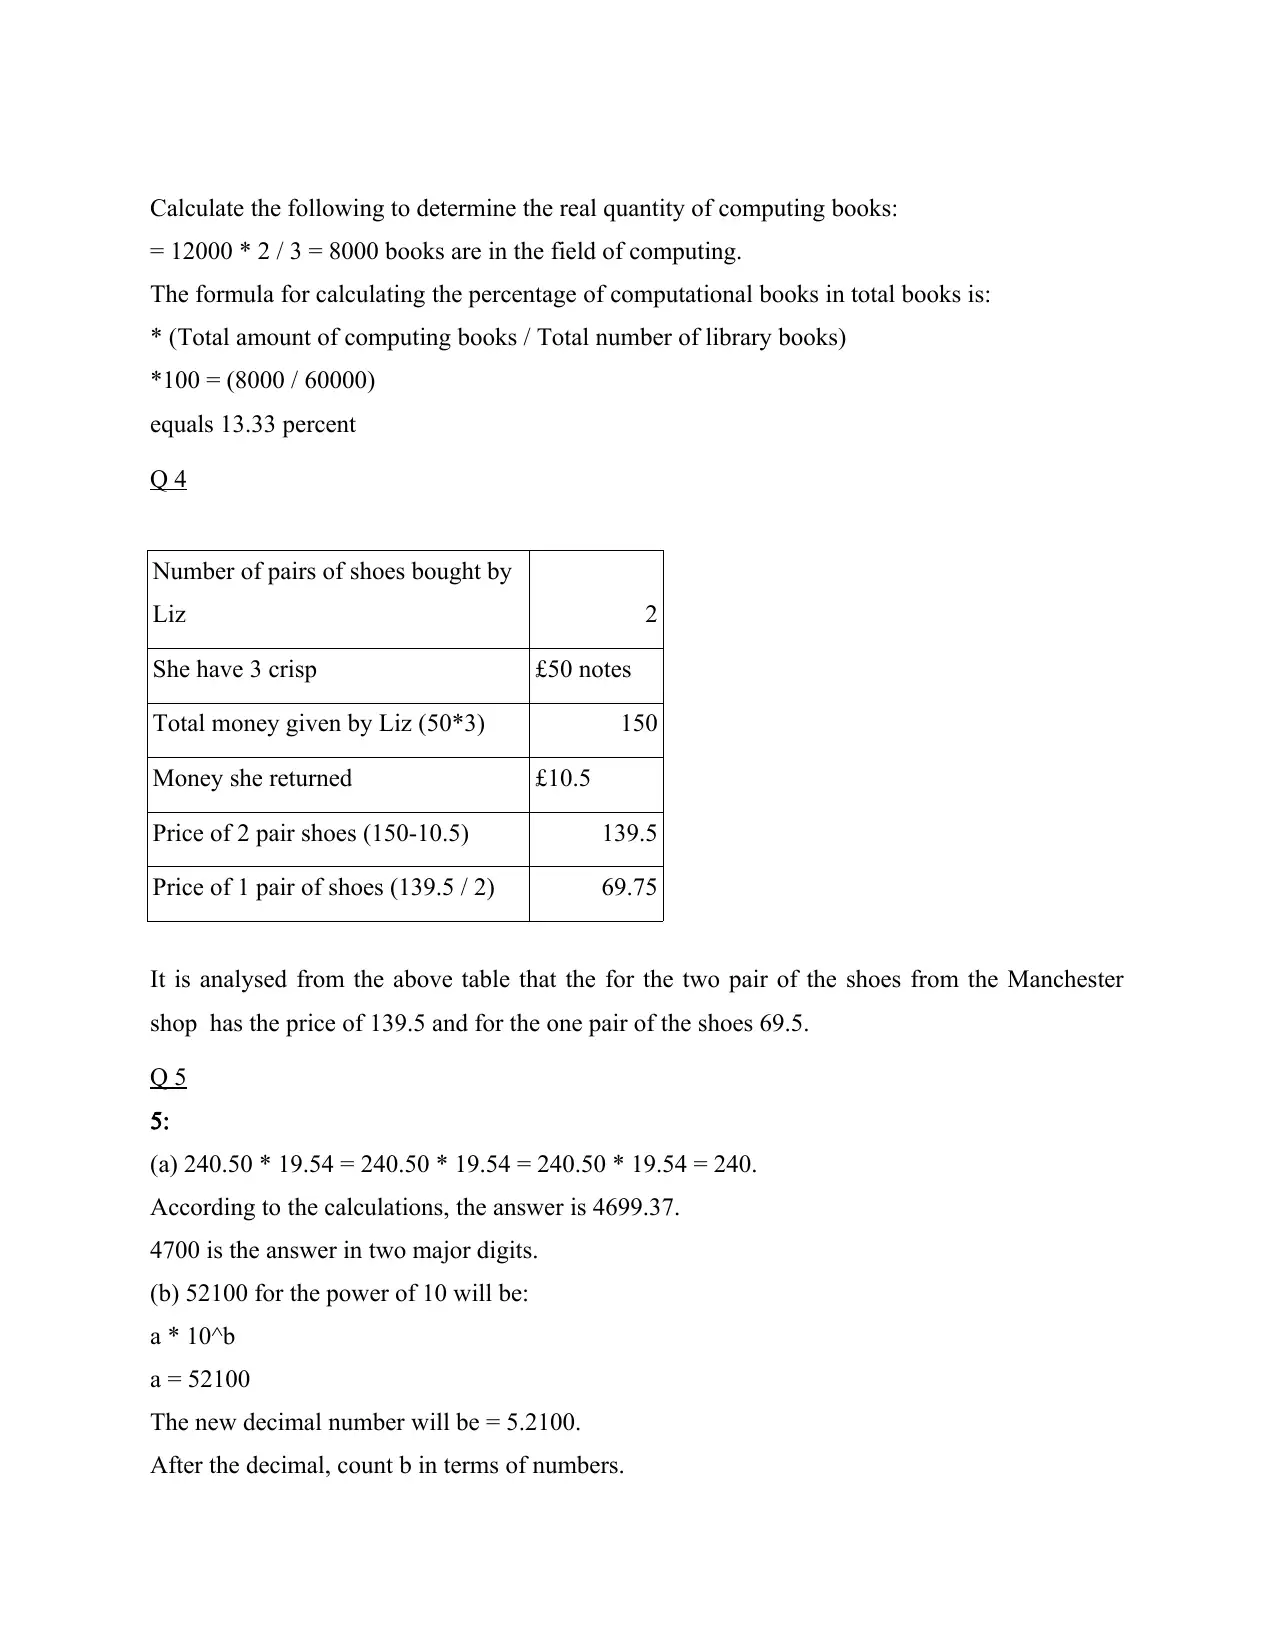
Calculate the following to determine the real quantity of computing books:
= 12000 * 2 / 3 = 8000 books are in the field of computing.
The formula for calculating the percentage of computational books in total books is:
* (Total amount of computing books / Total number of library books)
*100 = (8000 / 60000)
equals 13.33 percent
Q 4
Number of pairs of shoes bought by
Liz 2
She have 3 crisp £50 notes
Total money given by Liz (50*3) 150
Money she returned £10.5
Price of 2 pair shoes (150-10.5) 139.5
Price of 1 pair of shoes (139.5 / 2) 69.75
It is analysed from the above table that the for the two pair of the shoes from the Manchester
shop has the price of 139.5 and for the one pair of the shoes 69.5.
Q 5
5:
(a) 240.50 * 19.54 = 240.50 * 19.54 = 240.50 * 19.54 = 240.
According to the calculations, the answer is 4699.37.
4700 is the answer in two major digits.
(b) 52100 for the power of 10 will be:
a * 10^b
a = 52100
The new decimal number will be = 5.2100.
After the decimal, count b in terms of numbers.
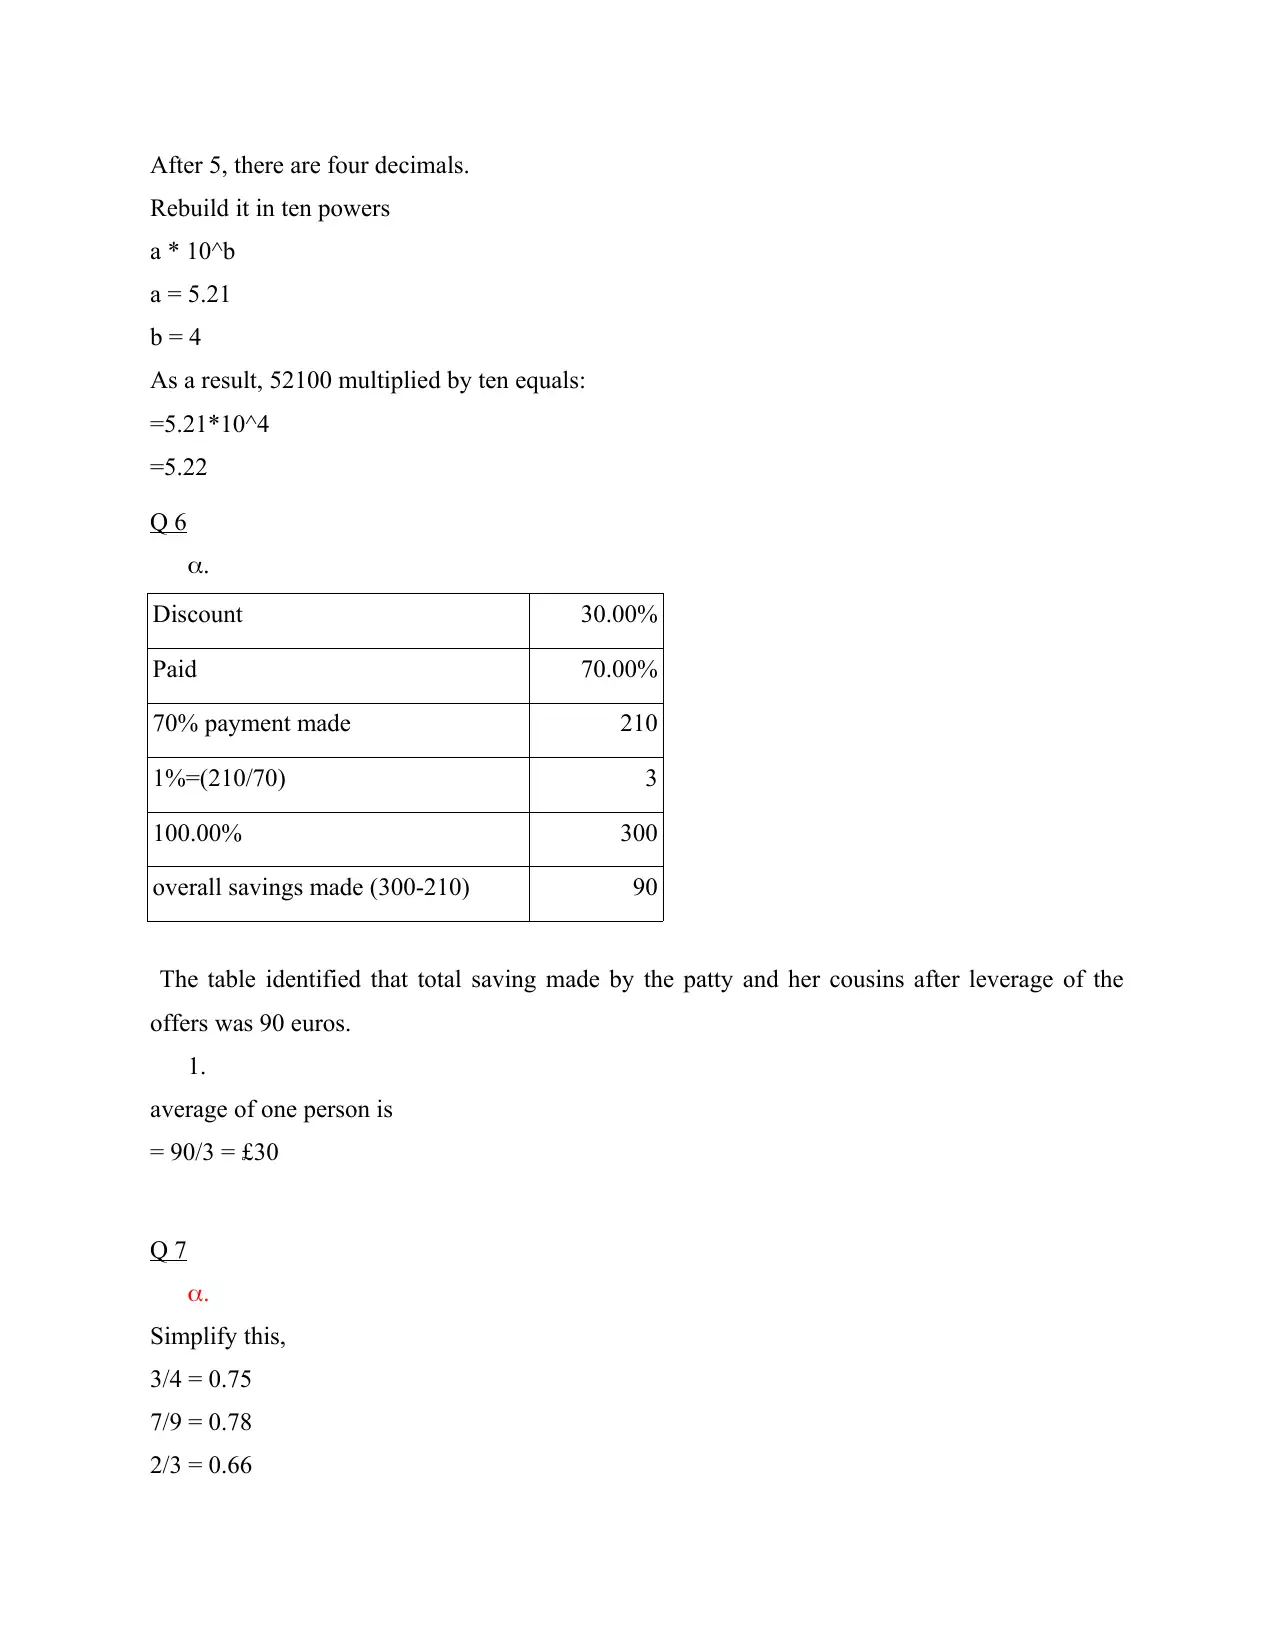
After 5, there are four decimals.
Rebuild it in ten powers
a * 10^b
a = 5.21
b = 4
As a result, 52100 multiplied by ten equals:
=5.21*10^4
=5.22
Q 6
a.
Discount 30.00%
Paid 70.00%
70% payment made 210
1%=(210/70) 3
100.00% 300
overall savings made (300-210) 90
The table identified that total saving made by the patty and her cousins after leverage of the
offers was 90 euros.
1.
average of one person is
= 90/3 = £30
Q 7
a.
Simplify this,
3/4 = 0.75
7/9 = 0.78
2/3 = 0.66
⊘ This is a preview!⊘
Do you want full access?
Subscribe today to unlock all pages.
Trusted by 1+ million students worldwide
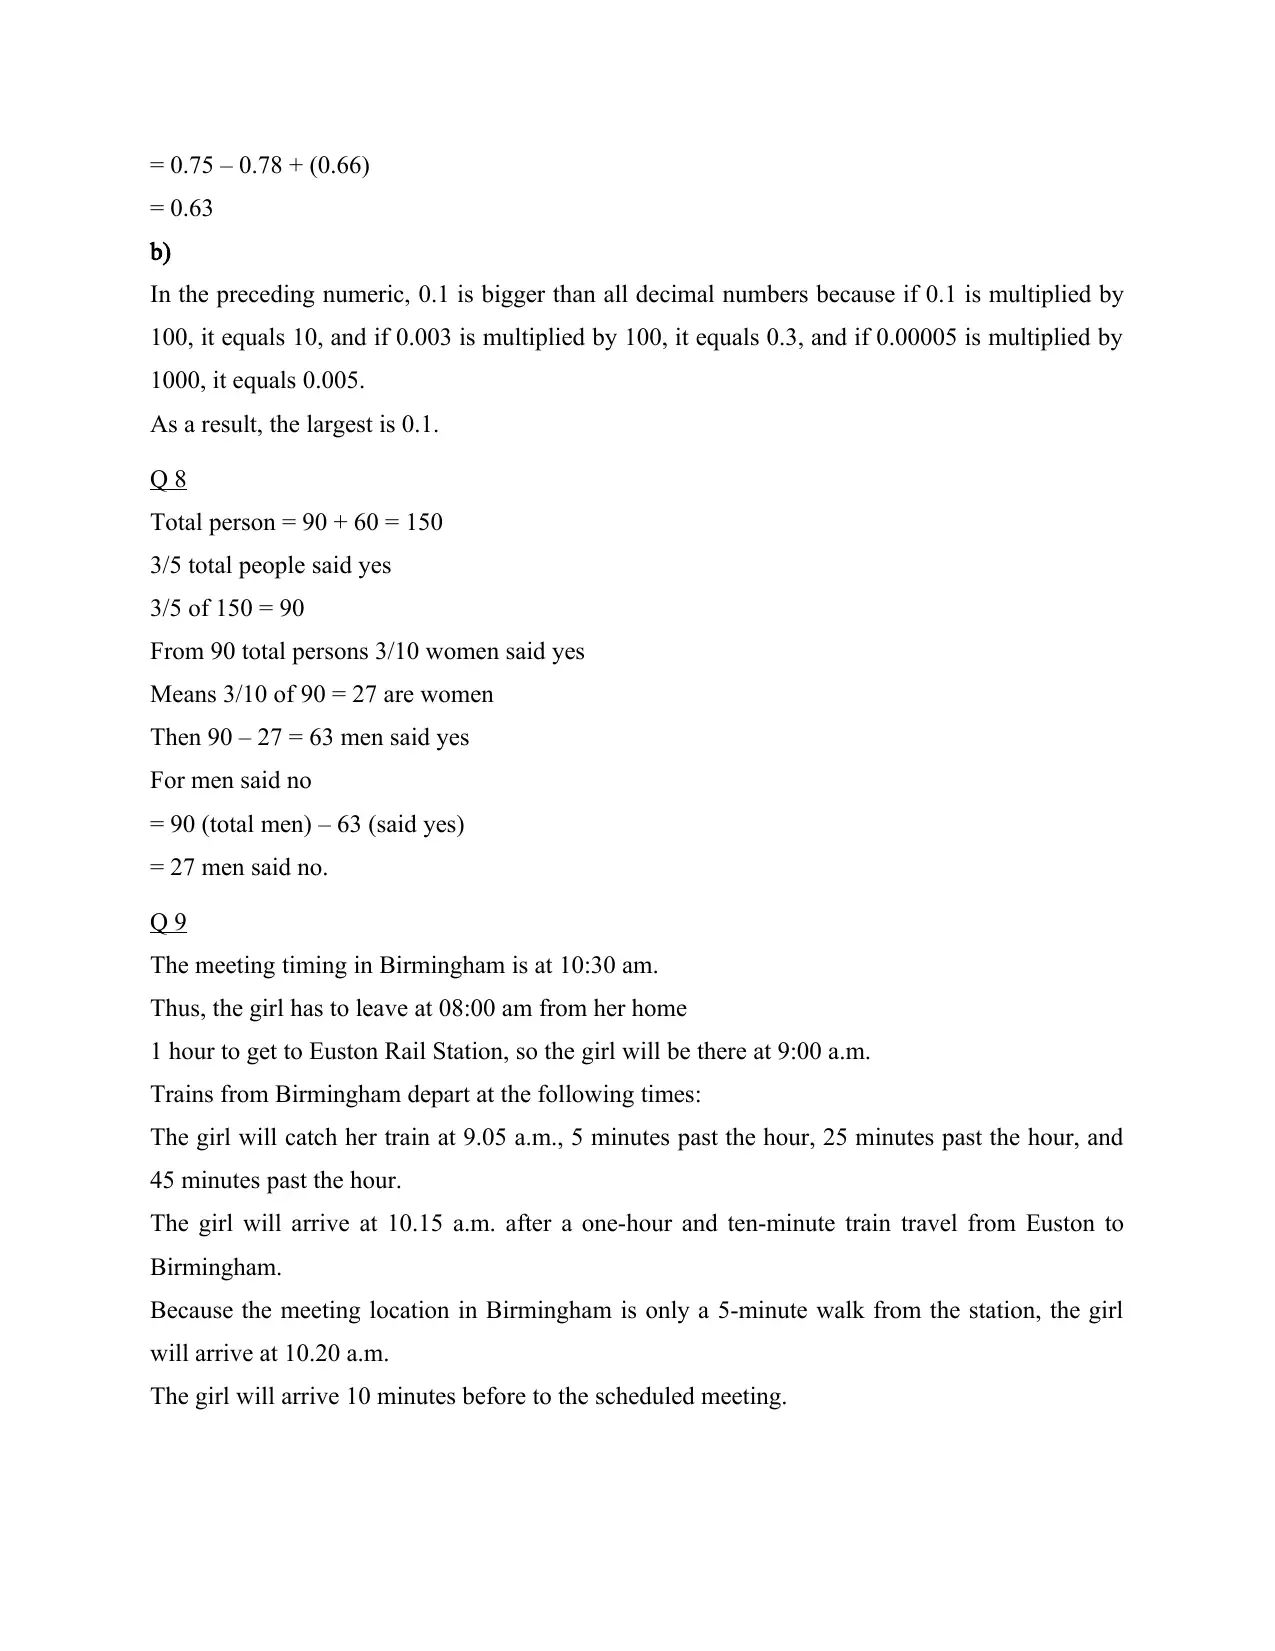
= 0.75 – 0.78 + (0.66)
= 0.63
b)
In the preceding numeric, 0.1 is bigger than all decimal numbers because if 0.1 is multiplied by
100, it equals 10, and if 0.003 is multiplied by 100, it equals 0.3, and if 0.00005 is multiplied by
1000, it equals 0.005.
As a result, the largest is 0.1.
Q 8
Total person = 90 + 60 = 150
3/5 total people said yes
3/5 of 150 = 90
From 90 total persons 3/10 women said yes
Means 3/10 of 90 = 27 are women
Then 90 – 27 = 63 men said yes
For men said no
= 90 (total men) – 63 (said yes)
= 27 men said no.
Q 9
The meeting timing in Birmingham is at 10:30 am.
Thus, the girl has to leave at 08:00 am from her home
1 hour to get to Euston Rail Station, so the girl will be there at 9:00 a.m.
Trains from Birmingham depart at the following times:
The girl will catch her train at 9.05 a.m., 5 minutes past the hour, 25 minutes past the hour, and
45 minutes past the hour.
The girl will arrive at 10.15 a.m. after a one-hour and ten-minute train travel from Euston to
Birmingham.
Because the meeting location in Birmingham is only a 5-minute walk from the station, the girl
will arrive at 10.20 a.m.
The girl will arrive 10 minutes before to the scheduled meeting.
Paraphrase This Document
Need a fresh take? Get an instant paraphrase of this document with our AI Paraphraser
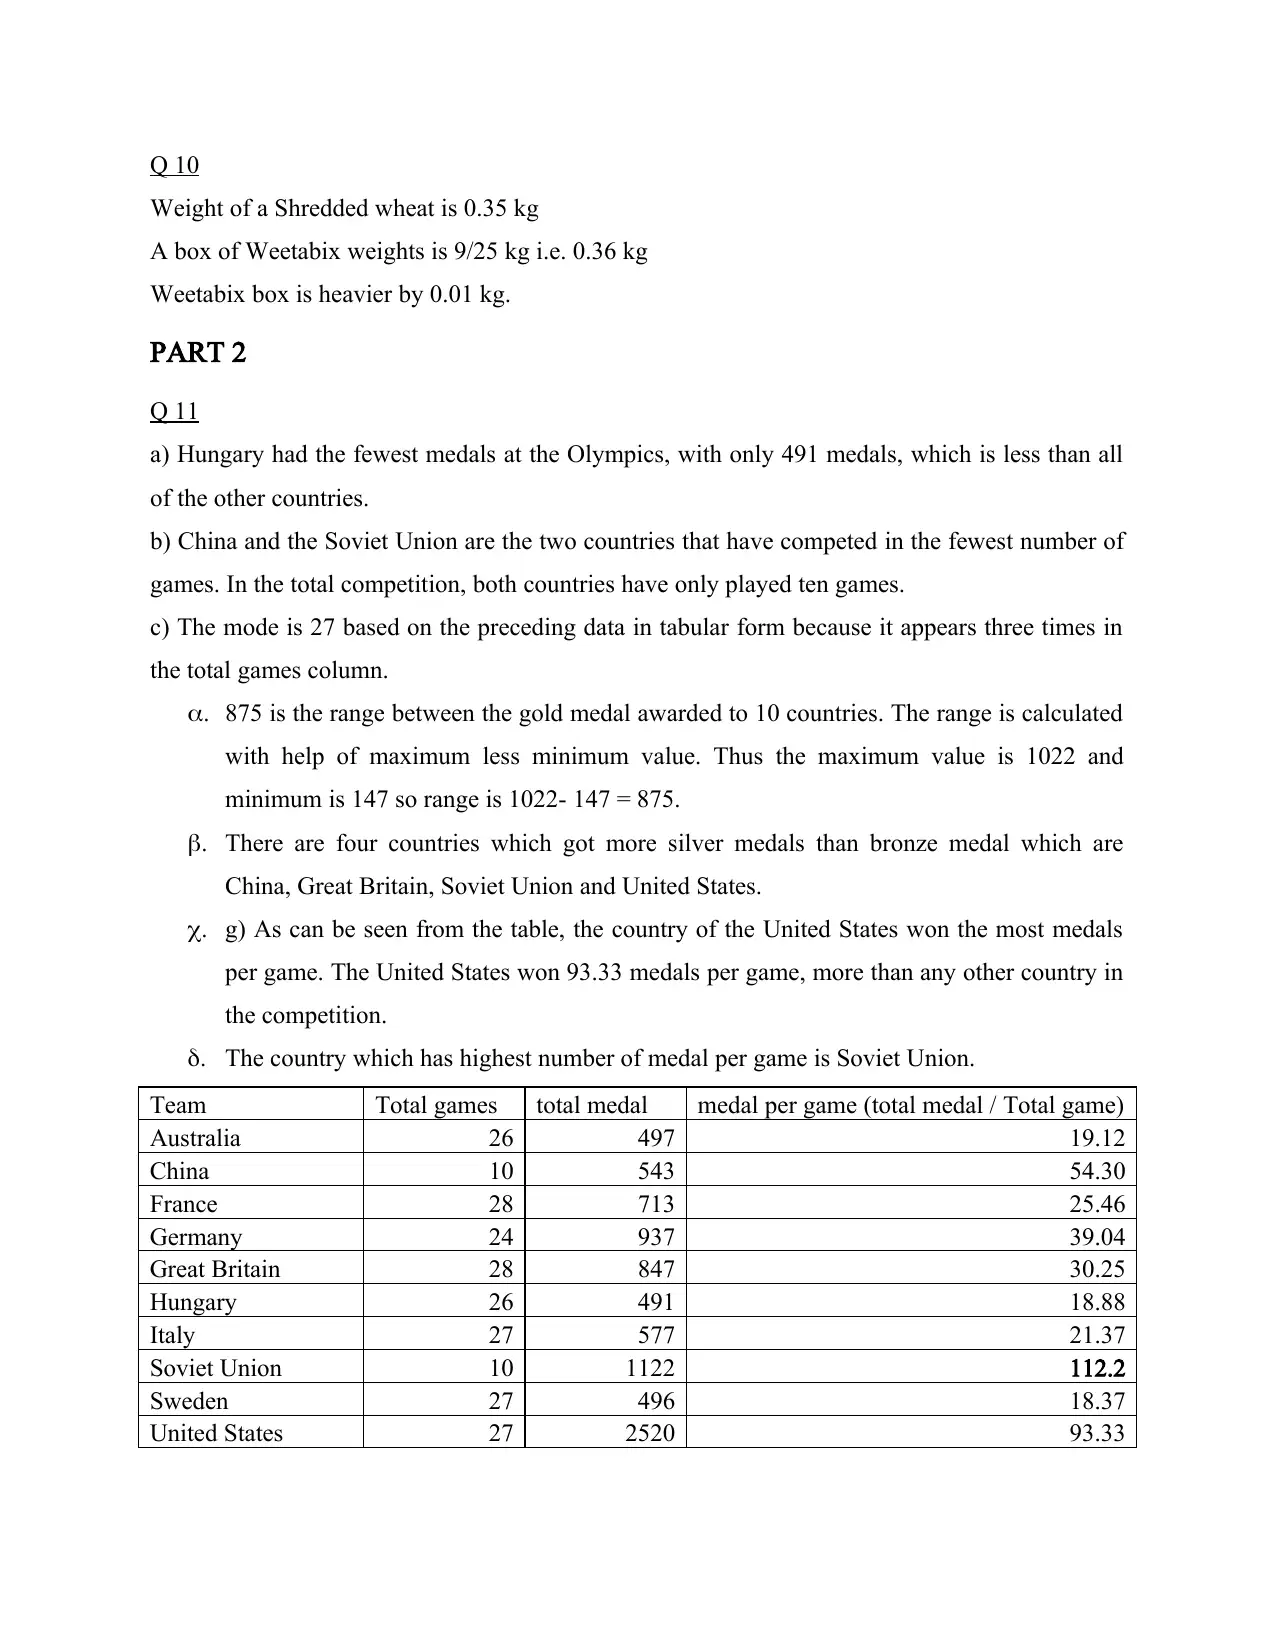
Q 10
Weight of a Shredded wheat is 0.35 kg
A box of Weetabix weights is 9/25 kg i.e. 0.36 kg
Weetabix box is heavier by 0.01 kg.
PART 2
Q 11
a) Hungary had the fewest medals at the Olympics, with only 491 medals, which is less than all
of the other countries.
b) China and the Soviet Union are the two countries that have competed in the fewest number of
games. In the total competition, both countries have only played ten games.
c) The mode is 27 based on the preceding data in tabular form because it appears three times in
the total games column.
a. 875 is the range between the gold medal awarded to 10 countries. The range is calculated
with help of maximum less minimum value. Thus the maximum value is 1022 and
minimum is 147 so range is 1022- 147 = 875.
b. There are four countries which got more silver medals than bronze medal which are
China, Great Britain, Soviet Union and United States.
c. g) As can be seen from the table, the country of the United States won the most medals
per game. The United States won 93.33 medals per game, more than any other country in
the competition.
d. The country which has highest number of medal per game is Soviet Union.
Team Total games total medal medal per game (total medal / Total game)
Australia 26 497 19.12
China 10 543 54.30
France 28 713 25.46
Germany 24 937 39.04
Great Britain 28 847 30.25
Hungary 26 491 18.88
Italy 27 577 21.37
Soviet Union 10 1122 112.2
Sweden 27 496 18.37
United States 27 2520 93.33
The table represents the total count of the games in which each nation has participated and the
total number of medals received per game. As per the table the Soviet Union has the highest
count of the medals on each game.
Hungary, Italy, and Sweden are the three countries that dispersed their medals equally in terms
of range.
Sweden and Australia both have 147 gold medals, but Sweden's range is 32, compared to
Australia’s 40.
The number of silver medals won by Hungry and Australia is lower. Hungary has 147 and
Australia has 163, although Hungary has the smallest range of 28.
China and Hungary are the countries with the fewest bronze medals. They each had 151 bronze
medals, with China having 76 and Hungary having 28.
e. The two likely reason behind Jamaica not featuring in top 10 medal are as follows-
The first reason behind Jamaica not coming in top 10 is that the country is very small in
comparison to the other counties listed in the list (Sawe, Chafe and Treviño, 2020).
Moreover, another reason for Jamaica not to be featured in top 10 is the population is less
in comparison to the other countries. Hence, due to this, it is not included in top 10.
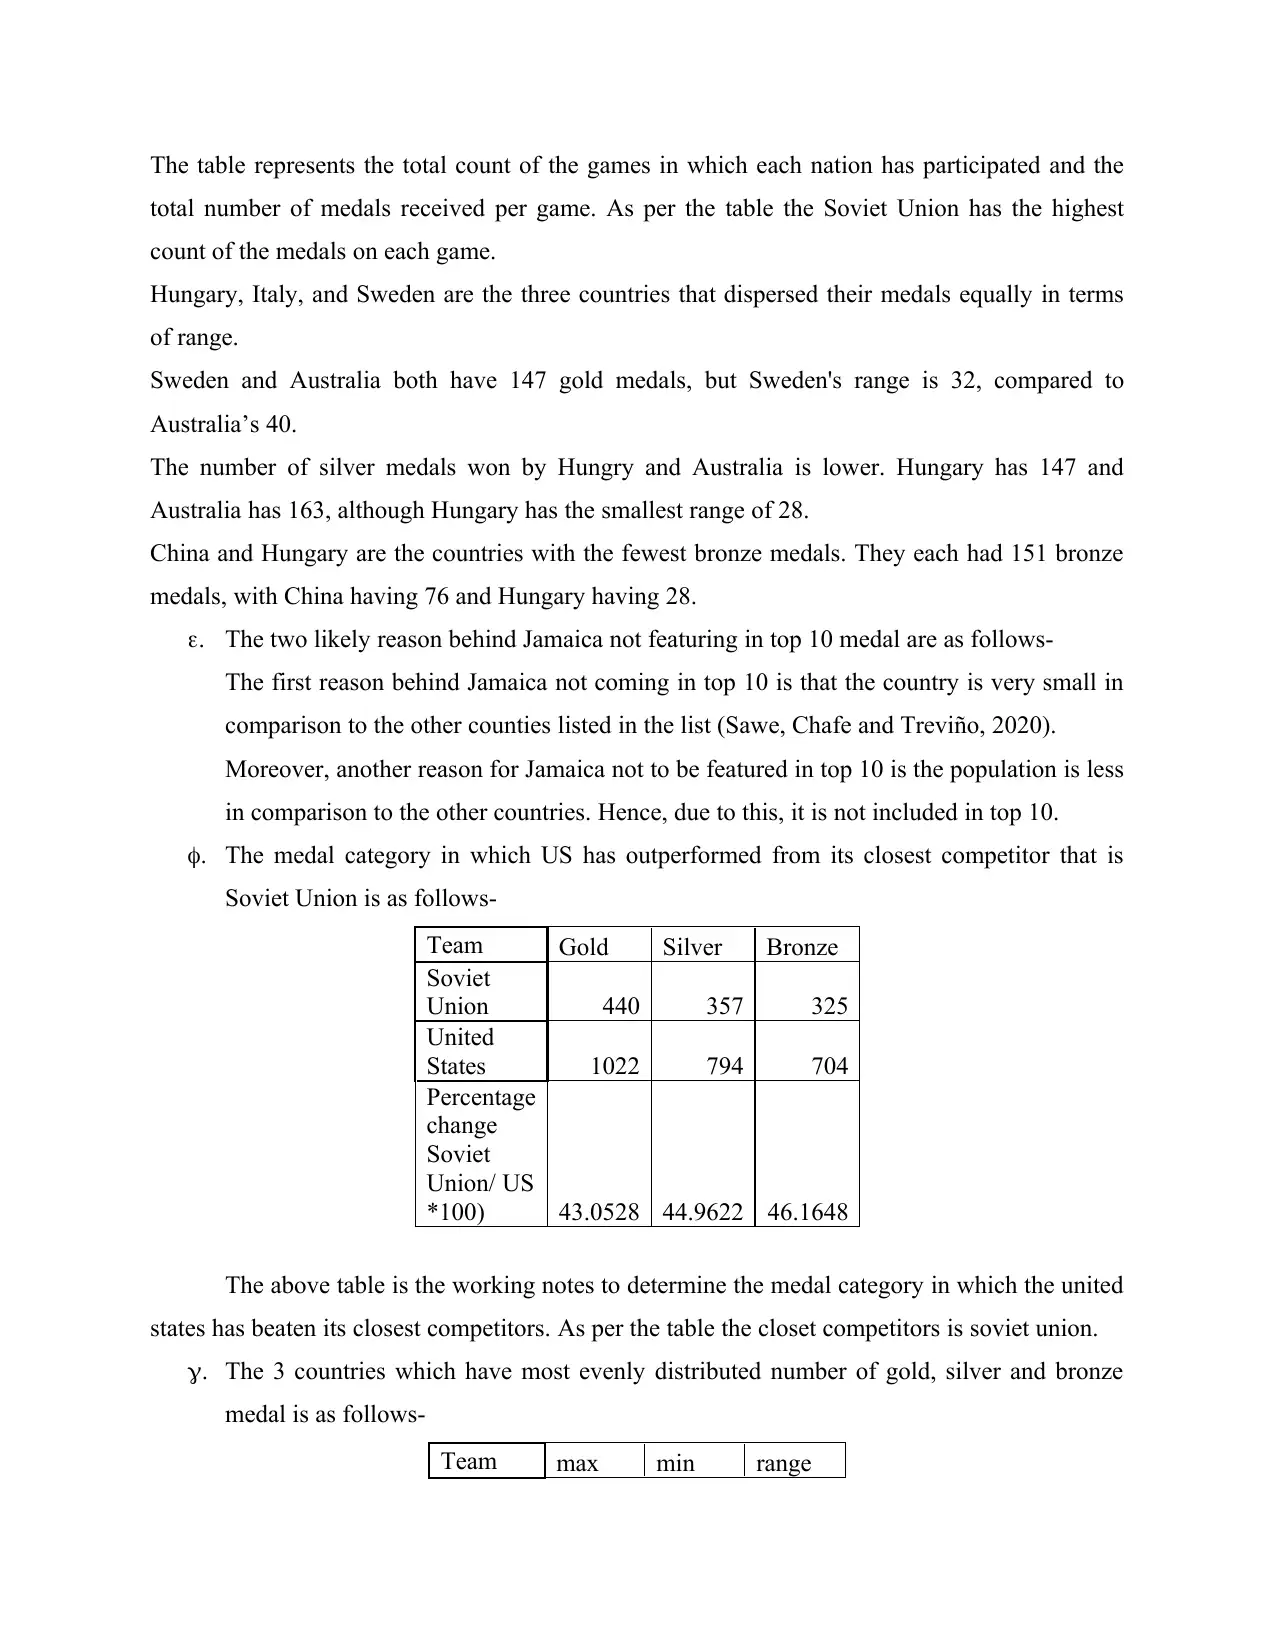
f. The medal category in which US has outperformed from its closest competitor that is
Soviet Union is as follows-
Team Gold Silver Bronze
Soviet
Union 440 357 325
United
States 1022 794 704
Percentage
change
Soviet
Union/ US
*100) 43.0528 44.9622 46.1648
The above table is the working notes to determine the medal category in which the united
states has beaten its closest competitors. As per the table the closet competitors is soviet union.
g. The 3 countries which have most evenly distributed number of gold, silver and bronze
medal is as follows-
Team max min range
total number of medals received per game. As per the table the Soviet Union has the highest
count of the medals on each game.
Hungary, Italy, and Sweden are the three countries that dispersed their medals equally in terms
of range.
Sweden and Australia both have 147 gold medals, but Sweden's range is 32, compared to
Australia’s 40.
The number of silver medals won by Hungry and Australia is lower. Hungary has 147 and
Australia has 163, although Hungary has the smallest range of 28.
China and Hungary are the countries with the fewest bronze medals. They each had 151 bronze
medals, with China having 76 and Hungary having 28.
e. The two likely reason behind Jamaica not featuring in top 10 medal are as follows-
The first reason behind Jamaica not coming in top 10 is that the country is very small in
comparison to the other counties listed in the list (Sawe, Chafe and Treviño, 2020).
Moreover, another reason for Jamaica not to be featured in top 10 is the population is less
in comparison to the other countries. Hence, due to this, it is not included in top 10.
f. The medal category in which US has outperformed from its closest competitor that is
Soviet Union is as follows-
Team Gold Silver Bronze
Soviet
Union 440 357 325
United
States 1022 794 704
Percentage
change
Soviet
Union/ US
*100) 43.0528 44.9622 46.1648
The above table is the working notes to determine the medal category in which the united
states has beaten its closest competitors. As per the table the closet competitors is soviet union.
g. The 3 countries which have most evenly distributed number of gold, silver and bronze
medal is as follows-
Team max min range
⊘ This is a preview!⊘
Do you want full access?
Subscribe today to unlock all pages.
Trusted by 1+ million students worldwide
Australia 187 147 40
China 227 151 76
France 260 212 48
Germany 349 275 74
Great
Britain 295 263 32
Hungary 175 147 28
Italy 206 178 28
Soviet
Union 440 325 115
Sweden 179 147 32
United
States 1022 704 318
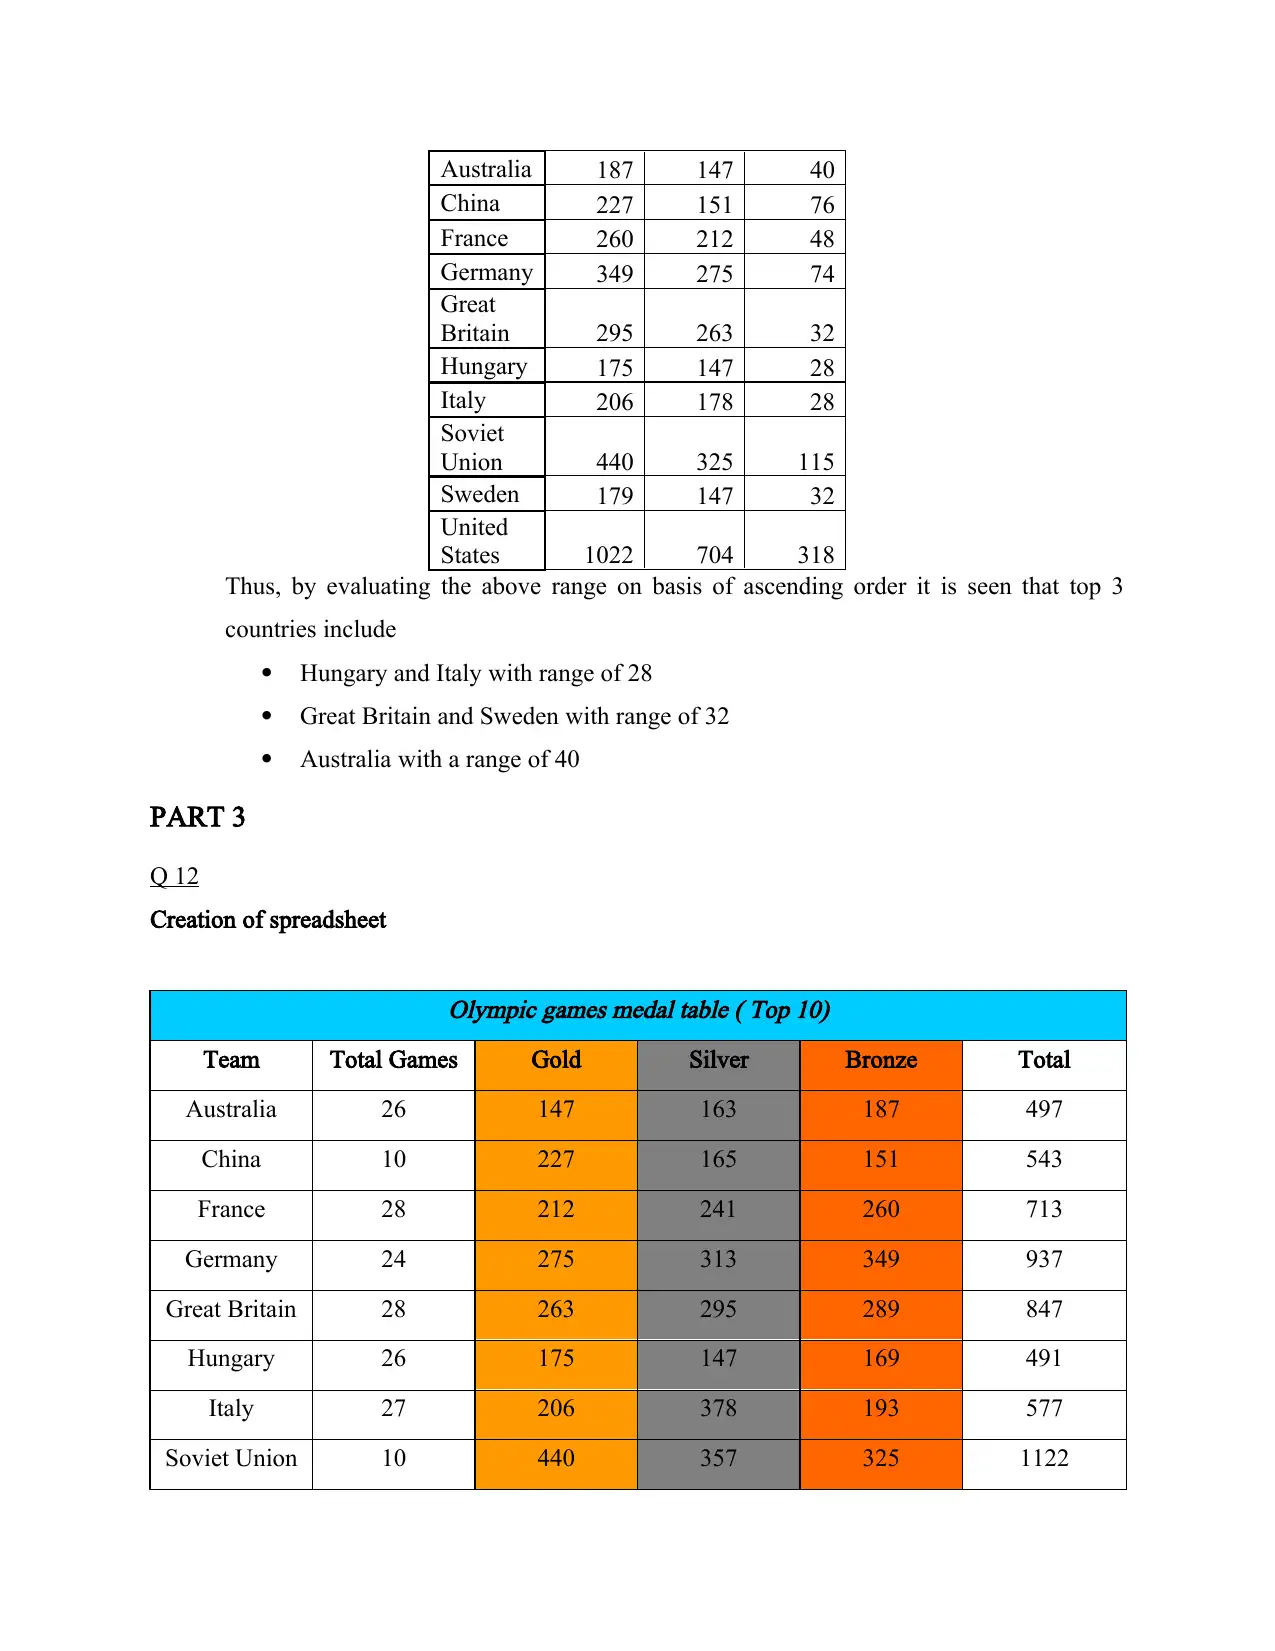
Thus, by evaluating the above range on basis of ascending order it is seen that top 3
countries include
Hungary and Italy with range of 28
Great Britain and Sweden with range of 32
Australia with a range of 40
PART 3
Q 12
Creation of spreadsheet
Olympic games medal table ( Top 10)
Team Total Games Gold Silver Bronze Total
Australia 26 147 163 187 497
China 10 227 165 151 543
France 28 212 241 260 713
Germany 24 275 313 349 937
Great Britain 28 263 295 289 847
Hungary 26 175 147 169 491
Italy 27 206 378 193 577
Soviet Union 10 440 357 325 1122
China 227 151 76
France 260 212 48
Germany 349 275 74
Great
Britain 295 263 32
Hungary 175 147 28
Italy 206 178 28
Soviet
Union 440 325 115
Sweden 179 147 32
United
States 1022 704 318
Thus, by evaluating the above range on basis of ascending order it is seen that top 3
countries include
Hungary and Italy with range of 28
Great Britain and Sweden with range of 32
Australia with a range of 40
PART 3
Q 12
Creation of spreadsheet
Olympic games medal table ( Top 10)
Team Total Games Gold Silver Bronze Total
Australia 26 147 163 187 497
China 10 227 165 151 543
France 28 212 241 260 713
Germany 24 275 313 349 937
Great Britain 28 263 295 289 847
Hungary 26 175 147 169 491
Italy 27 206 378 193 577
Soviet Union 10 440 357 325 1122
Paraphrase This Document
Need a fresh take? Get an instant paraphrase of this document with our AI Paraphraser
Sweden 27 147 170 179 496
United States 27 1022 794 704 2520
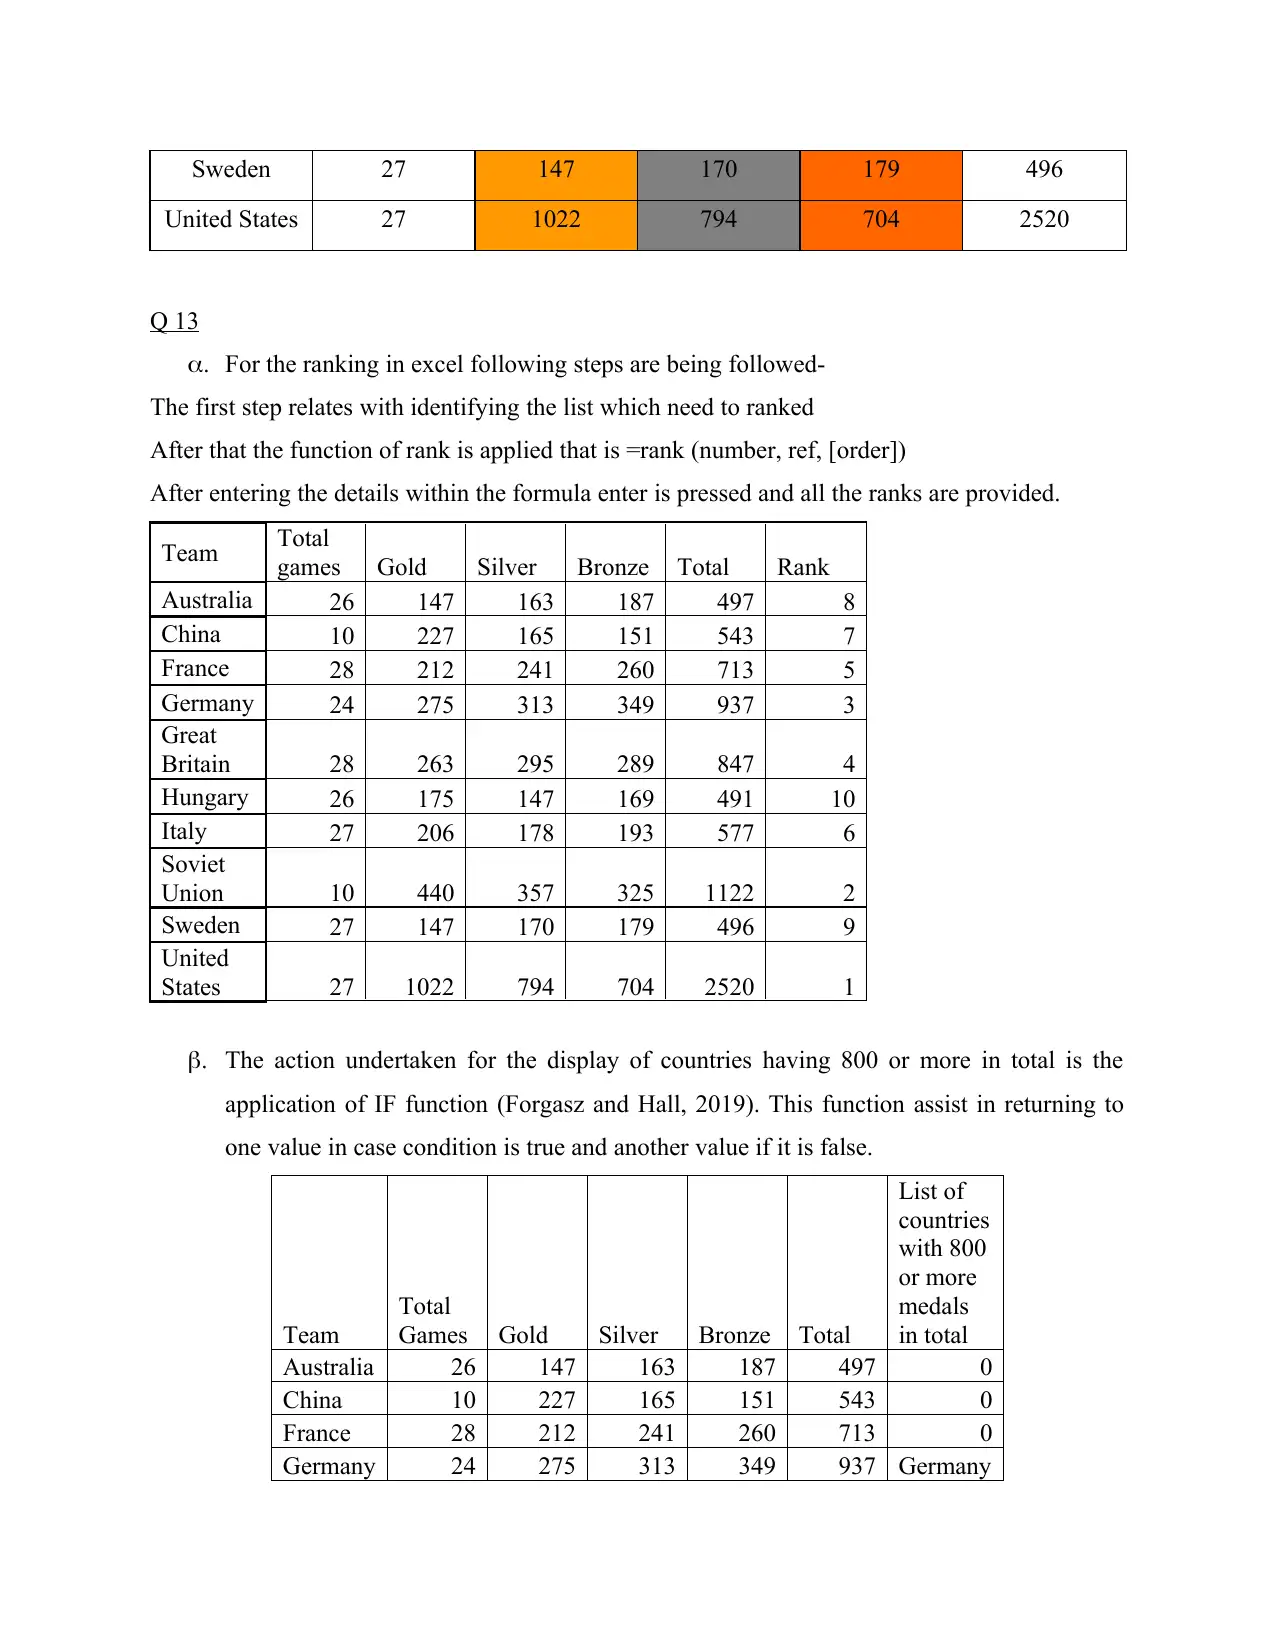
Q 13
a. For the ranking in excel following steps are being followed-
The first step relates with identifying the list which need to ranked
After that the function of rank is applied that is =rank (number, ref, [order])
After entering the details within the formula enter is pressed and all the ranks are provided.
Team Total
games Gold Silver Bronze Total Rank
Australia 26 147 163 187 497 8
China 10 227 165 151 543 7
France 28 212 241 260 713 5
Germany 24 275 313 349 937 3
Great
Britain 28 263 295 289 847 4
Hungary 26 175 147 169 491 10
Italy 27 206 178 193 577 6
Soviet
Union 10 440 357 325 1122 2
Sweden 27 147 170 179 496 9
United
States 27 1022 794 704 2520 1
b. The action undertaken for the display of countries having 800 or more in total is the
application of IF function (Forgasz and Hall, 2019). This function assist in returning to
one value in case condition is true and another value if it is false.
Team
Total
Games Gold Silver Bronze Total
List of
countries
with 800
or more
medals
in total
Australia 26 147 163 187 497 0
China 10 227 165 151 543 0
France 28 212 241 260 713 0
Germany 24 275 313 349 937 Germany
United States 27 1022 794 704 2520
Q 13
a. For the ranking in excel following steps are being followed-
The first step relates with identifying the list which need to ranked
After that the function of rank is applied that is =rank (number, ref, [order])
After entering the details within the formula enter is pressed and all the ranks are provided.
Team Total
games Gold Silver Bronze Total Rank
Australia 26 147 163 187 497 8
China 10 227 165 151 543 7
France 28 212 241 260 713 5
Germany 24 275 313 349 937 3
Great
Britain 28 263 295 289 847 4
Hungary 26 175 147 169 491 10
Italy 27 206 178 193 577 6
Soviet
Union 10 440 357 325 1122 2
Sweden 27 147 170 179 496 9
United
States 27 1022 794 704 2520 1
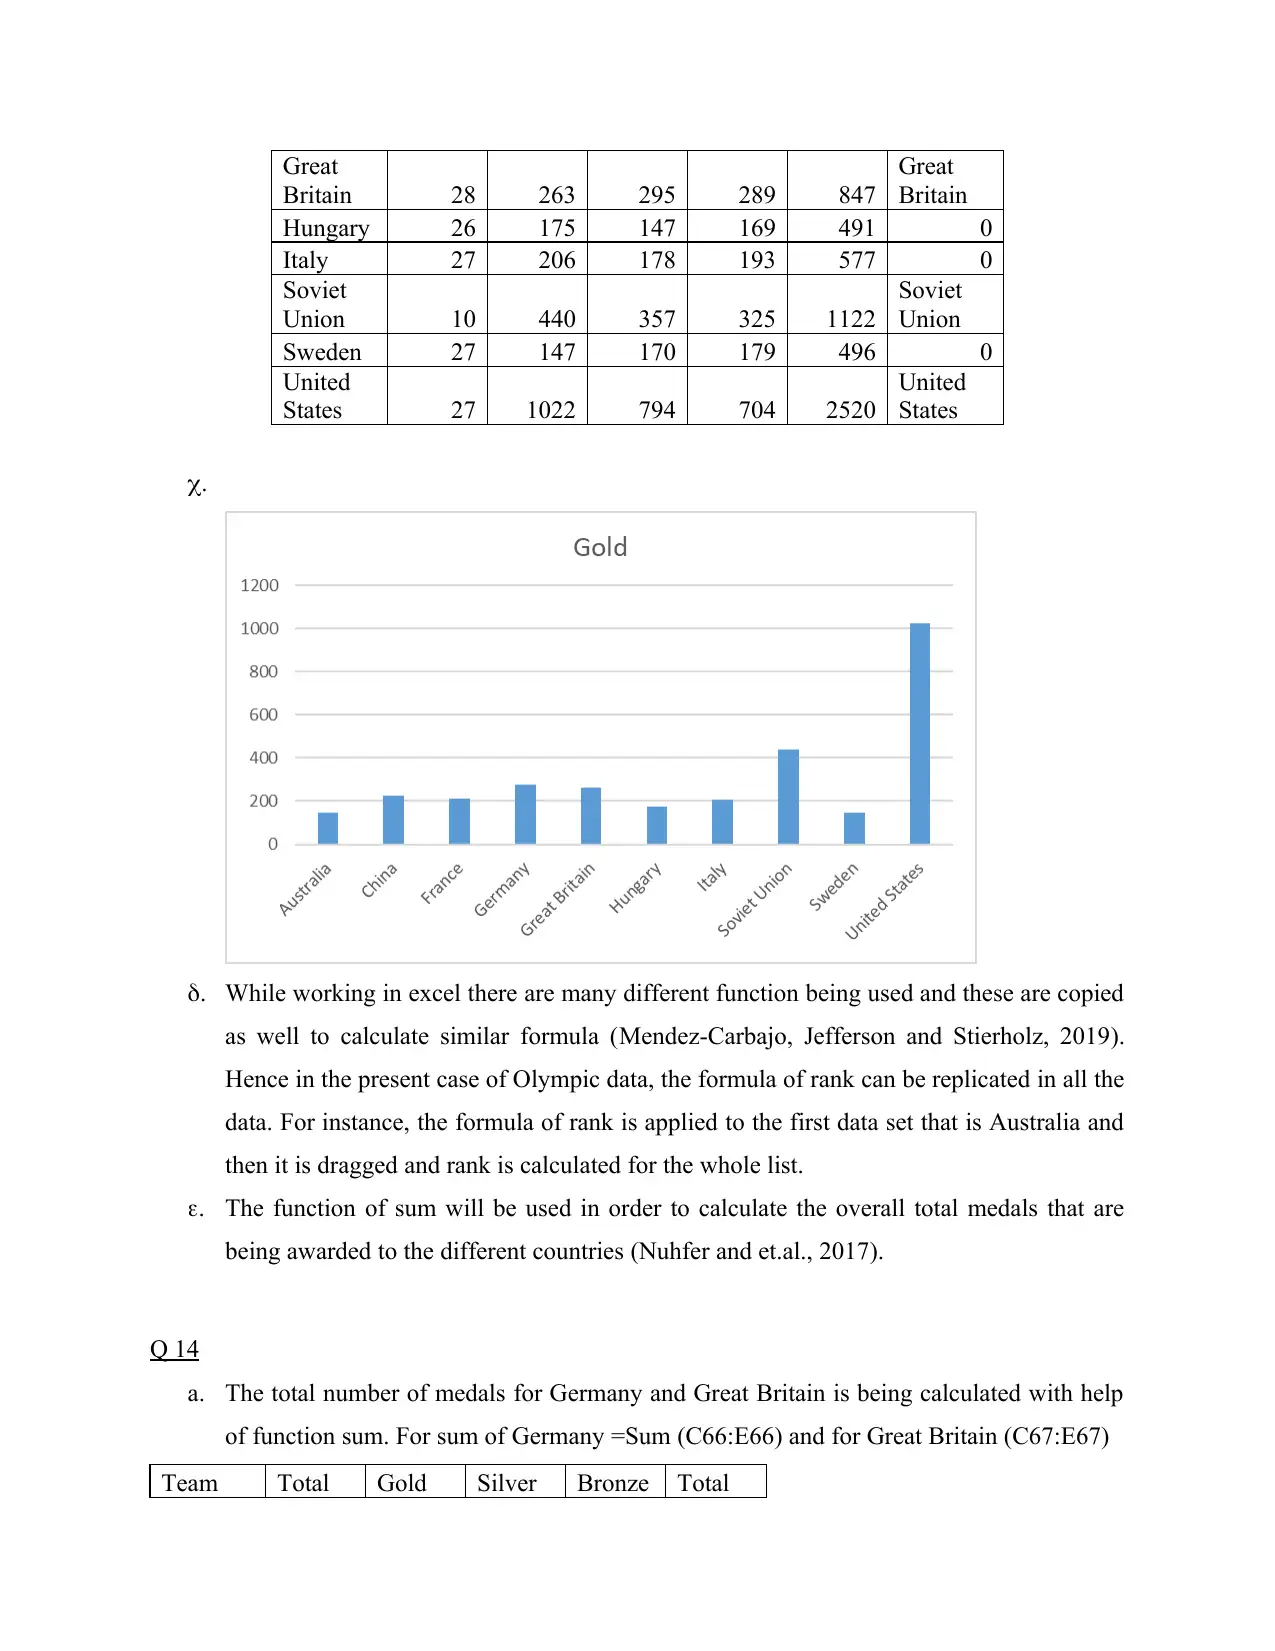
b. The action undertaken for the display of countries having 800 or more in total is the
application of IF function (Forgasz and Hall, 2019). This function assist in returning to
one value in case condition is true and another value if it is false.
Team
Total
Games Gold Silver Bronze Total
List of
countries
with 800
or more
medals
in total
Australia 26 147 163 187 497 0
China 10 227 165 151 543 0
France 28 212 241 260 713 0
Germany 24 275 313 349 937 Germany
Great
Britain 28 263 295 289 847
Great
Britain
Hungary 26 175 147 169 491 0
Italy 27 206 178 193 577 0
Soviet
Union 10 440 357 325 1122
Soviet
Union
Sweden 27 147 170 179 496 0
United
States 27 1022 794 704 2520
United
States
c.
d. While working in excel there are many different function being used and these are copied
as well to calculate similar formula (Mendez-Carbajo, Jefferson and Stierholz, 2019).
Hence in the present case of Olympic data, the formula of rank can be replicated in all the
data. For instance, the formula of rank is applied to the first data set that is Australia and
then it is dragged and rank is calculated for the whole list.
e. The function of sum will be used in order to calculate the overall total medals that are
being awarded to the different countries (Nuhfer and et.al., 2017).
Q 14
a. The total number of medals for Germany and Great Britain is being calculated with help
of function sum. For sum of Germany =Sum (C66:E66) and for Great Britain (C67:E67)
Team Total Gold Silver Bronze Total
⊘ This is a preview!⊘
Do you want full access?
Subscribe today to unlock all pages.
Trusted by 1+ million students worldwide
1 out of 17
Related Documents


Your All-in-One AI-Powered Toolkit for Academic Success.
+13062052269
info@desklib.com
Available 24*7 on WhatsApp / Email
![[object Object]](/_next/static/media/star-bottom.7253800d.svg)
Unlock your academic potential
Copyright © 2020–2026 A2Z Services. All Rights Reserved. Developed and managed by ZUCOL.