Numeracy, Data & IT Portfolio: Solutions, Analysis & Excel Usage
VerifiedAdded on 2023/06/18
|22
|4667
|295
Portfolio
AI Summary
This document presents a comprehensive portfolio of solutions to various numeracy, data, and IT-related tasks. It covers fundamental mathematical concepts such as fractions, percentages, and simplification, applying these to practical problems. The portfolio includes detailed calculations and working notes for each task, demonstrating a clear understanding of the underlying principles. Furthermore, it showcases the use of Microsoft Excel for data analysis, including calculating averages, medians, standard deviations, and creating charts for data visualization. The tasks range from basic arithmetic to more complex statistical analysis, highlighting the application of numeracy and data skills in real-world scenarios. This resource is valuable for students seeking to enhance their understanding of numeracy, data analysis, and IT skills, with clear explanations and practical examples.
Using Numeracy, Data
and IT Portfolio of
Task
and IT Portfolio of
Task
Paraphrase This Document
Need a fresh take? Get an instant paraphrase of this document with our AI Paraphraser
Contents
INTRODUCTION...........................................................................................................................5
TASK 1............................................................................................................................................5
Define the terms:..........................................................................................................................5
TASK 2............................................................................................................................................6
Express 24/40 and 18/42 in its lowest forms...............................................................................6
TASK 3............................................................................................................................................6
a) Solve the fractions 2/3, 3/4 and 5/6 with a denominator of 12................................................6
b) If computing books are two-thirds of the remainder. What is the percentage of the
computing books in library?........................................................................................................7
TASK 4............................................................................................................................................7
Calculate the price of each pair of running shoes with full working...........................................7
TASK 5............................................................................................................................................8
a) Define 240.50 x 19.54 in 2 significant figures after decimal..................................................8
b) Compose the figure 52100 as a power of 10...........................................................................8
TASK 6............................................................................................................................................8
a) Compute total savings made by 3 siblings and show working of the answer..........................8
b) Calculate average savings per sibling......................................................................................8
TASK 7............................................................................................................................................8
a) Elaborate 3/4 - 7/9 + 2/3..........................................................................................................8
b) Find the largest of the following numbers- 0.1, 0.02, 0.003, 0.0004, 0.00005?......................9
TASK 8............................................................................................................................................9
What was the percentage of men who said No with working?....................................................9
TASK 9............................................................................................................................................9
If Annabelle has to reach on time for the meeting in Birmingham, what is the latest time that
she can leave home, Show your working.....................................................................................9
TASK 10........................................................................................................................................10
A box of Weetabix weighs 9/25 kg and a box of Shredded Wheat weighs 0.35 kg and? Which
one of the box is heavier?..........................................................................................................10
TASK 11.........................................................................................................................................10
a) Which country has the lowest number of medals among the ten countries?.........................10
b) Which countries competed in the minimum number of total games?...................................10
c) Calculate the mode from the number of games countries took part in?................................10
d)What is the range between the gold medals awarded to the 10 countries?............................10
e) Determine the number of countries who got more silver medals than bronze medals?........10
f) Other than United States, which country got more silver medals, more gold medals and
more bronze medals than Great Britain?....................................................................................11
g) Which country did the received highest number of medals per game? Justify the answer.. .11
h) Give two reasons why a country like Jamaica does not feature in the top 10 medals after
doing very well in athletics........................................................................................................11
i) Ascertain each medal category in which the United States outperformed its closest
competitor, using the given information....................................................................................12
j) Which 3 countries have the most equally distributed gold, silver and bronze medals in the
smallest range.............................................................................................................................12
TASK 12........................................................................................................................................12
Create the worksheet using Excel which includes the text formatting, columns and rows
headings and column highlighting as shown.............................................................................12
TASK 13........................................................................................................................................13
a) What steps in Excel will be taken to rank the countries from 1st to 10th..............................13
⊘ This is a preview!⊘
Do you want full access?
Subscribe today to unlock all pages.
Trusted by 1+ million students worldwide
b) State the specific steps in Excel that will make a list of those countries with 800 or more
medals in total?..........................................................................................................................13
c) Which type of graph will be suitable for representing only gold medals information?........14
d) In which columns might reproduction have been used?........................................................14
e) Which formula will be used in Excel to compute the total medals honoured?......................14
TASK 14........................................................................................................................................14
a) Give the total number of medals for Germany and Great Britain using Excel Function......14
b) Calculate the average number of silver medals for a European country, using Excel..........14
c) Sum the Medals Total for Gold for those countries with less than 20 games involvement...15
d) Search the whole database to find ‘Italy’ and also the proportionate Medals Total, using
Excel..........................................................................................................................................15
TASK 15........................................................................................................................................15
a) Compute the median for each medal type, giving the formula used for finding the median
for the gold medals, using Microsoft Excel and attach the screenshot......................................15
b) Calculate the mean for each type of medal, state the formula which can be used for
determining the mean for the bronze medals, using Excel and give the screenshot..................16
c) Find out the standard deviation of total number of medals granted to each country using the
formula. Show all the steps........................................................................................................17
d) Using the data sheet as a basis, discuss the use of standard deviation from the given data.. 18
TASK 16........................................................................................................................................19
Use an appropriate labelled chart to compare the gold, silver and bronze medals in Excel of all
the countries given.........................................................................................................................19
Use a suitable labelled chart to show the share of total medals of each country in Excel.........19
CONCLUSION..............................................................................................................................19
REFERENCES..............................................................................................................................20
Paraphrase This Document
Need a fresh take? Get an instant paraphrase of this document with our AI Paraphraser
INTRODUCTION
This report presents the calculation and analysis of the numeric data. Numeracy means
the skills and behaviour one need to solve the mathematical problems. These skills are needed in
the arithmetic dealings in addition, subtraction, multiplication, and division. This ability of
solving is used in day to day activities for the fundamental calculations. The concept of
numeracy is applied on even a small calculation in everyday activities, such as understanding of
the numbers, sorting accordingly to the question demanding and thinking which type of numeric
problem is this. Fractions represents the number as a whole. It includes numerator and
denominator. It can be proper, improper and mixed portion. The highest and the lowest common
factor, is used to solve the fractions to its simplest or lowest forms. The data interpretation is
used for the analysis of the statistical data (Behle and Behle, 2017). Excel is used for the
calculation of statistical data and the function used to find out the solution and to interpret the
data.
TASK 1
Define the terms:
(a) Numerator: It is the part of the fraction which lies above the line. When a certain portion is
given as a/b, where a is the numerator and b is the denominator. In other words, the above
number above the bar signifies the numerator. For example, 5/9 is the fraction given in the
question. So, here 5 will be the numerator.
(b) Denominator: It is the bottom number of a fraction, which lies under the line. It represents
the number of equal parts an item will be divided into. A denominator can never be zero. For
example, 15/9 is the fraction. Here, 9 is the denominator, which means that the numerator 15 will
be divided by 9 to get the number. It is also known as the divisor (Cavadel and Frye, 2017).
TASK 2
Express 24/40 and 18/42 in its lowest forms.
Simplest Forms: It the term which is commonly used in fractions where no common
factor other than is present in the numerator and denominator. It basically means reducing the
factor to its lowest terms.
Steps of simplifying fractions:
1. Find the Highest Common Factor (HCF) of numerator and denominator.
1. Divide both the numerator and denominator by the HCF.
2. The faction will be in its lowest form (Civil, Stoehr and Salazar, 2020).
a) 24/40: It can be simplified in the following steps:
1. HCF of 24/80 is 8.
2. Divide 24 and 40 by 8
3. 3/5 will come.
Simplest form of 24/40 is 3/5.
b) 18/42: The simplification steps are:
1. HCF of 18/42 is 6
1. Divide 18 and 42 by 6
2. 3/7 will come
Lowest form of 18/42 is 3/7.
TASK 3
a) Solve the fractions 2/3, 3/4 and 5/6 with a denominator of 12.
The denominator given is 12.
2/3: The steps will need to be followed for the calculation are:
1. The denominator given is 12, it will be divided by 3. The value will come by dividing
12/3 = 4
2. After this, numerator and denominator will be multiplied by 4
3. After multiplying, the fraction will be 8/12
3/4
⊘ This is a preview!⊘
Do you want full access?
Subscribe today to unlock all pages.
Trusted by 1+ million students worldwide
1. As per the question, denominator is 12. So, it will be divided by 4. After division 3 will
come
1. Multiply numerator and denominator by 3
2. After multiplying, the answer will be 9/12
5/6
1. The denominator should be 12. It needs to be divided by 6. After division, 2 will come
1. Now, multiply both the numerator and the denominator by 2
2. After multiplying, the fraction will be 10/12
So the above, equivalent fractions of 2/3, ¾ and 5/6 is 8/12, 9/12 and 10/12.
b) If computing books are two-thirds of the remainder. What is the percentage of the computing
books in library?
Total number of books in library = 60,000
Psychology and Law books = 12,000
Business Books = 14,000
Healthcare Books = 22,000
Remaining Number of Books = 60000 – (14000 + 22000 + 12000) = 12000
Total computer books are 2/3 of the remaining = 2/3 * 12000 = 8000
Hence, the percentage of library books on computing = 8000/60000 * 100 = 13.33%.
TASK 4
Calculate the price of each pair of running shoes with full working.
Price of running shoes per pair is £69.75
Working:
Liz purchased pairs of running shoes = 2
She received change = £10.50
Liz gave 3 crisp £50 notes = £50 * 3 = £150
Each pair of running shoes is mentioned as x
henceforth,
2x + 10.50 = 150
Paraphrase This Document
Need a fresh take? Get an instant paraphrase of this document with our AI Paraphraser
2x = 150 – 10.50
2x = 139.50
x = 139.5/2 = 69.75.
TASK 5
a) Define 240.50 x 19.54 in 2 significant figures after decimal.
From the equation, 240.50 x 19.54 it can be determined that it consists a 2 digits after
decimal of each value.
240.50 x 19.54 = 4699.37 (2 significant values after decimal)
b) Compose the figure 52100 as a power of 10.
5.21 * 104.
TASK 6
a) Compute total savings made by 3 siblings and show working of the answer.
Total savings of 3 siblings will be = £ 210/70* 30 = £90
Working Notes:
£210 is equal to 70%, at which they signed up the gym. Discount given was 30%, which could
also be known as the saved amount.
b) Calculate average savings per sibling.
Total savings of 3 persons = £90
So total saving per person = £90/3 = £ 30.
TASK 7
a) Elaborate 3/4 - 7/9 + 2/3.
Steps of solving the above problems is:
Find the lowest common factor of denominators of 4, 9, 3 = 36
Now, 27 – 28 + 24 = 23/36
36
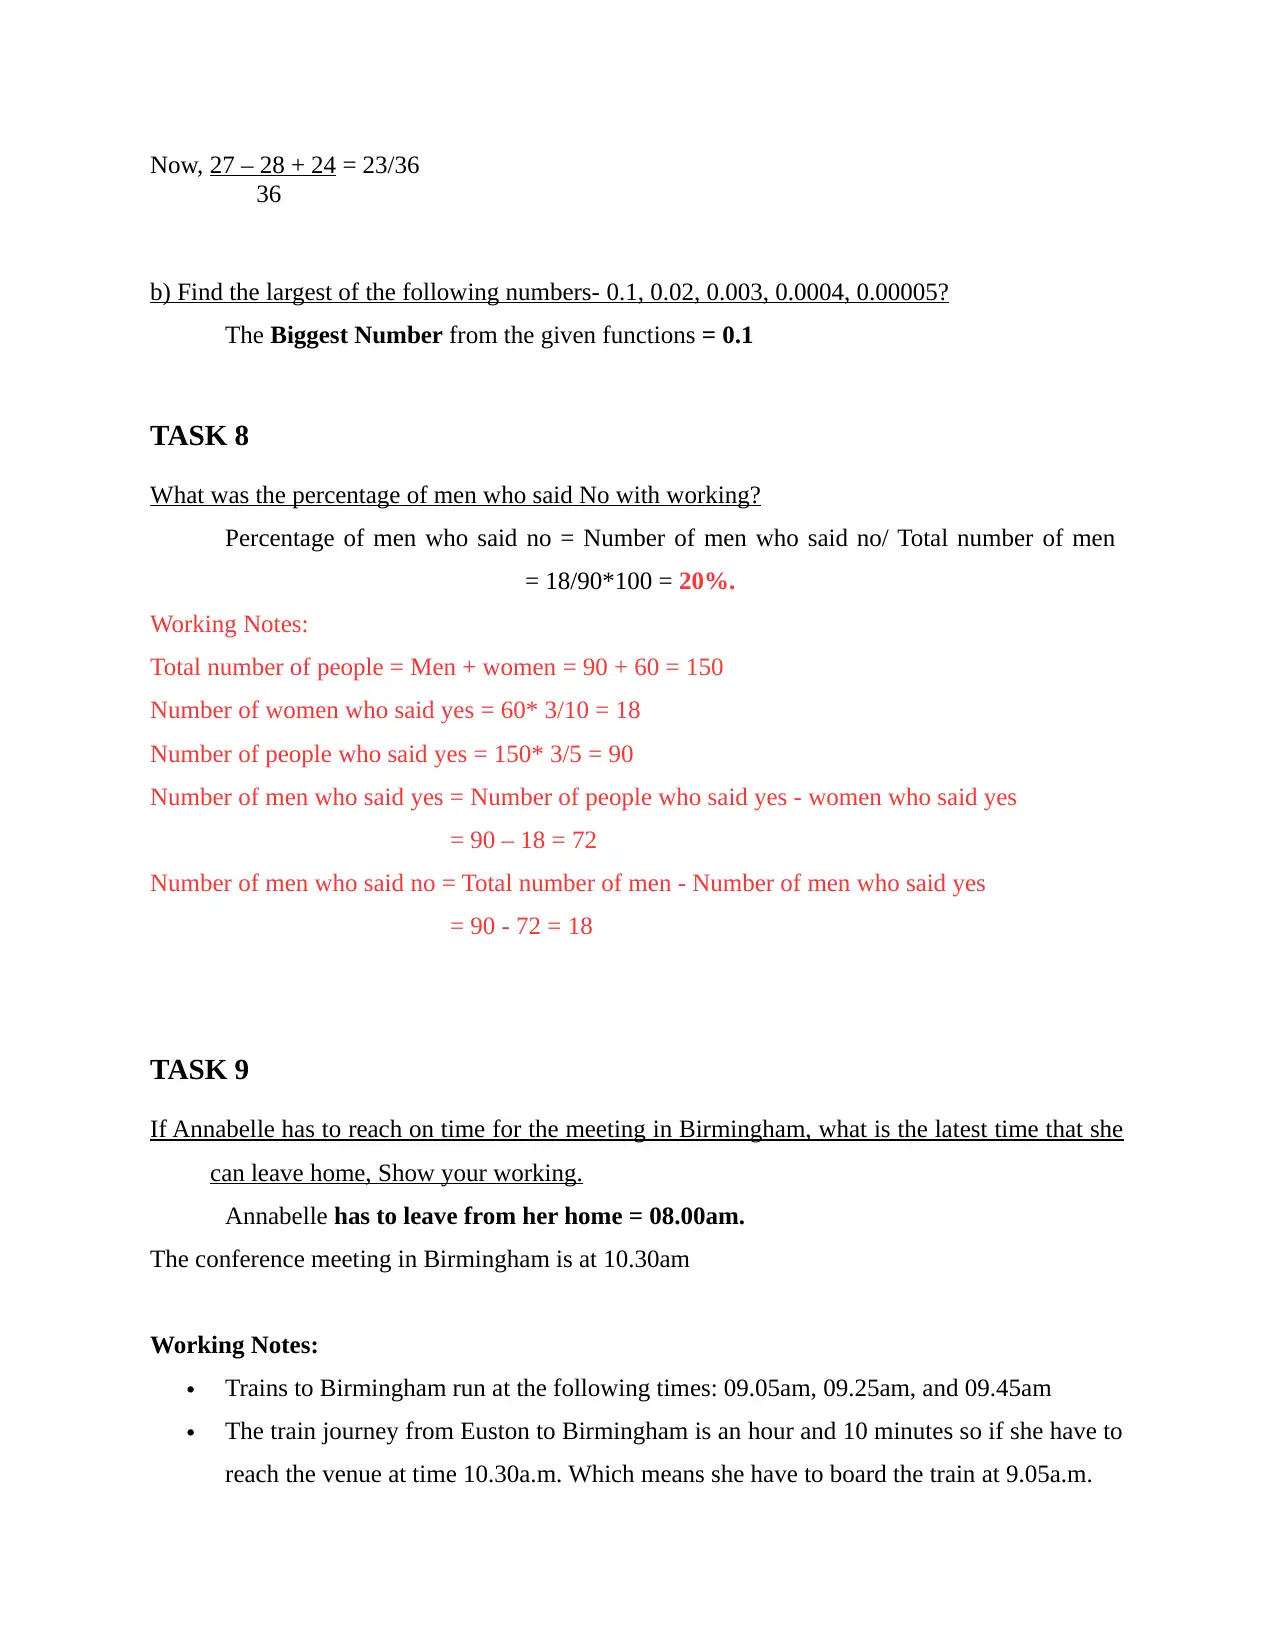
b) Find the largest of the following numbers- 0.1, 0.02, 0.003, 0.0004, 0.00005?
The Biggest Number from the given functions = 0.1
TASK 8
What was the percentage of men who said No with working?
Percentage of men who said no = Number of men who said no/ Total number of men
= 18/90*100 = 20%.
Working Notes:
Total number of people = Men + women = 90 + 60 = 150
Number of women who said yes = 60* 3/10 = 18
Number of people who said yes = 150* 3/5 = 90
Number of men who said yes = Number of people who said yes - women who said yes
= 90 – 18 = 72
Number of men who said no = Total number of men - Number of men who said yes
= 90 - 72 = 18
TASK 9
If Annabelle has to reach on time for the meeting in Birmingham, what is the latest time that she
can leave home, Show your working.
Annabelle has to leave from her home = 08.00am.
The conference meeting in Birmingham is at 10.30am
Working Notes:
Trains to Birmingham run at the following times: 09.05am, 09.25am, and 09.45am
The train journey from Euston to Birmingham is an hour and 10 minutes so if she have to
reach the venue at time 10.30a.m. Which means she have to board the train at 9.05a.m.
36
b) Find the largest of the following numbers- 0.1, 0.02, 0.003, 0.0004, 0.00005?
The Biggest Number from the given functions = 0.1
TASK 8
What was the percentage of men who said No with working?
Percentage of men who said no = Number of men who said no/ Total number of men
= 18/90*100 = 20%.
Working Notes:
Total number of people = Men + women = 90 + 60 = 150
Number of women who said yes = 60* 3/10 = 18
Number of people who said yes = 150* 3/5 = 90
Number of men who said yes = Number of people who said yes - women who said yes
= 90 – 18 = 72
Number of men who said no = Total number of men - Number of men who said yes
= 90 - 72 = 18
TASK 9
If Annabelle has to reach on time for the meeting in Birmingham, what is the latest time that she
can leave home, Show your working.
Annabelle has to leave from her home = 08.00am.
The conference meeting in Birmingham is at 10.30am
Working Notes:
Trains to Birmingham run at the following times: 09.05am, 09.25am, and 09.45am
The train journey from Euston to Birmingham is an hour and 10 minutes so if she have to
reach the venue at time 10.30a.m. Which means she have to board the train at 9.05a.m.
⊘ This is a preview!⊘
Do you want full access?
Subscribe today to unlock all pages.
Trusted by 1+ million students worldwide
Time to get Euston Rail Station is 1 hour so she will be at station at 09.00 am.
She will reach the Birmingham station at 10.15am.
After walking 5 minutes from the station to the meeting place she will reach the venue at
10.20am.
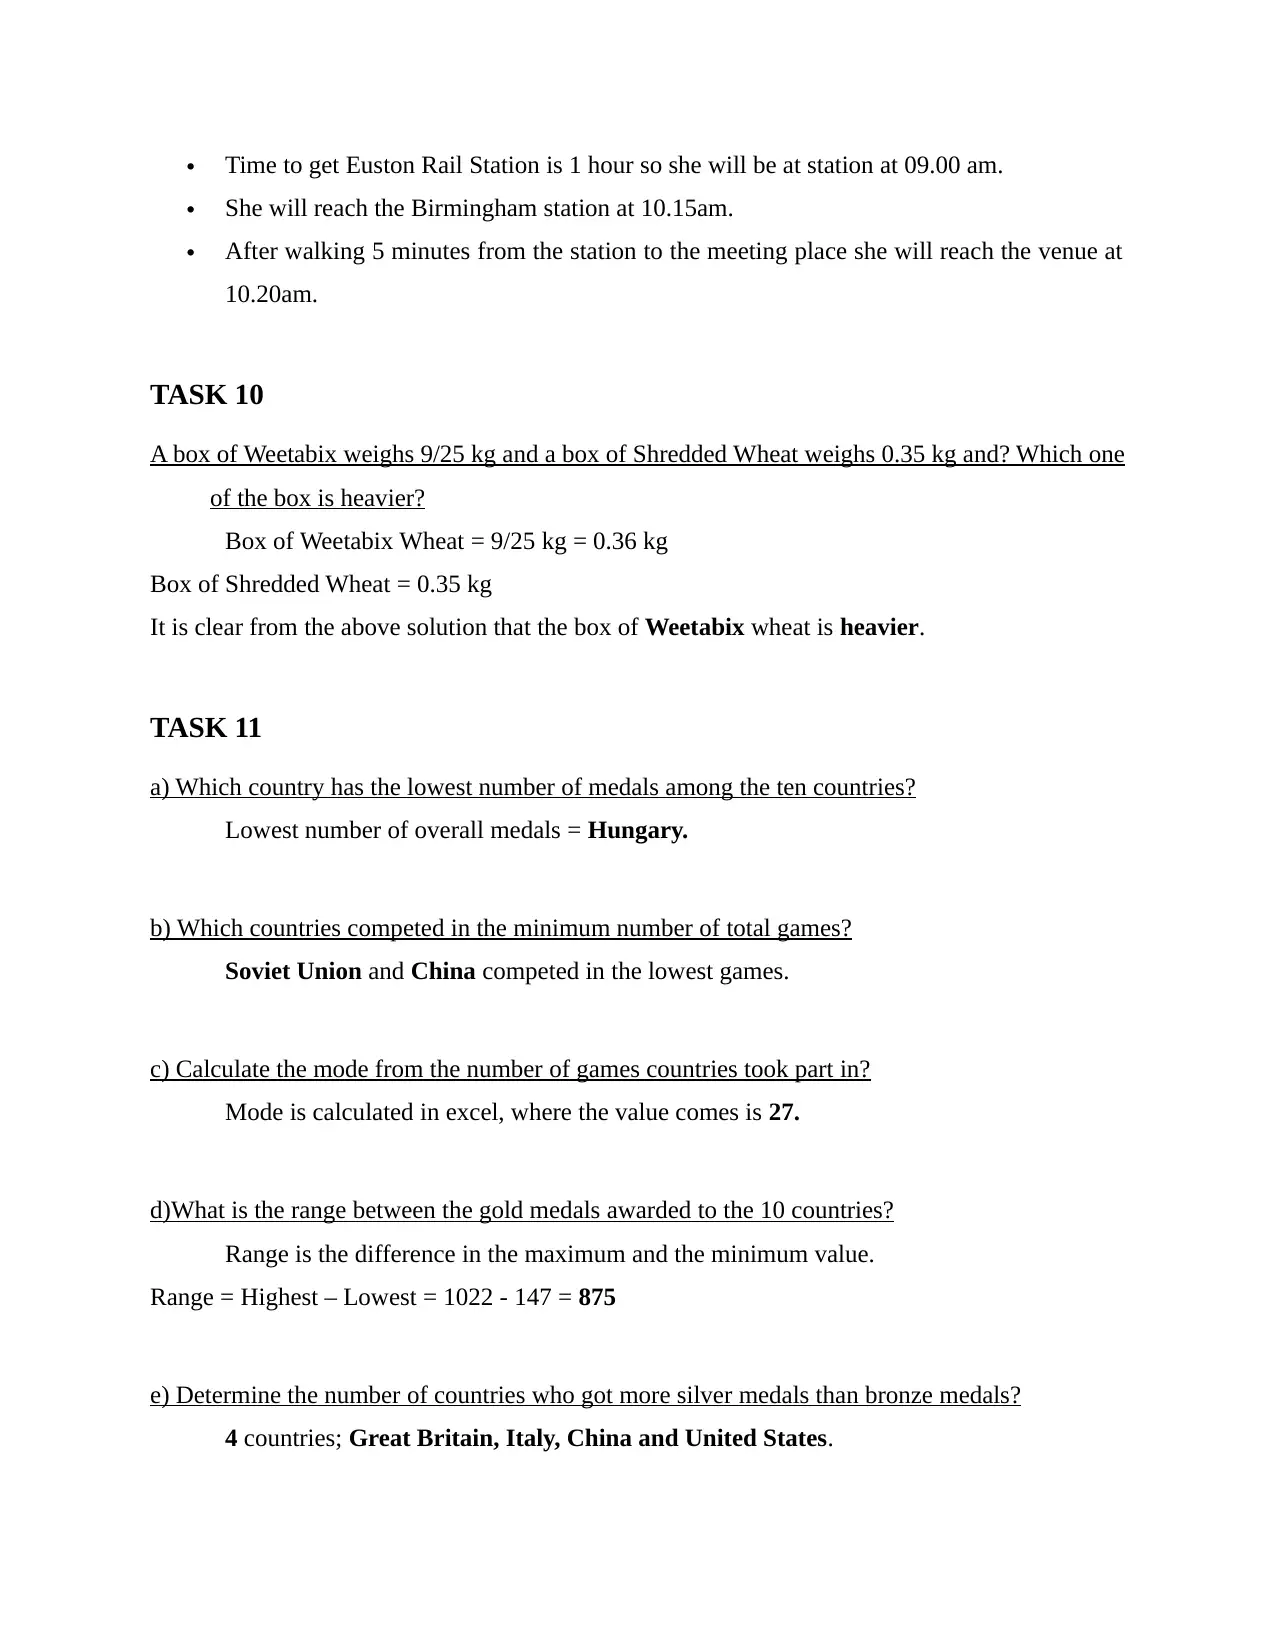
TASK 10
A box of Weetabix weighs 9/25 kg and a box of Shredded Wheat weighs 0.35 kg and? Which one
of the box is heavier?
Box of Weetabix Wheat = 9/25 kg = 0.36 kg
Box of Shredded Wheat = 0.35 kg
It is clear from the above solution that the box of Weetabix wheat is heavier.
TASK 11
a) Which country has the lowest number of medals among the ten countries?
Lowest number of overall medals = Hungary.
b) Which countries competed in the minimum number of total games?
Soviet Union and China competed in the lowest games.
c) Calculate the mode from the number of games countries took part in?
Mode is calculated in excel, where the value comes is 27.
d)What is the range between the gold medals awarded to the 10 countries?
Range is the difference in the maximum and the minimum value.
Range = Highest – Lowest = 1022 - 147 = 875
e) Determine the number of countries who got more silver medals than bronze medals?
4 countries; Great Britain, Italy, China and United States.
She will reach the Birmingham station at 10.15am.
After walking 5 minutes from the station to the meeting place she will reach the venue at
10.20am.
TASK 10
A box of Weetabix weighs 9/25 kg and a box of Shredded Wheat weighs 0.35 kg and? Which one
of the box is heavier?
Box of Weetabix Wheat = 9/25 kg = 0.36 kg
Box of Shredded Wheat = 0.35 kg
It is clear from the above solution that the box of Weetabix wheat is heavier.
TASK 11
a) Which country has the lowest number of medals among the ten countries?
Lowest number of overall medals = Hungary.
b) Which countries competed in the minimum number of total games?
Soviet Union and China competed in the lowest games.
c) Calculate the mode from the number of games countries took part in?
Mode is calculated in excel, where the value comes is 27.
d)What is the range between the gold medals awarded to the 10 countries?
Range is the difference in the maximum and the minimum value.
Range = Highest – Lowest = 1022 - 147 = 875
e) Determine the number of countries who got more silver medals than bronze medals?
4 countries; Great Britain, Italy, China and United States.
Paraphrase This Document
Need a fresh take? Get an instant paraphrase of this document with our AI Paraphraser
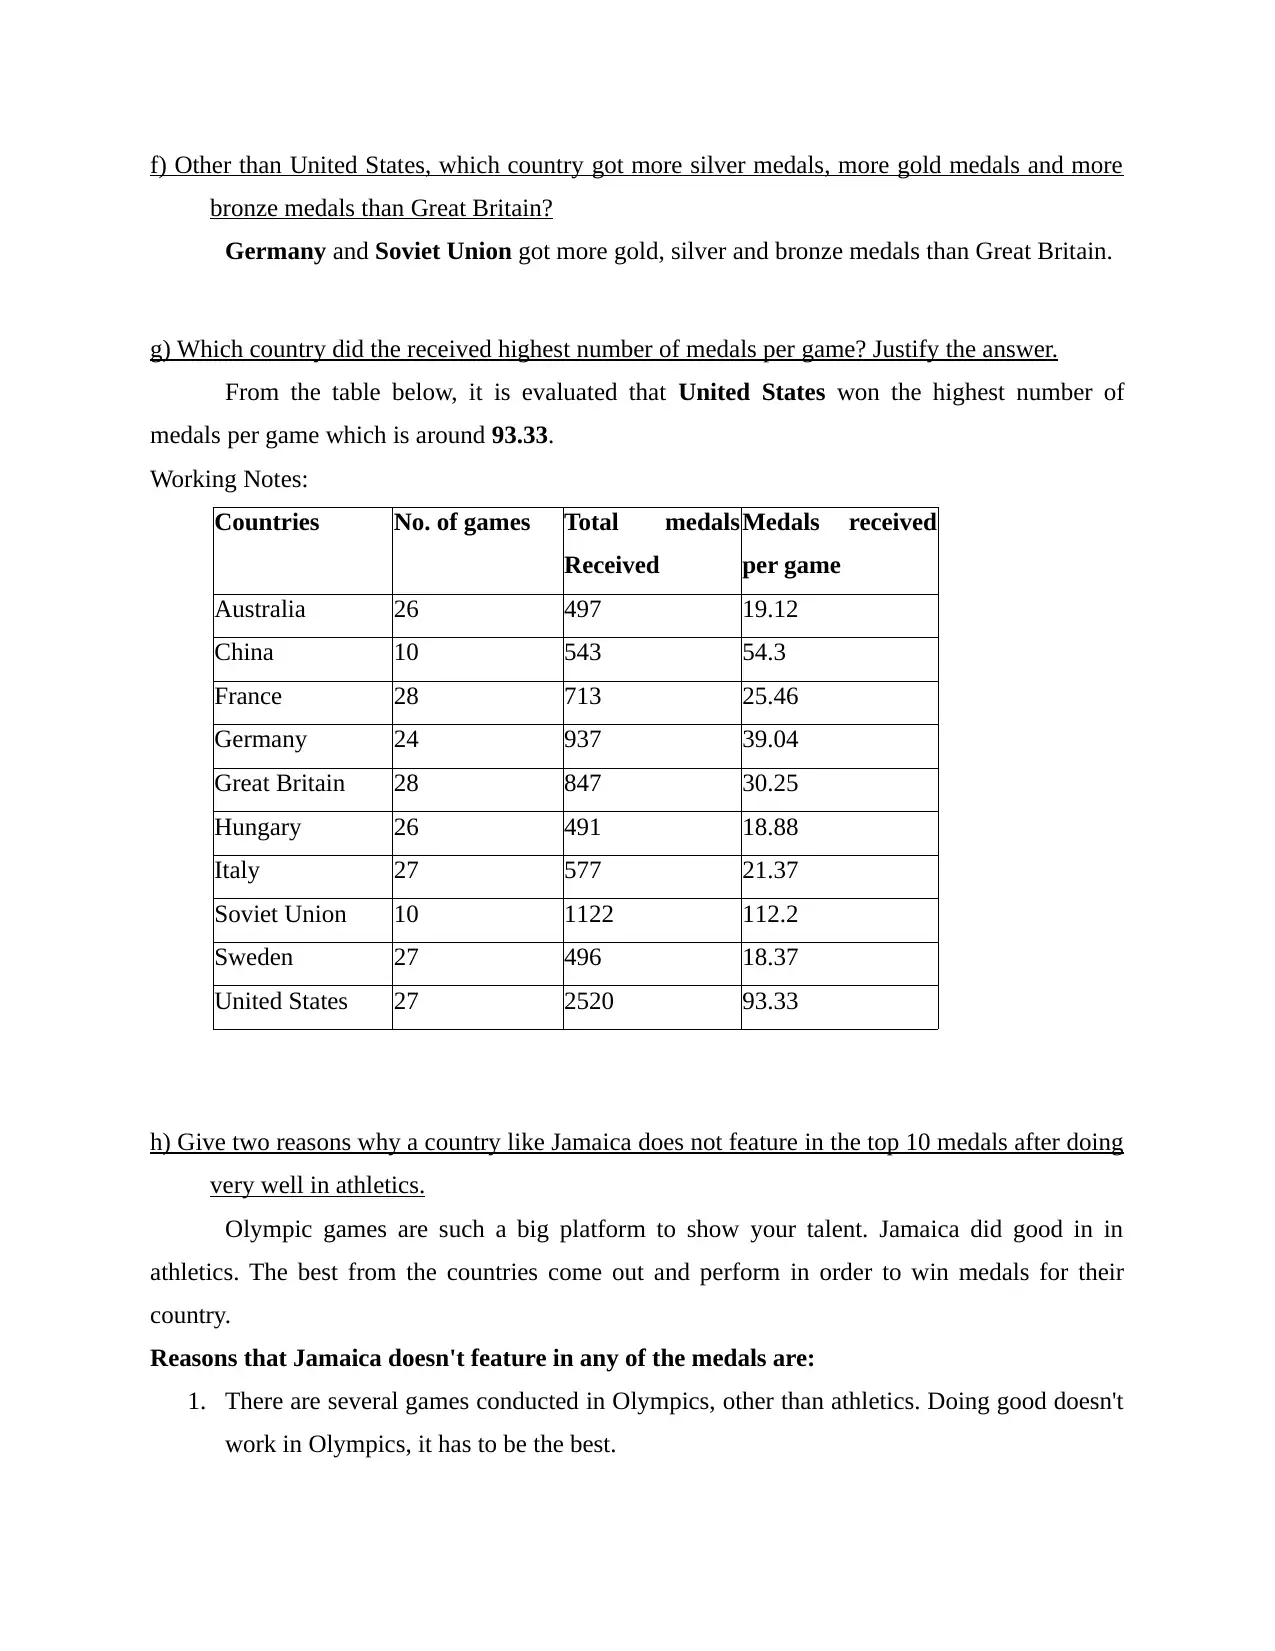
f) Other than United States, which country got more silver medals, more gold medals and more
bronze medals than Great Britain?
Germany and Soviet Union got more gold, silver and bronze medals than Great Britain.
g) Which country did the received highest number of medals per game? Justify the answer.
From the table below, it is evaluated that United States won the highest number of
medals per game which is around 93.33.
Working Notes:
Countries No. of games Total medals
Received
Medals received
per game
Australia 26 497 19.12
China 10 543 54.3
France 28 713 25.46
Germany 24 937 39.04
Great Britain 28 847 30.25
Hungary 26 491 18.88
Italy 27 577 21.37
Soviet Union 10 1122 112.2
Sweden 27 496 18.37
United States 27 2520 93.33
h) Give two reasons why a country like Jamaica does not feature in the top 10 medals after doing
very well in athletics.
Olympic games are such a big platform to show your talent. Jamaica did good in in
athletics. The best from the countries come out and perform in order to win medals for their
country.
Reasons that Jamaica doesn't feature in any of the medals are:
1. There are several games conducted in Olympics, other than athletics. Doing good doesn't
work in Olympics, it has to be the best.
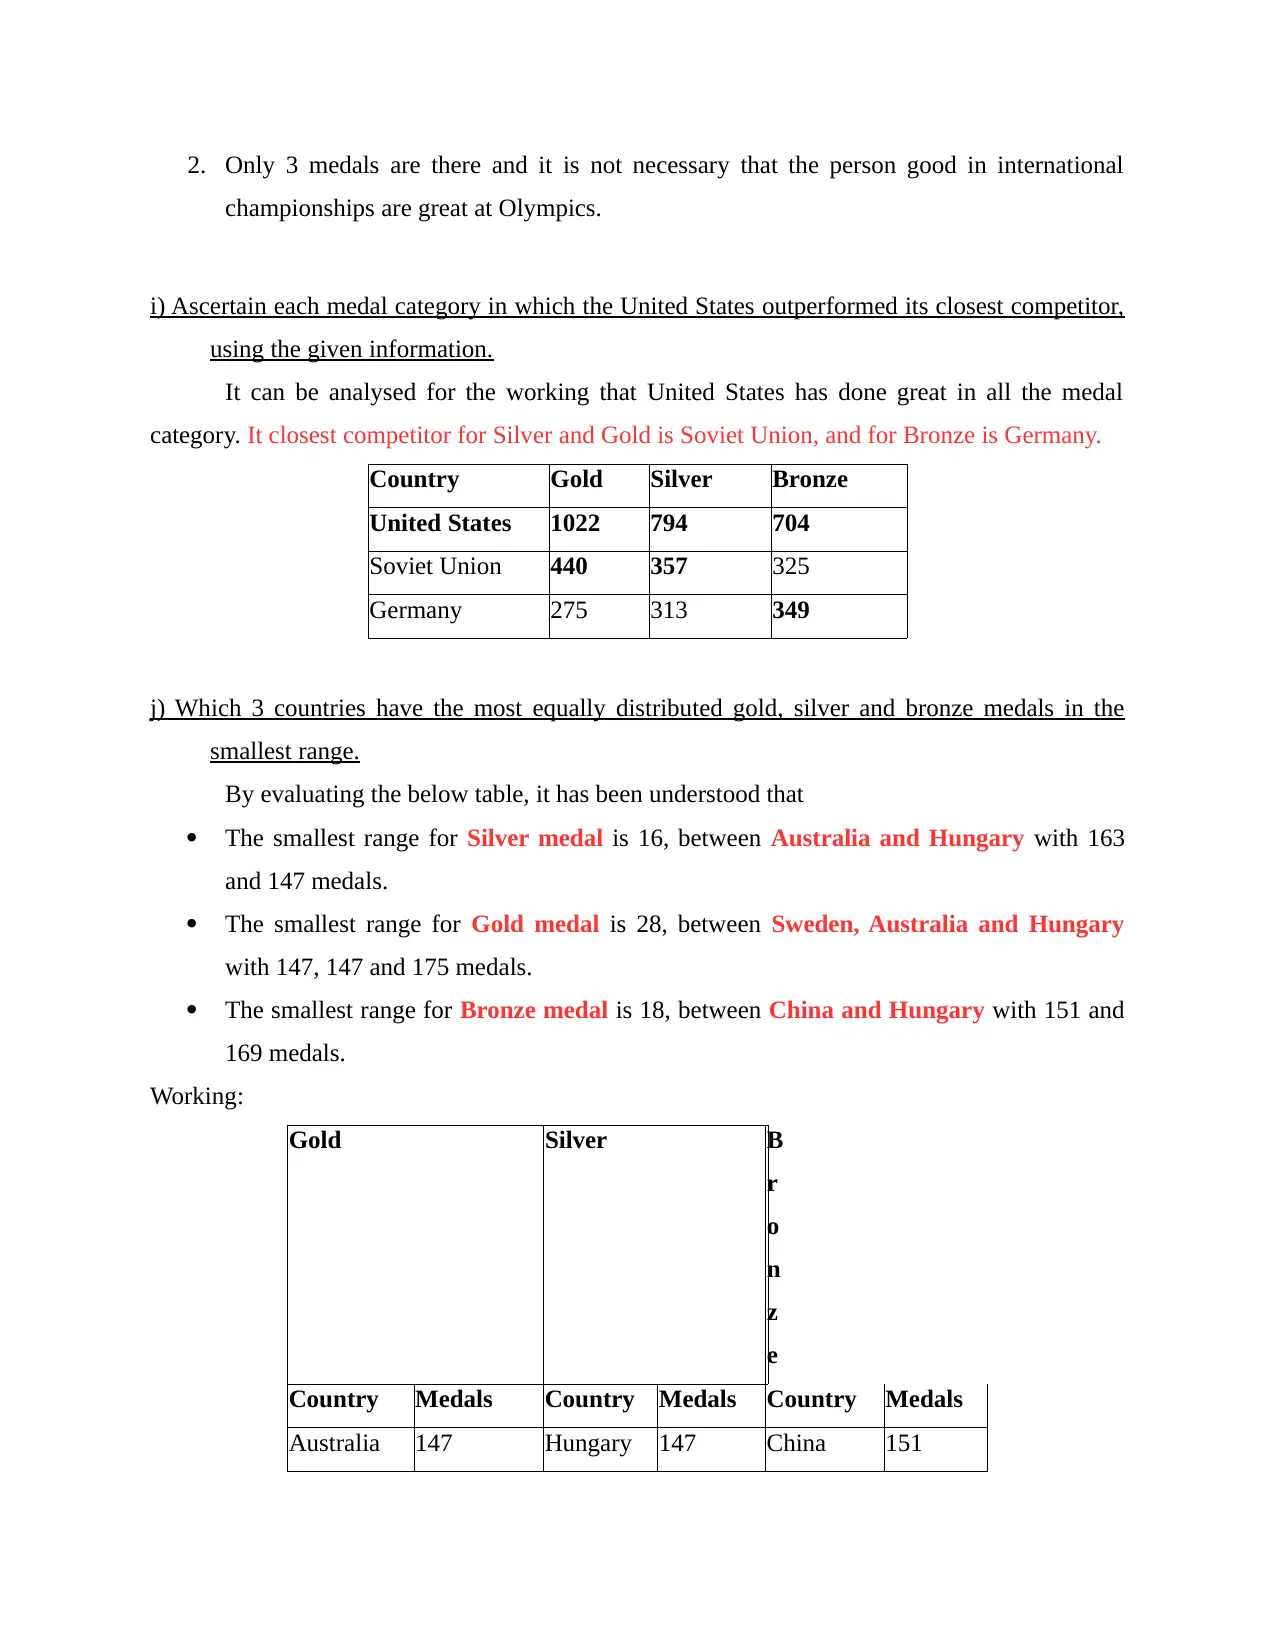
2. Only 3 medals are there and it is not necessary that the person good in international
championships are great at Olympics.
i) Ascertain each medal category in which the United States outperformed its closest competitor,
using the given information.
It can be analysed for the working that United States has done great in all the medal
category. It closest competitor for Silver and Gold is Soviet Union, and for Bronze is Germany.
Country Gold Silver Bronze
United States 1022 794 704
Soviet Union 440 357 325
Germany 275 313 349
j) Which 3 countries have the most equally distributed gold, silver and bronze medals in the
smallest range.
By evaluating the below table, it has been understood that
The smallest range for Silver medal is 16, between Australia and Hungary with 163
and 147 medals.
The smallest range for Gold medal is 28, between Sweden, Australia and Hungary
with 147, 147 and 175 medals.
The smallest range for Bronze medal is 18, between China and Hungary with 151 and
169 medals.
Working:
Gold Silver B
r
o
n
z
e
Country Medals Country Medals Country Medals
Australia 147 Hungary 147 China 151
⊘ This is a preview!⊘
Do you want full access?
Subscribe today to unlock all pages.
Trusted by 1+ million students worldwide
1 out of 22
Related Documents


Your All-in-One AI-Powered Toolkit for Academic Success.
+13062052269
info@desklib.com
Available 24*7 on WhatsApp / Email
![[object Object]](/_next/static/media/star-bottom.7253800d.svg)
Unlock your academic potential
Copyright © 2020–2026 A2Z Services. All Rights Reserved. Developed and managed by ZUCOL.