Analysis of Numeracy, Data & IT: Excel Applications and Data Handling
VerifiedAdded on 2023/06/17
|15
|3346
|221
Report
AI Summary
This report provides a comprehensive analysis of numeracy, data, and IT concepts, focusing on practical applications and problem-solving techniques. It covers fundamental mathematical concepts like numerators and denominators, simplification of fractions, and percentage calculations. The report also delves into data interpretation, using an Olympic Games medal table to analyze medal counts, identify trends, and calculate ratios. Furthermore, it explores various Excel functions, including ranking, filtering, and calculating averages, to demonstrate data manipulation and analysis skills. The report concludes by applying these skills to real-world scenarios, such as calculating savings and determining optimal travel times, showcasing the practical relevance of numeracy, data, and IT in everyday life. Desklib offers a platform to explore more such solved assignments and past papers.
Numeracy, Data & IT
Paraphrase This Document
Need a fresh take? Get an instant paraphrase of this document with our AI Paraphraser
Table of Contents
INTRODUCTION ..........................................................................................................................3
TASK ..............................................................................................................................................3
PART-1.............................................................................................................................................3
PART-2.............................................................................................................................................7
PART-3.............................................................................................................................................8
CONCLUSION .............................................................................................................................14
REFERENCES..............................................................................................................................15
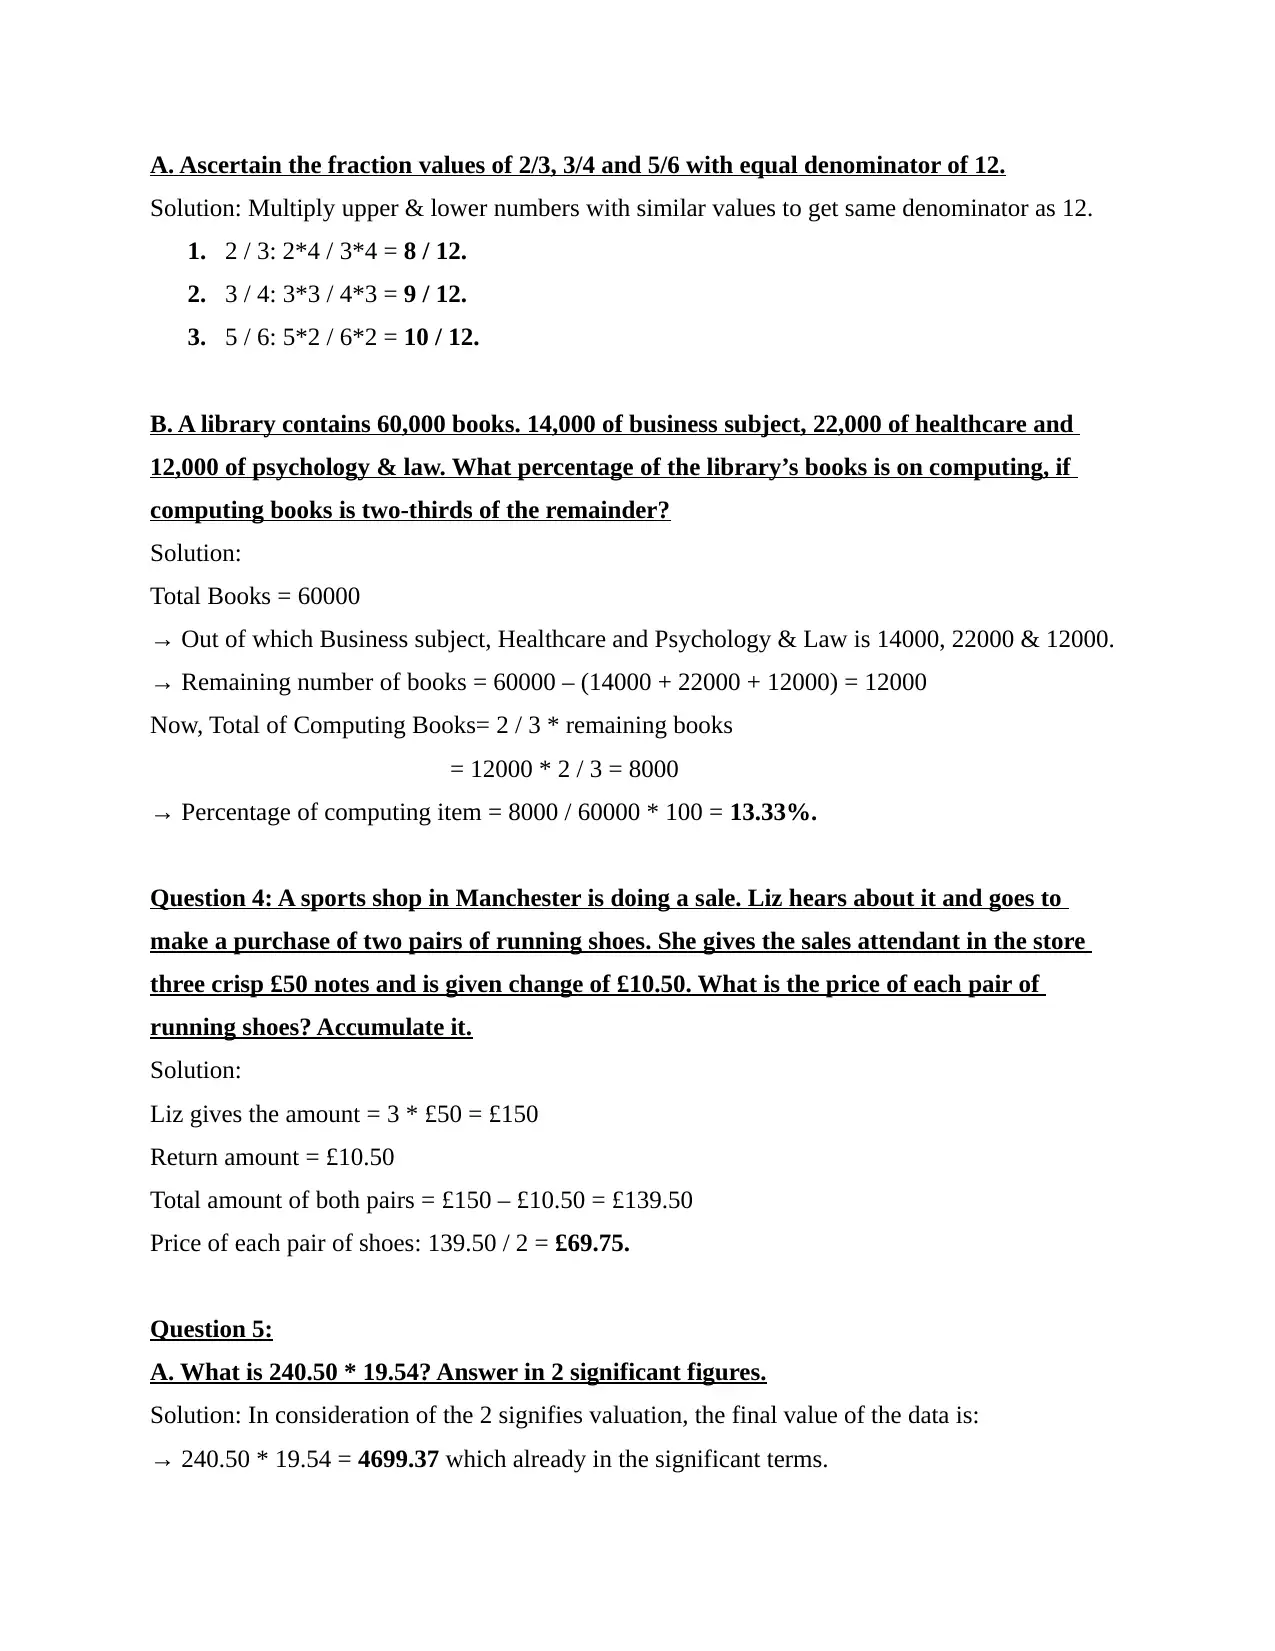
INTRODUCTION
Numeracy is the fundamental analysis for calculating facts & figures using different
mathematical tools such as addition, subtraction, multiplication and division. It is the application
of solving various problems with logical aspects and to make decision on real-life scenarios. It
involves filtering, sorting, defining structure and accumulate it in formative way(Evans and
Ruane, 2019). In this particular report, there has been inclusion of fractional variability, logical
questioning related to practical scenarios, Various functionality of using excel signs and different
charting to show the clarification of the particular tasks.
TASK
PART-1
Question 1: Explain both Numerator and Denominator.
Solution:
A. Numerator is the partial amount of the total valuation which is given on the upper
part of fraction number. Example: 7 / 10, 7 is known as dividend of the values.
B. Denominator is represented as the whole placing at the given portioning which stays
at the bottom of the line bar(Haider-Markel and Joslyn, 2018). Example: 2 / 5, divisor can be
shown as 5 in this figure.
Question 2: Identify 24/40 & 18/42 in simple form.
Solution:
I. 24 / 40:
HCF of 24 & 40 = 8
Both numbers divided by 8; 24 / 8 & 40 / 8
Simplex formation: 3 / 5.
II. 18 / 42:
HCF of 18 & 42 = 6
Both numbers divided by 6; 18 / 6 & 42 / 6
Simplex formation: 3 / 7.
Question 3:
⊘ This is a preview!⊘
Do you want full access?
Subscribe today to unlock all pages.
Trusted by 1+ million students worldwide
A. Ascertain the fraction values of 2/3, 3/4 and 5/6 with equal denominator of 12.
Solution: Multiply upper & lower numbers with similar values to get same denominator as 12.
1. 2 / 3: 2*4 / 3*4 = 8 / 12.
2. 3 / 4: 3*3 / 4*3 = 9 / 12.
3. 5 / 6: 5*2 / 6*2 = 10 / 12.
B. A library contains 60,000 books. 14,000 of business subject, 22,000 of healthcare and
12,000 of psychology & law. What percentage of the library’s books is on computing, if
computing books is two-thirds of the remainder?
Solution:
Total Books = 60000
→ Out of which Business subject, Healthcare and Psychology & Law is 14000, 22000 & 12000.
→ Remaining number of books = 60000 – (14000 + 22000 + 12000) = 12000
Now, Total of Computing Books= 2 / 3 * remaining books
= 12000 * 2 / 3 = 8000
→ Percentage of computing item = 8000 / 60000 * 100 = 13.33%.
Question 4: A sports shop in Manchester is doing a sale. Liz hears about it and goes to
make a purchase of two pairs of running shoes. She gives the sales attendant in the store
three crisp £50 notes and is given change of £10.50. What is the price of each pair of
running shoes? Accumulate it.
Solution:
Liz gives the amount = 3 * £50 = £150
Return amount = £10.50
Total amount of both pairs = £150 – £10.50 = £139.50
Price of each pair of shoes: 139.50 / 2 = £69.75.
Question 5:
A. What is 240.50 * 19.54? Answer in 2 significant figures.
Solution: In consideration of the 2 signifies valuation, the final value of the data is:
→ 240.50 * 19.54 = 4699.37 which already in the significant terms.
Paraphrase This Document
Need a fresh take? Get an instant paraphrase of this document with our AI Paraphraser
B. Write the number 52100 as a power of 10.
Solution: 52100 as power 10 is = 5.21 * 10^4.
Question 6:
A. Calculate the total savings by the siblings through taking advantage of the new gym
offer of 30% discount for sign up in the first month. And they gave the total amount of £210
only. Give the answer.
Solution:
Siblings gave amount to gym = £210
After applying discount offer, the valuation of £210 is on 70% (100-30%).
Now, Total savings made = £210 / 70 * 30 = £90.
B. Justify the average savings per person.
Solution:
Total Person = 3
Savings done by per person = £90 / 3 = £30.
Question 7: Find out the following:
A. 3/4 - 7/9 + 2/3
Solution:
→ Take LCM of denominator = 4, 9 & 3 = 36.
→ Valuation of numbers = [(27 – 28 + 24) / 36]
= [(-1 + 24 ) / 36] = 23 / 36.
B. Which is the largest of the various numbers: (0.1, 0.02, 0.003, 0.0004, 0.00005)
Solution: Least decimal values contains the largest number.
→ Largest Number = 0.1
Question 8: Population of men & women with 90 : 60 ration has been asked about the latest
expendables movie. 3/5 of the people said Yes. 3/10 of the women said Yes. What percentage
of the men said No? Calculate this.
Solution:
Total Number of men & women = 90+60 = 150
3 / 5 of people said YES = 150 * 3 / 5 = 90
3 / 10 of women said YES = 60 * 3 / 10 = 18
Men ratio on agree = 90 – 18 = 72
Men ratio on disagree = 90 -72 = 18
→ % of men said NO = 18 / 90 * 100 = 20%.
Question 9: Annabelle lives at Bermondsey in London. She has to speak at a conference in
Birmingham at 10.30am. It will take her an hour from her home to get to Euston Rail
Station, from where she will get a train to Birmingham. The train journey from Euston to
Birmingham is an hour and 10 minutes. Trains to Birmingham run at the following times:
5 minutes past the hour, 25 minutes past the hour and 45 minutes past the hour. The
meeting venue in Birmingham is a 5-minute walk from the station. What is the latest time
that Annabelle can leave home, if she is to make it on time for the meeting in Birmingham?
Explain.
Solution:
The subjective solution of this problem are as follows:
1. She has to leave her house at 8.00 AM and reach at Euston Rail Station at 9.00 AM after
a journey of one hour.
2. She will get the train at 9.05 AM as per the scheduling of train timings.
3. The journey from one station to another one is of 1 hour 10 minutes, so she will reach at
the destination at 10.15 AM.
4. To range between the Birmingham & conference hall is of 5 minutes walking distance, so
she reached at meeting room at 10.20 AM before time.
It can be concluded that she must have to leave her home at 8.00 AM in the morning.
⊘ This is a preview!⊘
Do you want full access?
Subscribe today to unlock all pages.
Trusted by 1+ million students worldwide
Question 10: A box of Shredded Wheat weighs 0.35 kg and a box of Weetabix weighs 9/25
kg? Determine the heavier box between two.
Solution: Shredded wheat weighs = 0.35 Kg.
Weetabix Weighs = 9 / 25 = 0.36 Kg.
→ Heavier box between the two is 0.36 Kg of Weetabix weighs.
PART-2
Question 11:
A. Which country contains the lowest number of overall medals amongst ten?
Solution: Hungary had the less medals among 10 countries.
B. Which countries involved in the least number of games?
Solution: China & Soviet Union.
C. What is the mode of the engagement in number of games?
Solution: Most frequency of participation in games: Mode = 27.
D. Determine the range between the gold medals gained.
Solution: Range = Maximum – Minimum = 1022 – 147 = 875.
E. What is the ratio of getting more silver medals than bronze medals among countries?
Solution: China, Great Britain, Soviet Union & United States had got more silver medals.
F. Which countries received more gold, silver and bronze medals than Great Britain, apart
from United States.
Solution: Germany & Soviet Union, only 2 countries got more medals than Great Britain.
G. Comparison between the countries of participated in and overall medals awarded.
Which country did the extreme well by receiving highest number of medals per game?
Show the justification.
Solution:
Paraphrase This Document
Need a fresh take? Get an instant paraphrase of this document with our AI Paraphraser
1. The most matches played by 2 countries which is France & Great Britain of 28 but their
achievements are comparatively low than the other ones.
2. The second almost games played by 3 countries which is Italy, Sweden and United States
is 27 and between these three, the highest number of medals received by United States.
→ United States = 2520 medals in 27 matches.
→ % of maximum obtaining ratio = 2520 / 27 = 93.33.
H. As per the given data, why Jamaica does not feature in the top 10 listings even performs
well in athletics. Specify 2 reason.
Solution:
1. The top 10 listings of the Olympics Games are containing the overall performance shown
by countries in every gaming session, not only on basis of athletics.
2. As Jamaica is the low-populated country, so there might be chances of less number of
participants in the Olympics from there or less awareness about all the games in training
& practices.
I. Present the closest competitor of the United States accordance of the medal category.
Showing the answer.
Solution: The nearest competitor of the United States in Gold & Silver category is Soviet Union
with 440 & 357 medals. And for the Bronze category, the Germany country has near medals
received of 349.
J. Distribution of most even number of all 3 categories of medals of 3 countries. Show the
working.
Solution: The most evenly distributed medals of least range are as follows:
1. Gold category in between Australia (147), Sweden (147) & Hungary (175).
2. Silver collection in between Australia (163), China (165) & Hungary (147).
3. Bronze classification in between China (151), Hungary (169) & Sweden (179).
PART-3
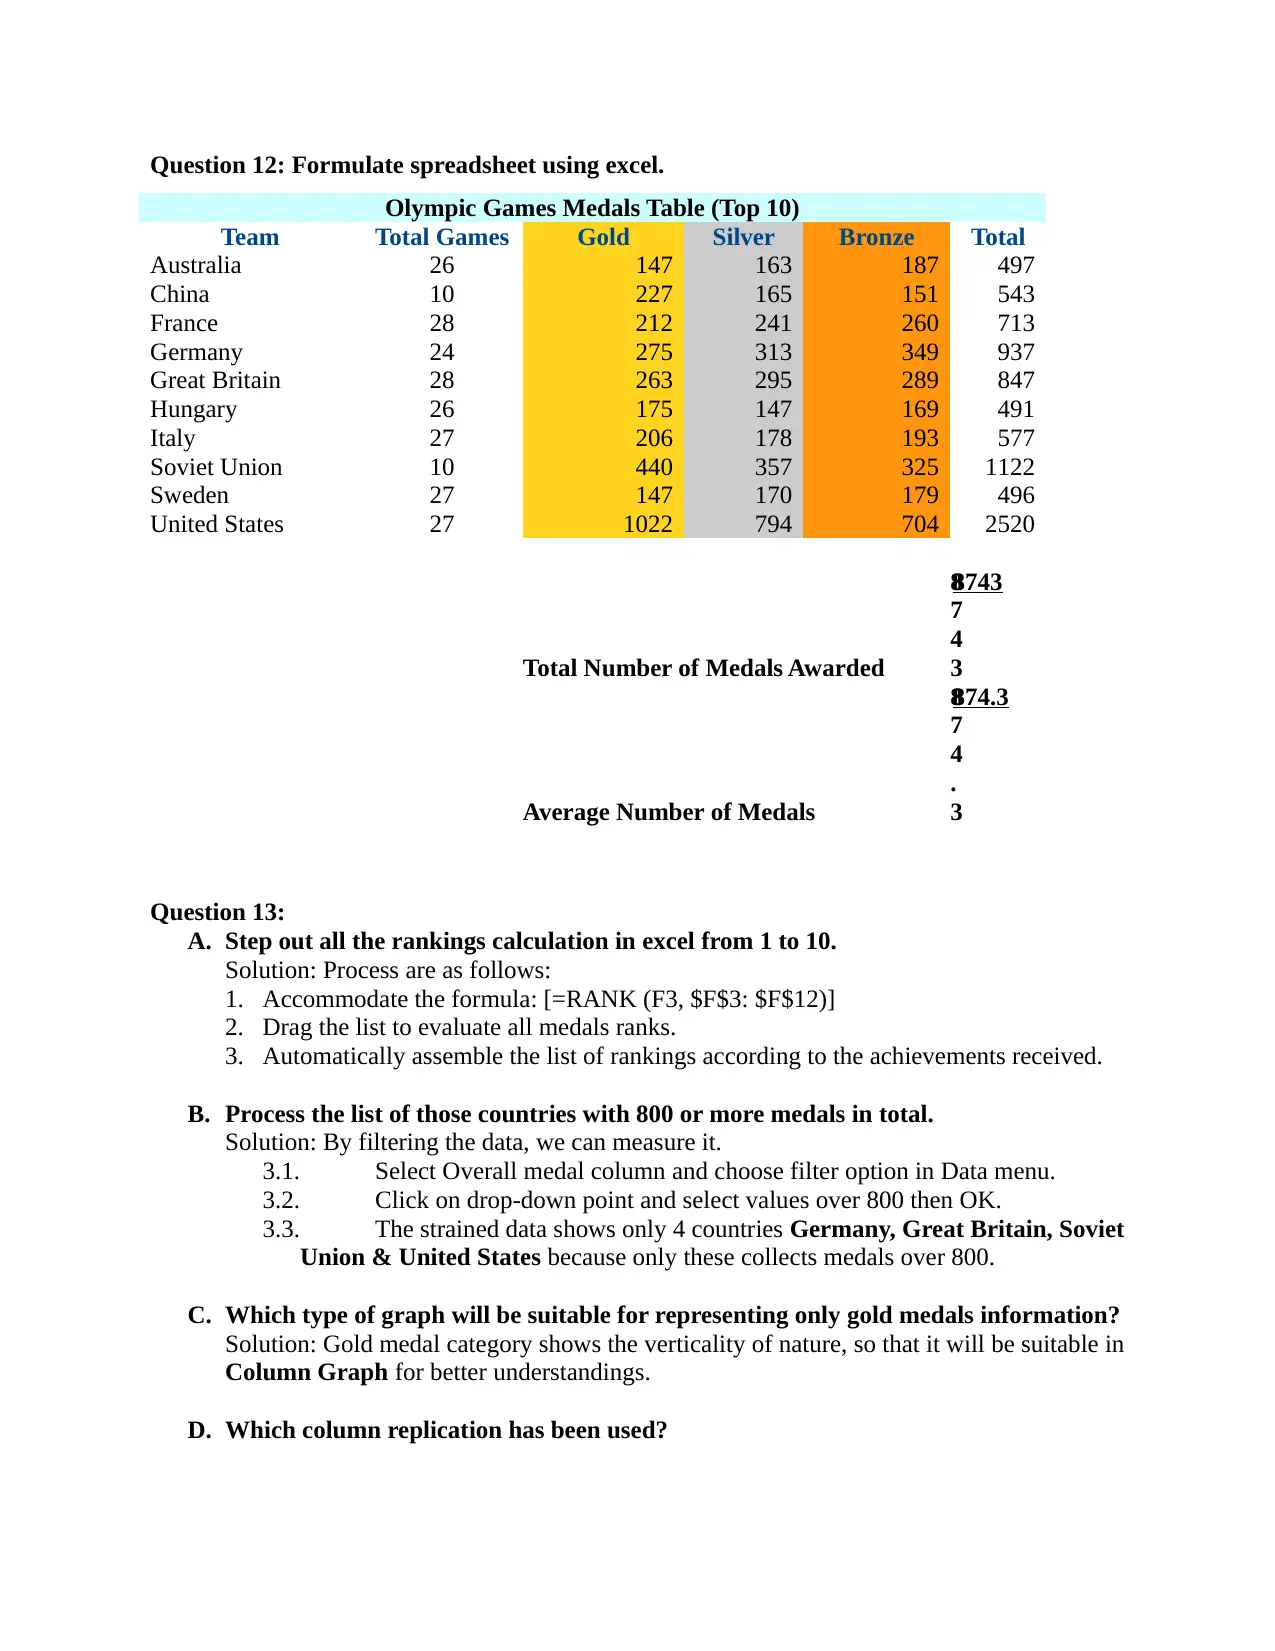
Question 12: Formulate spreadsheet using excel.
Olympic Games Medals Table (Top 10)
Team Total Games Gold Silver Bronze Total
Australia 26 147 163 187 497
China 10 227 165 151 543
France 28 212 241 260 713
Germany 24 275 313 349 937
Great Britain 28 263 295 289 847
Hungary 26 175 147 169 491
Italy 27 206 178 193 577
Soviet Union 10 440 357 325 1122
Sweden 27 147 170 179 496
United States 27 1022 794 704 2520
Total Number of Medals Awarded
8
7
4
3
8743
Average Number of Medals
8
7
4
.
3
874.3
Question 13:
A. Step out all the rankings calculation in excel from 1 to 10.
Solution: Process are as follows:
1. Accommodate the formula: [=RANK (F3, $F$3: $F$12)]
2. Drag the list to evaluate all medals ranks.
3. Automatically assemble the list of rankings according to the achievements received.
B. Process the list of those countries with 800 or more medals in total.
Solution: By filtering the data, we can measure it.
3.1. Select Overall medal column and choose filter option in Data menu.
3.2. Click on drop-down point and select values over 800 then OK.
3.3. The strained data shows only 4 countries Germany, Great Britain, Soviet
Union & United States because only these collects medals over 800.
C. Which type of graph will be suitable for representing only gold medals information?
Solution: Gold medal category shows the verticality of nature, so that it will be suitable in
Column Graph for better understandings.
D. Which column replication has been used?
⊘ This is a preview!⊘
Do you want full access?
Subscribe today to unlock all pages.
Trusted by 1+ million students worldwide
Solution: Replicate action has been taken to perform the conditions or situation with
given information. The ‘Team’ and ‘Total’ column has been used.
E. What formula has used to calculate the overall total medals awarded?
Solution: [=SUM (F3:F12)]
Question 14: Execute excel functions:
A. Present the total medals of both Germany & Great Britain countries.
Solution:
3.3.1. Using Sum Formula: [=SUM(F6+F7)]
3.3.2. For Germany & Great Britain, total medals are [937 + 847 = 1784.]
B. Represents the average number of silver category for European countries.
Solution:
1. Firstly, finding out European countries (France, Germany, Hungary, Italy,
Sweden).
2. Formula: [=AVERAGE (D5, D6, D8, D9, D11)]
3. Silver medals (Averaging) = [(241+313+147+178+170) / 5] = 209.8
C. With less than 20 games involvement countries, sum up the total of gold category
medals.
Solution:
1. The conditioning of less than 20 games involving with total of gold category.
2. Function using: [=SUMIF (B3:B12, “<20”, C3:C12)]
3. Only 2 countries (China & Soviet Union) involves in less than 20 games category.
4. The total of both countries is (227 + 440 = 667).
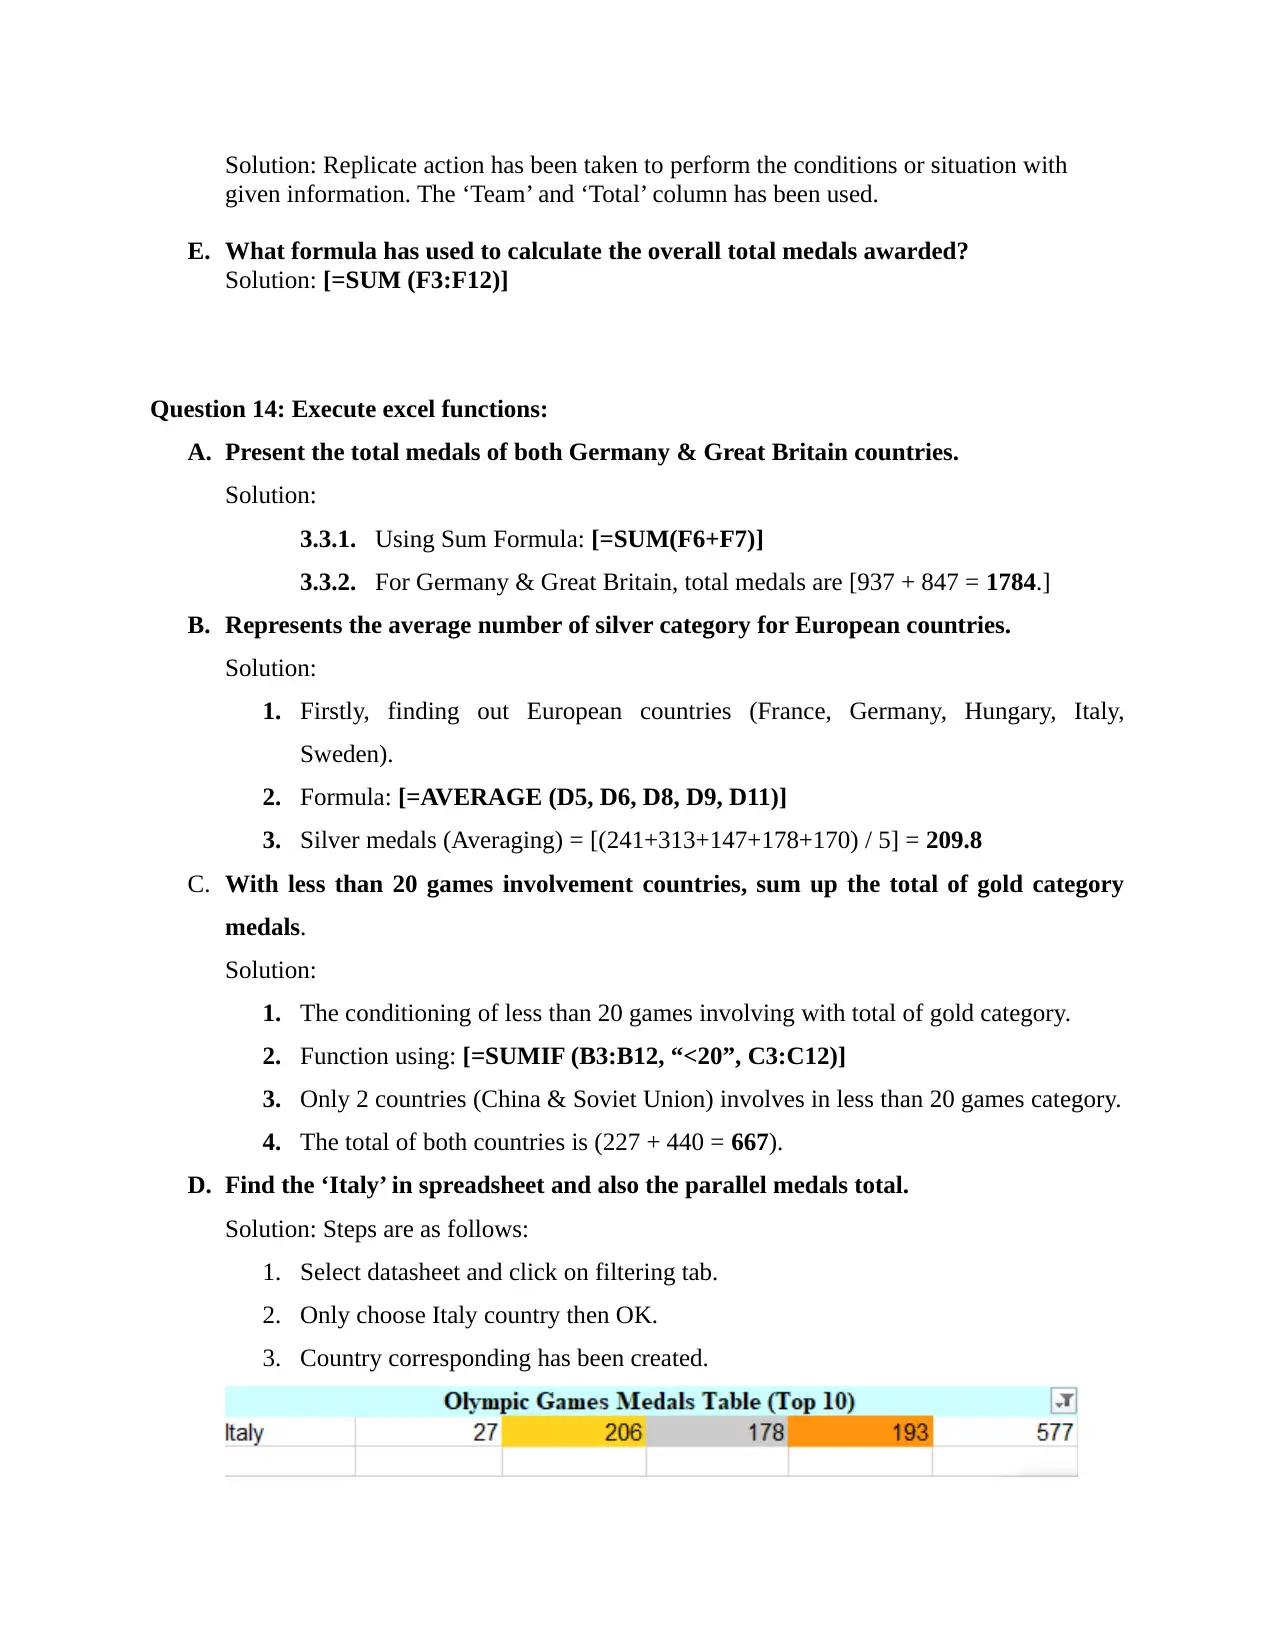
D. Find the ‘Italy’ in spreadsheet and also the parallel medals total.
Solution: Steps are as follows:
1. Select datasheet and click on filtering tab.
2. Only choose Italy country then OK.
3. Country corresponding has been created.
given information. The ‘Team’ and ‘Total’ column has been used.
E. What formula has used to calculate the overall total medals awarded?
Solution: [=SUM (F3:F12)]
Question 14: Execute excel functions:
A. Present the total medals of both Germany & Great Britain countries.
Solution:
3.3.1. Using Sum Formula: [=SUM(F6+F7)]
3.3.2. For Germany & Great Britain, total medals are [937 + 847 = 1784.]
B. Represents the average number of silver category for European countries.
Solution:
1. Firstly, finding out European countries (France, Germany, Hungary, Italy,
Sweden).
2. Formula: [=AVERAGE (D5, D6, D8, D9, D11)]
3. Silver medals (Averaging) = [(241+313+147+178+170) / 5] = 209.8
C. With less than 20 games involvement countries, sum up the total of gold category
medals.
Solution:
1. The conditioning of less than 20 games involving with total of gold category.
2. Function using: [=SUMIF (B3:B12, “<20”, C3:C12)]
3. Only 2 countries (China & Soviet Union) involves in less than 20 games category.
4. The total of both countries is (227 + 440 = 667).
D. Find the ‘Italy’ in spreadsheet and also the parallel medals total.
Solution: Steps are as follows:
1. Select datasheet and click on filtering tab.
2. Only choose Italy country then OK.
3. Country corresponding has been created.
Paraphrase This Document
Need a fresh take? Get an instant paraphrase of this document with our AI Paraphraser
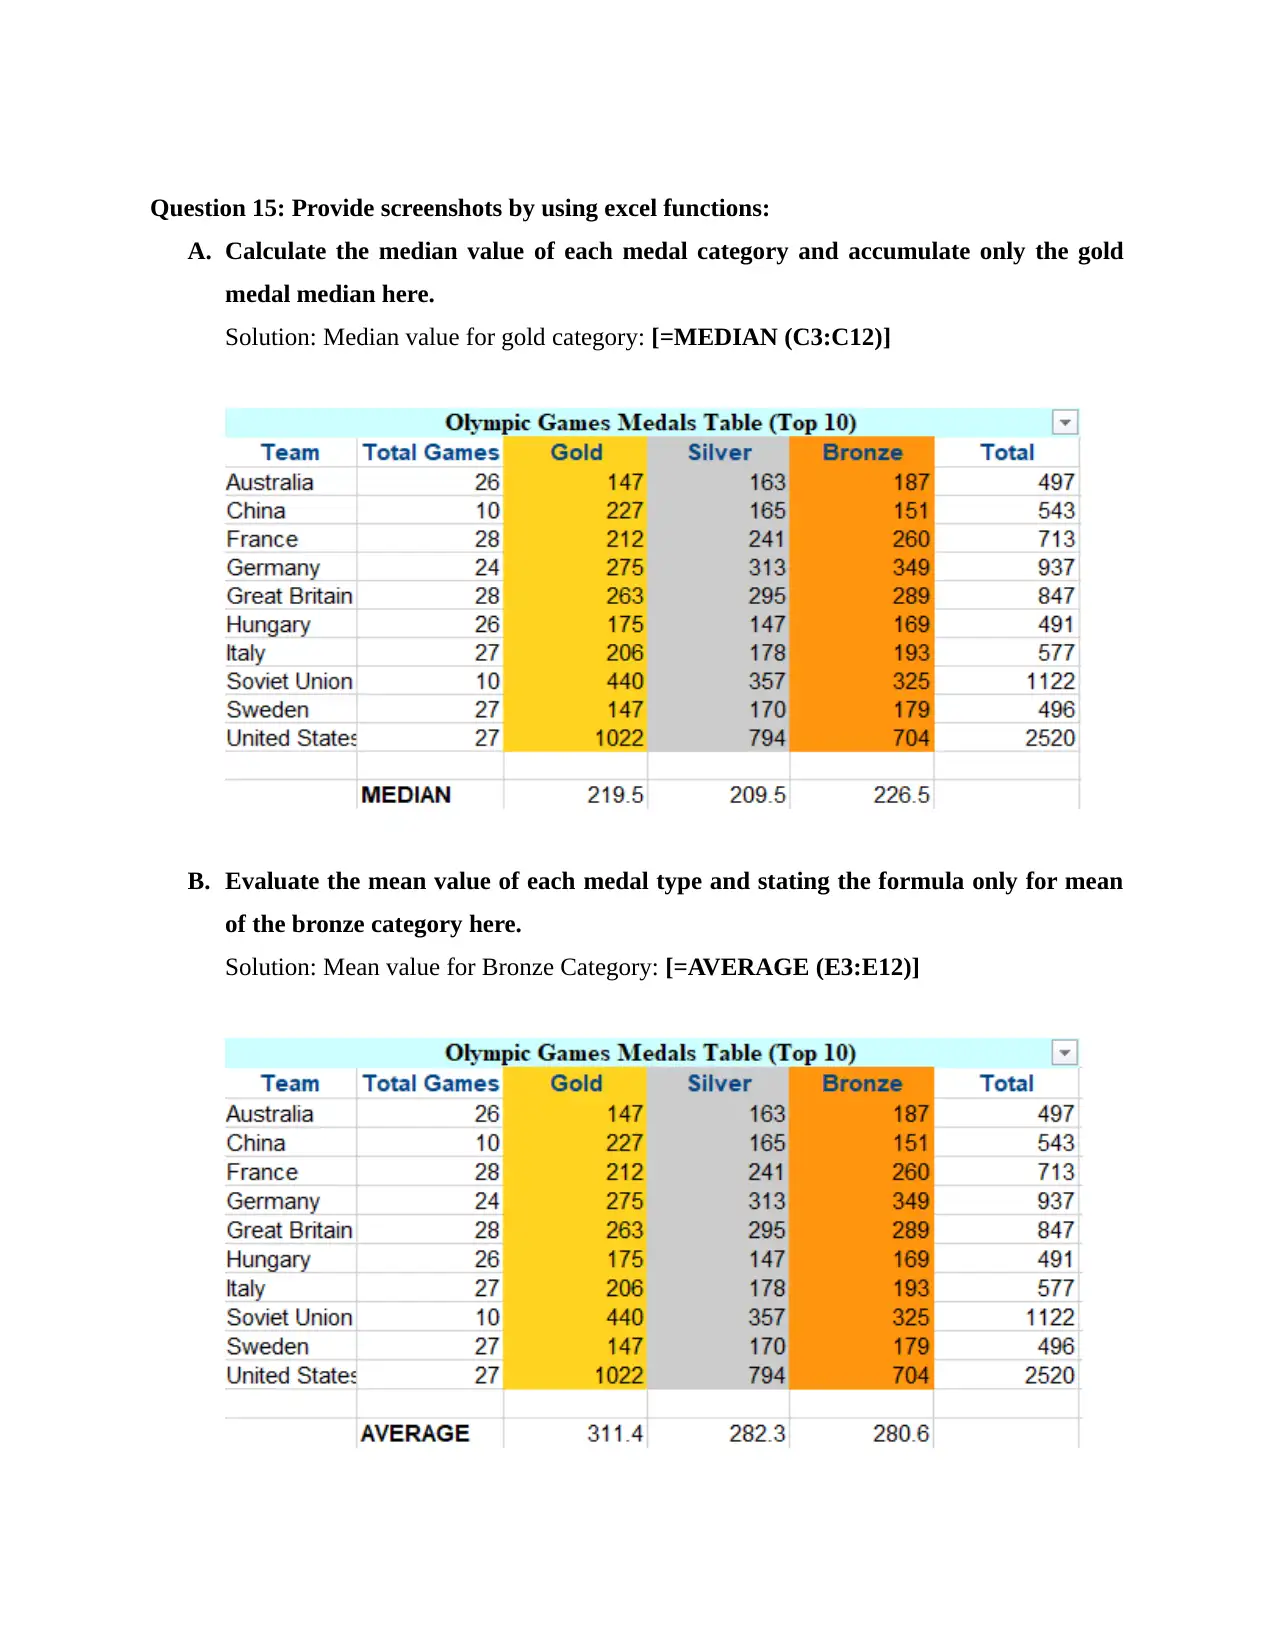
Question 15: Provide screenshots by using excel functions:
A. Calculate the median value of each medal category and accumulate only the gold
medal median here.
Solution: Median value for gold category: [=MEDIAN (C3:C12)]
B. Evaluate the mean value of each medal type and stating the formula only for mean
of the bronze category here.
Solution: Mean value for Bronze Category: [=AVERAGE (E3:E12)]
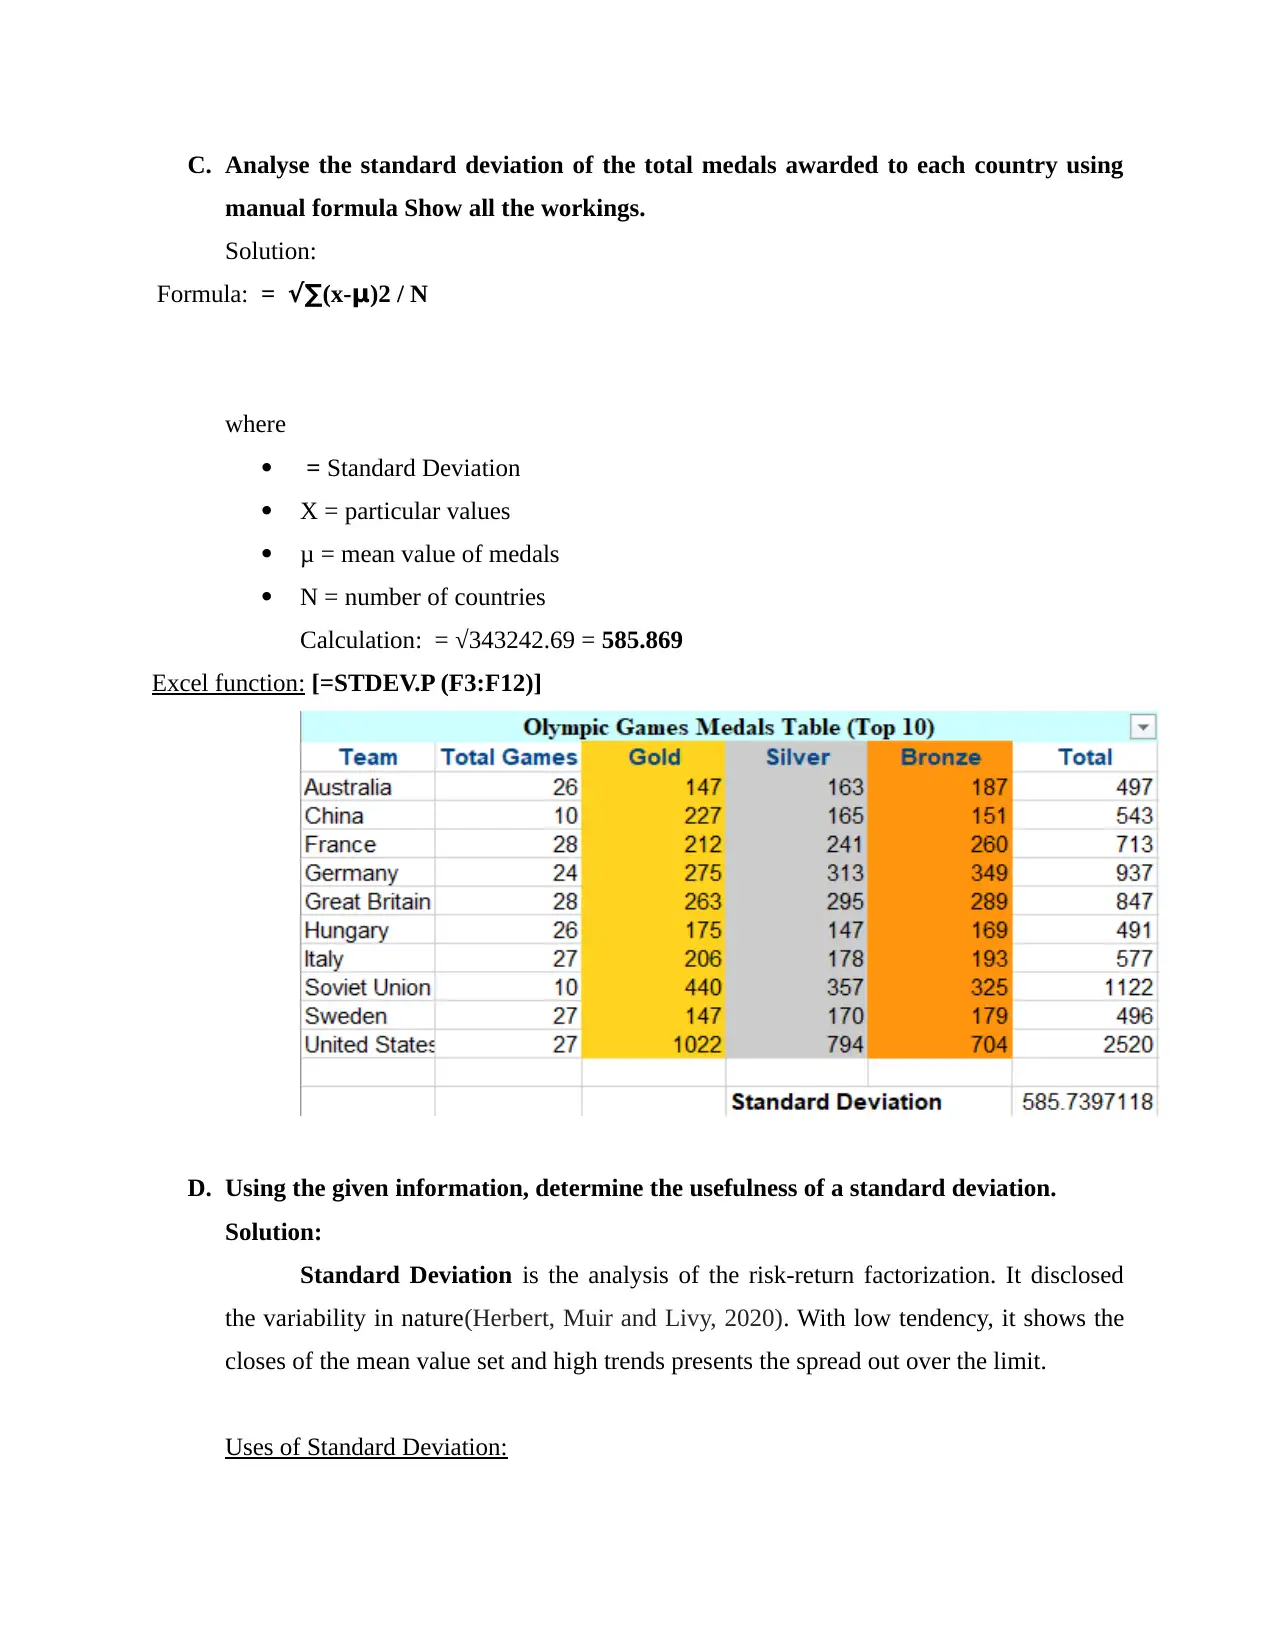
C. Analyse the standard deviation of the total medals awarded to each country using
manual formula Show all the workings.
Solution:
Formula: = √∑(x-μ)2 / N
where
= Standard Deviation
X = particular values
μ = mean value of medals
N = number of countries
Calculation: = √343242.69 = 585.869
Excel function: [=STDEV.P (F3:F12)]
D. Using the given information, determine the usefulness of a standard deviation.
Solution:
Standard Deviation is the analysis of the risk-return factorization. It disclosed
the variability in nature(Herbert, Muir and Livy, 2020). With low tendency, it shows the
closes of the mean value set and high trends presents the spread out over the limit.
Uses of Standard Deviation:
⊘ This is a preview!⊘
Do you want full access?
Subscribe today to unlock all pages.
Trusted by 1+ million students worldwide
1 out of 15
Related Documents


Your All-in-One AI-Powered Toolkit for Academic Success.
+13062052269
info@desklib.com
Available 24*7 on WhatsApp / Email
![[object Object]](/_next/static/media/star-bottom.7253800d.svg)
Unlock your academic potential
Copyright © 2020–2026 A2Z Services. All Rights Reserved. Developed and managed by ZUCOL.