Numeracy and Data Analysis: Leeds Wind Speed Report and Forecast
VerifiedAdded on 2021/02/22
|11
|1684
|250
Report
AI Summary
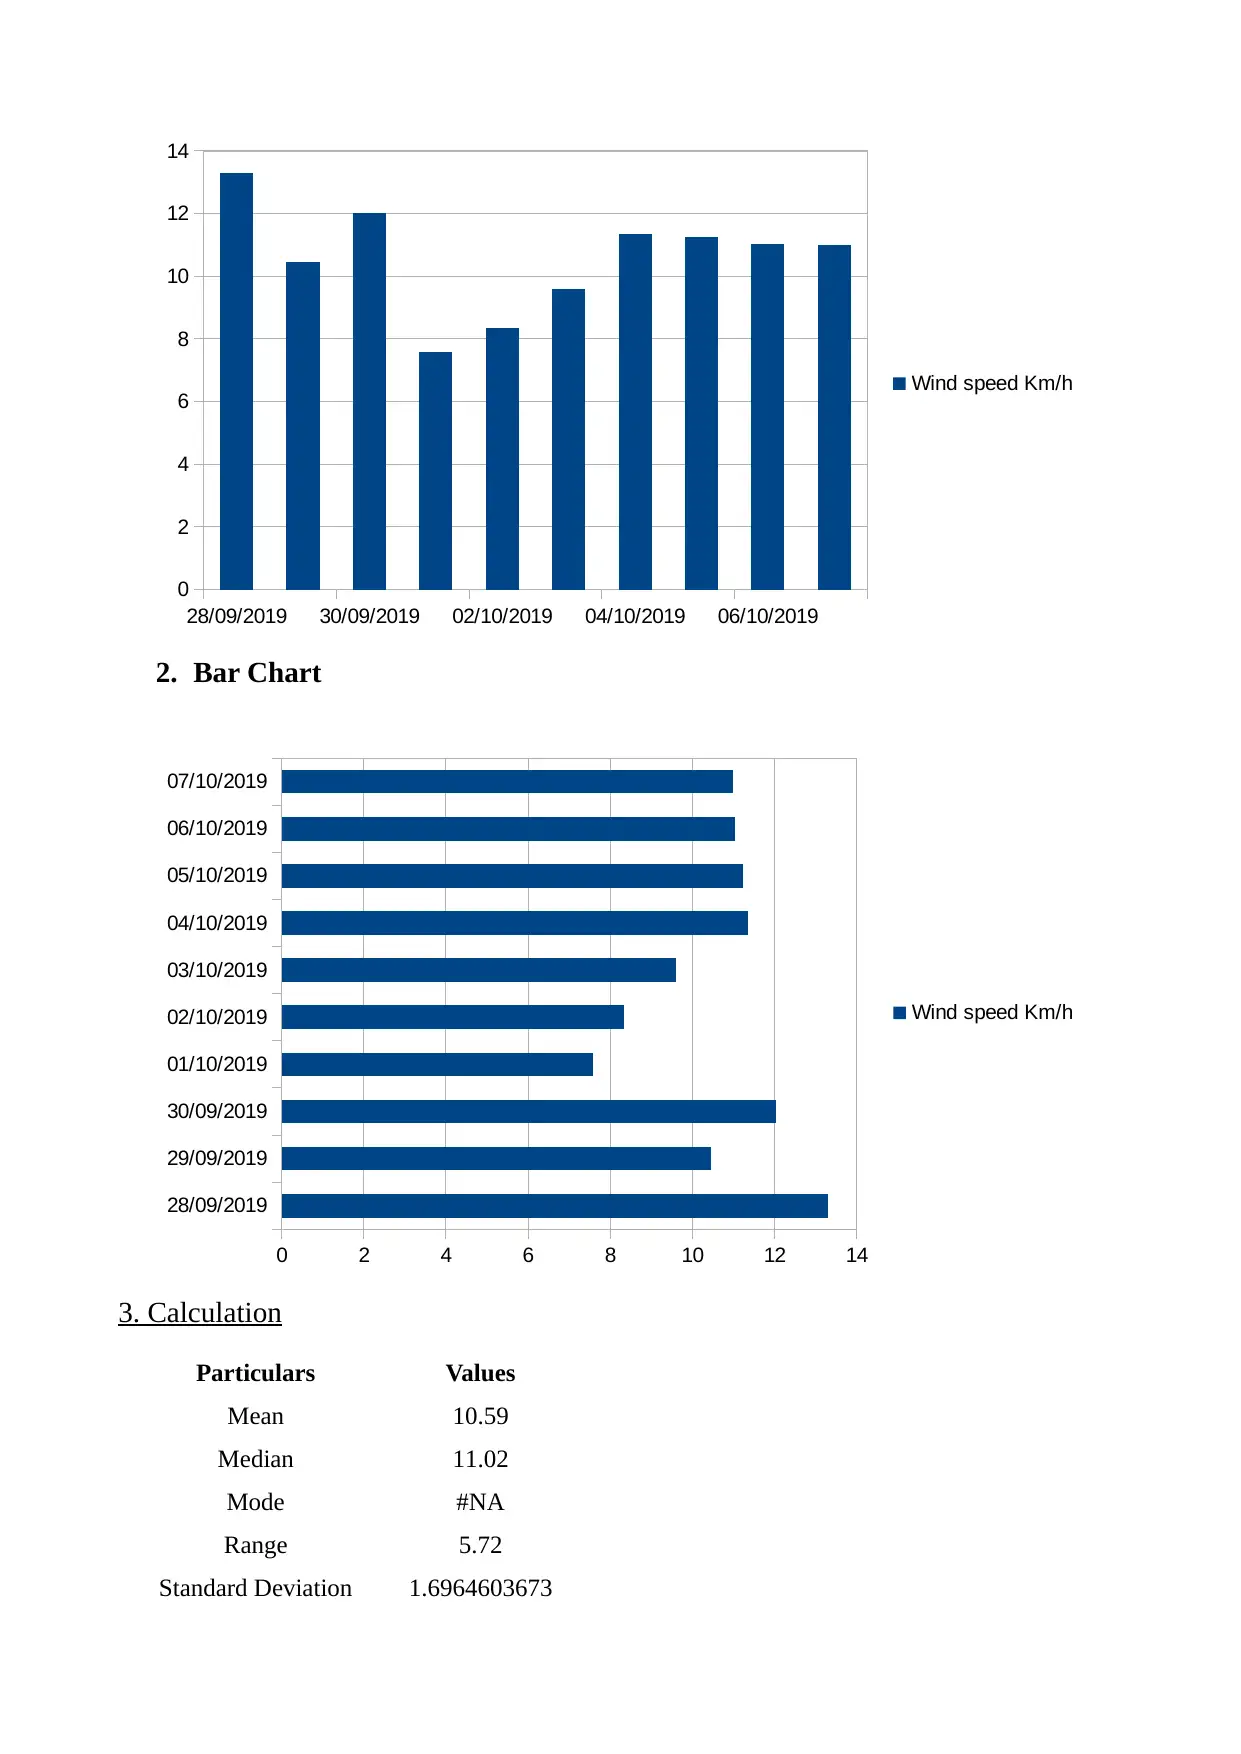
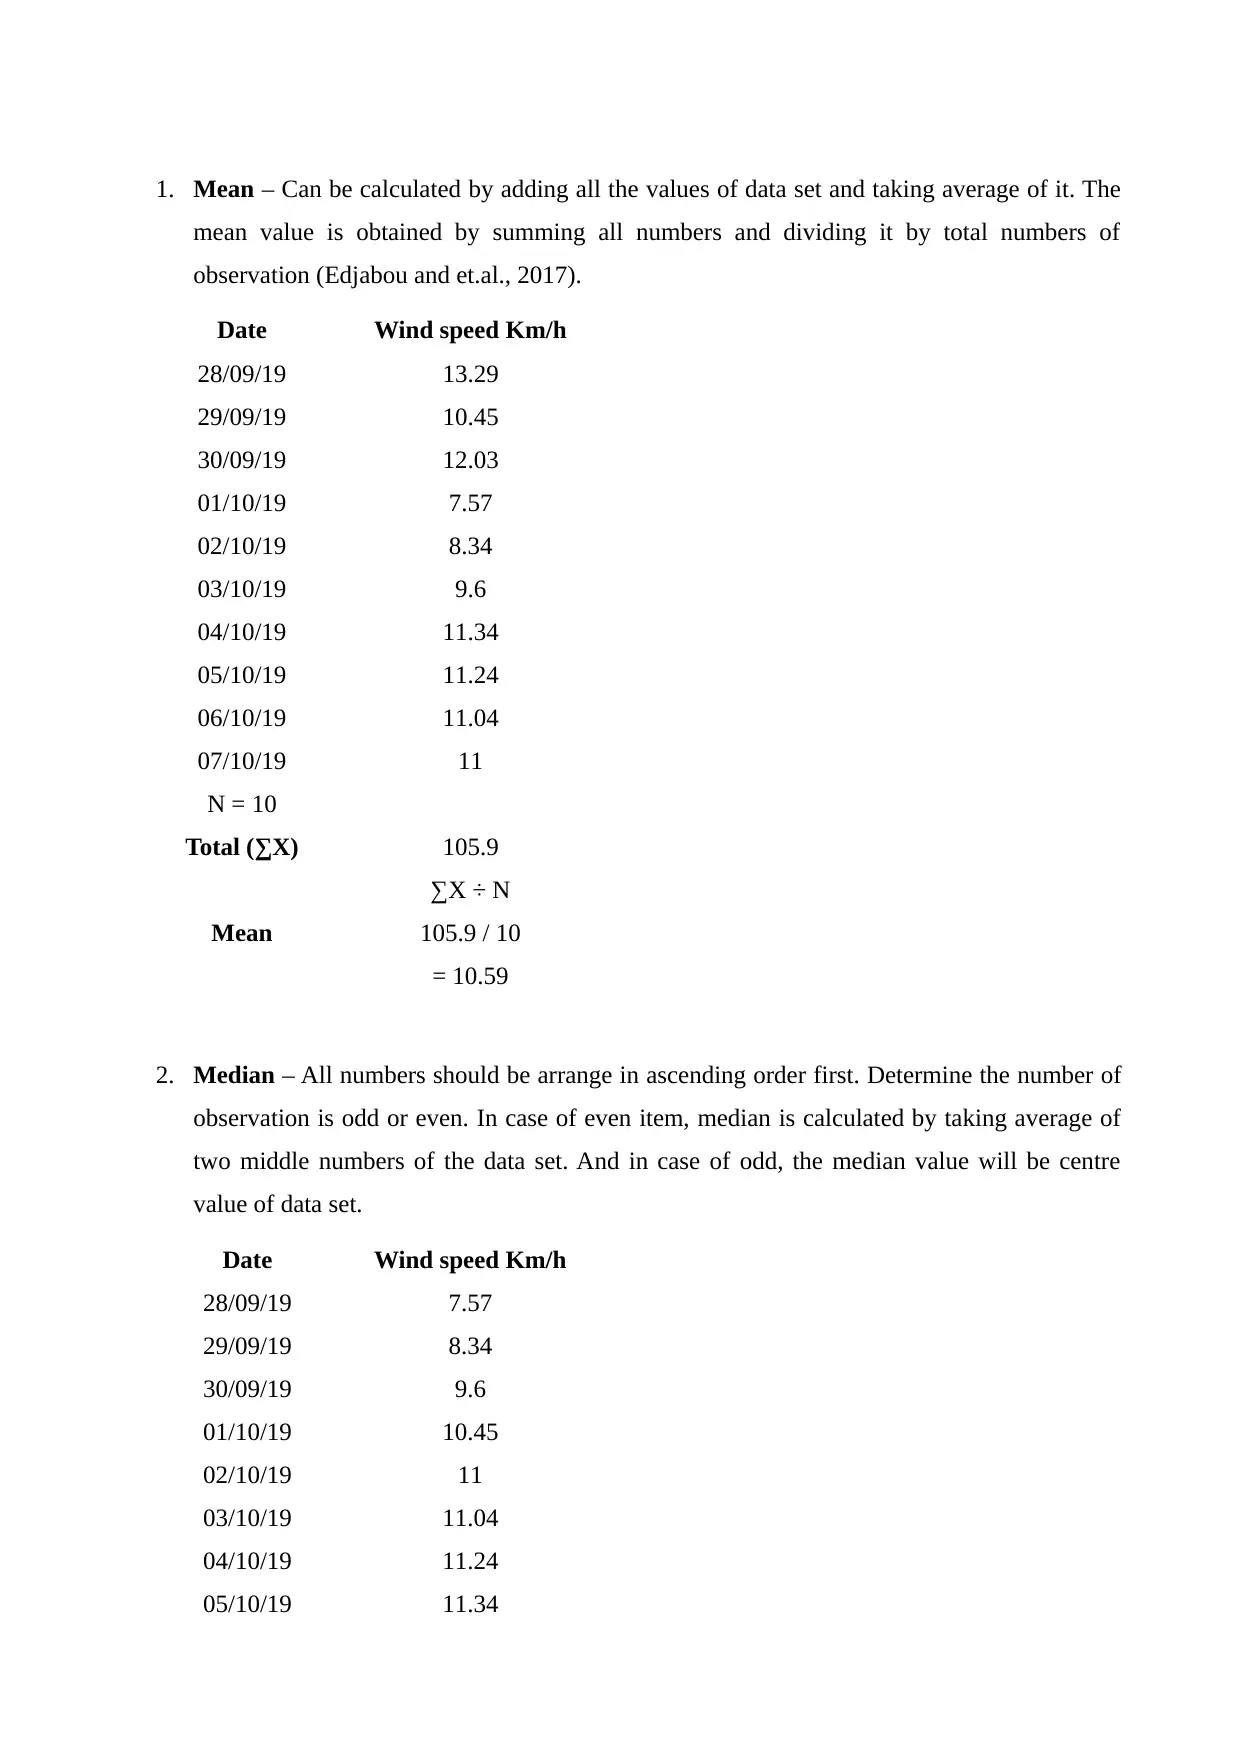
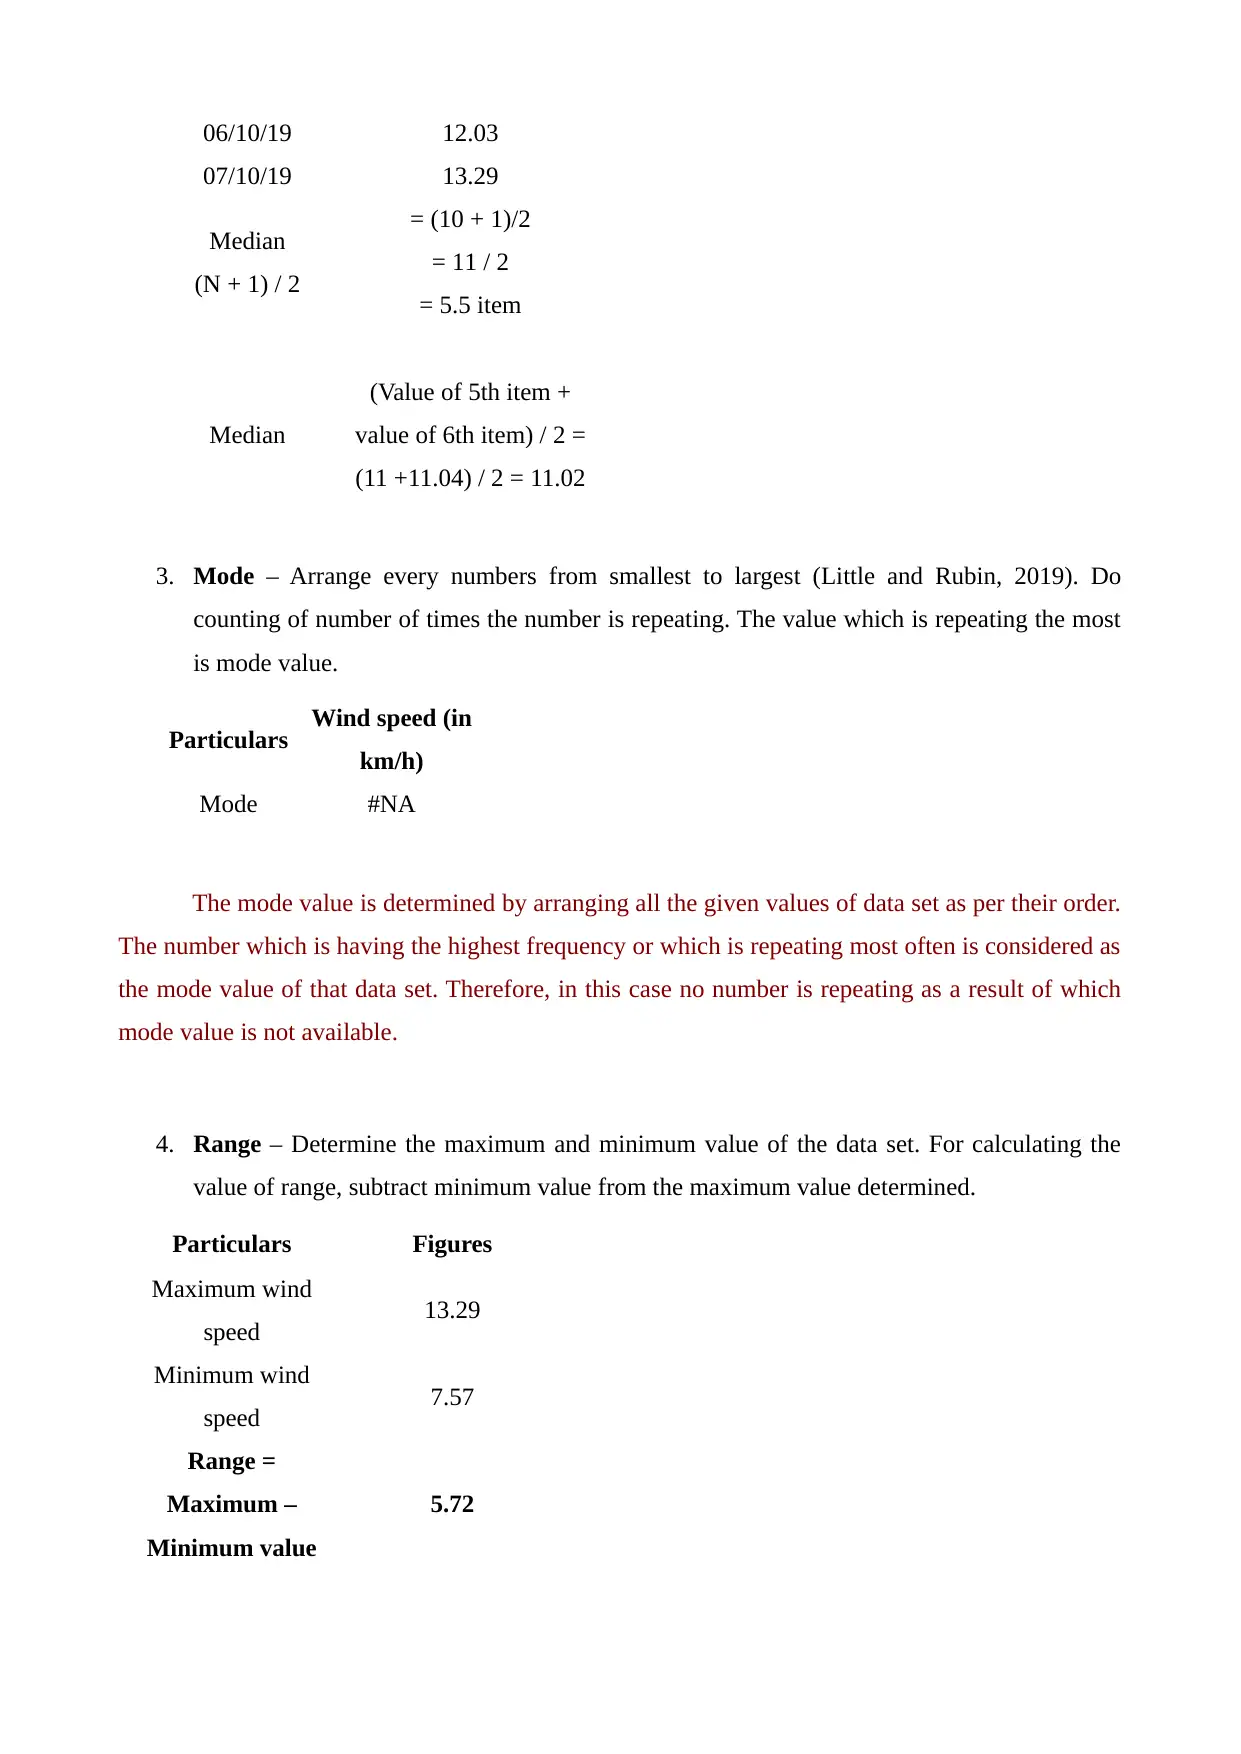
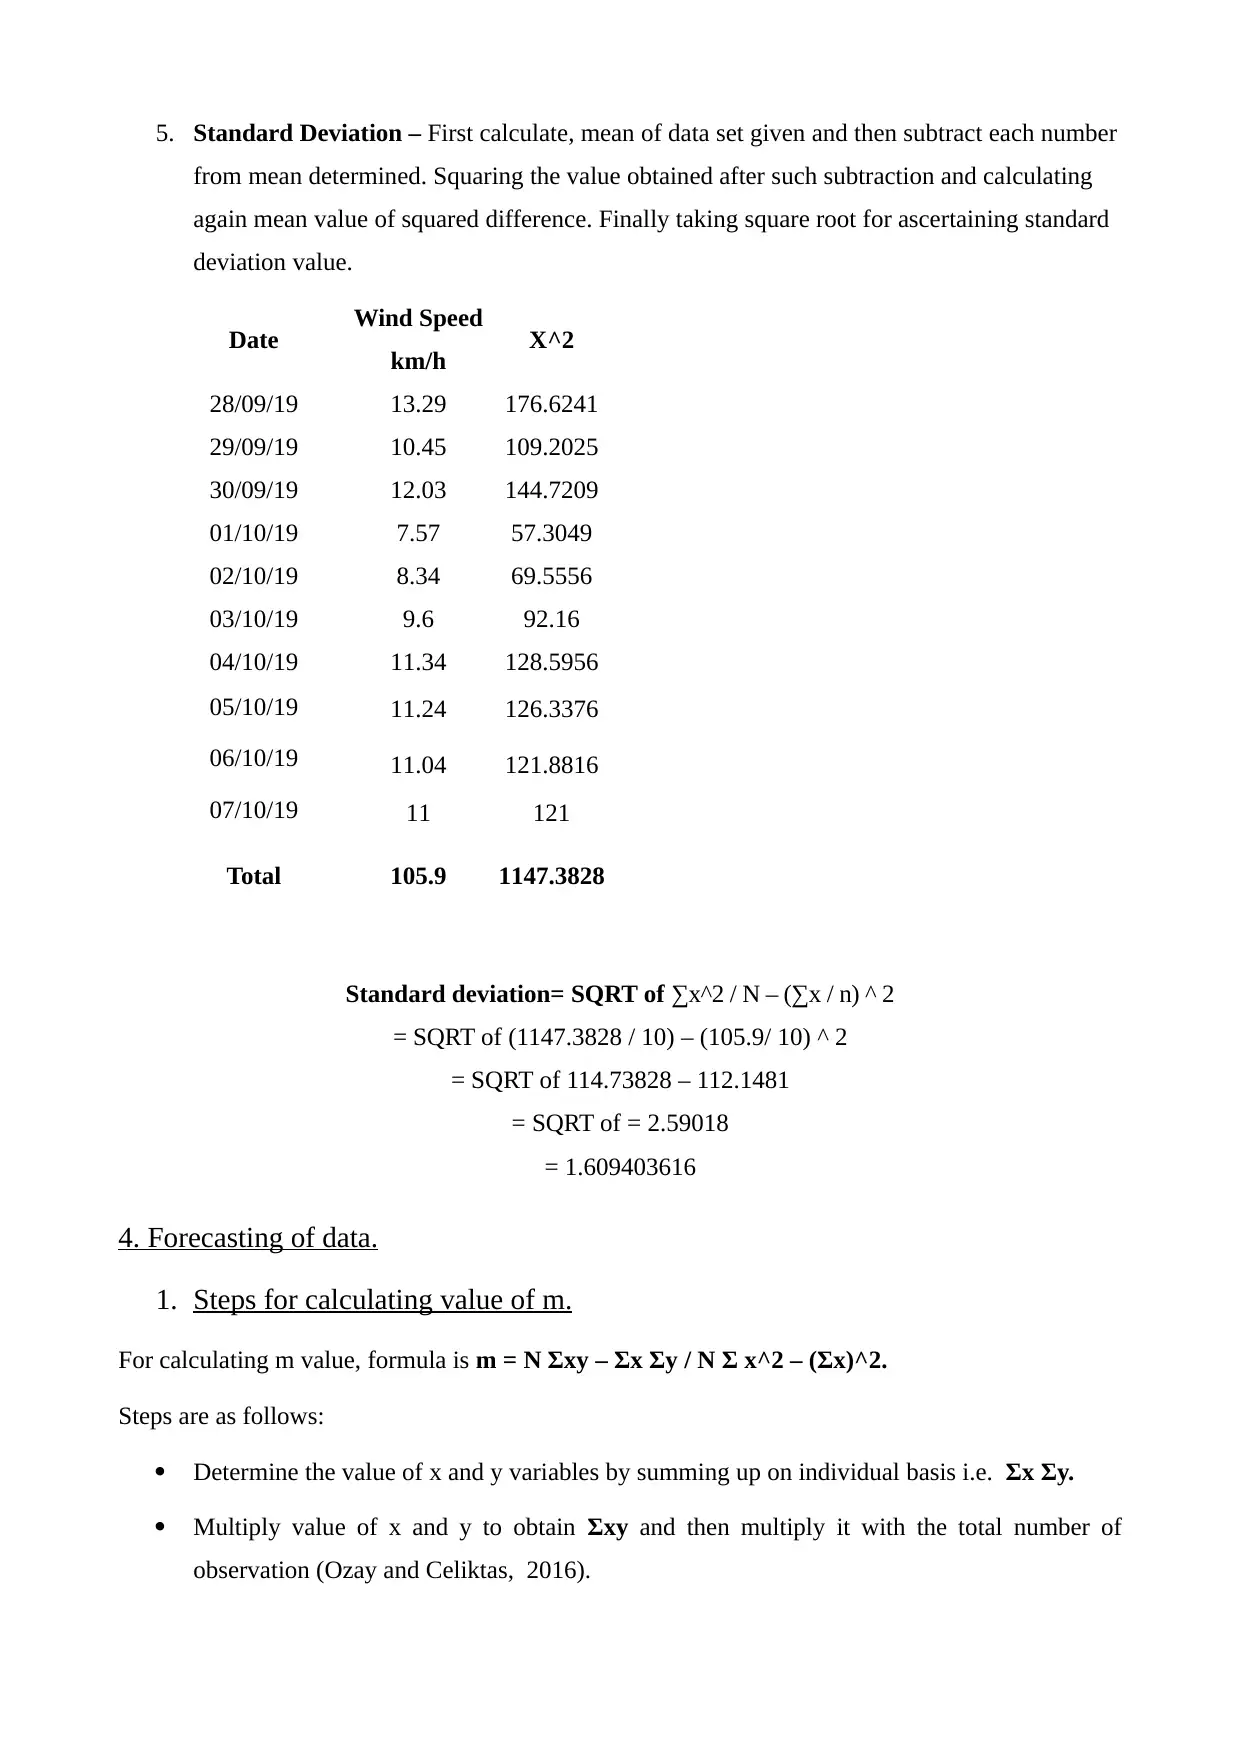
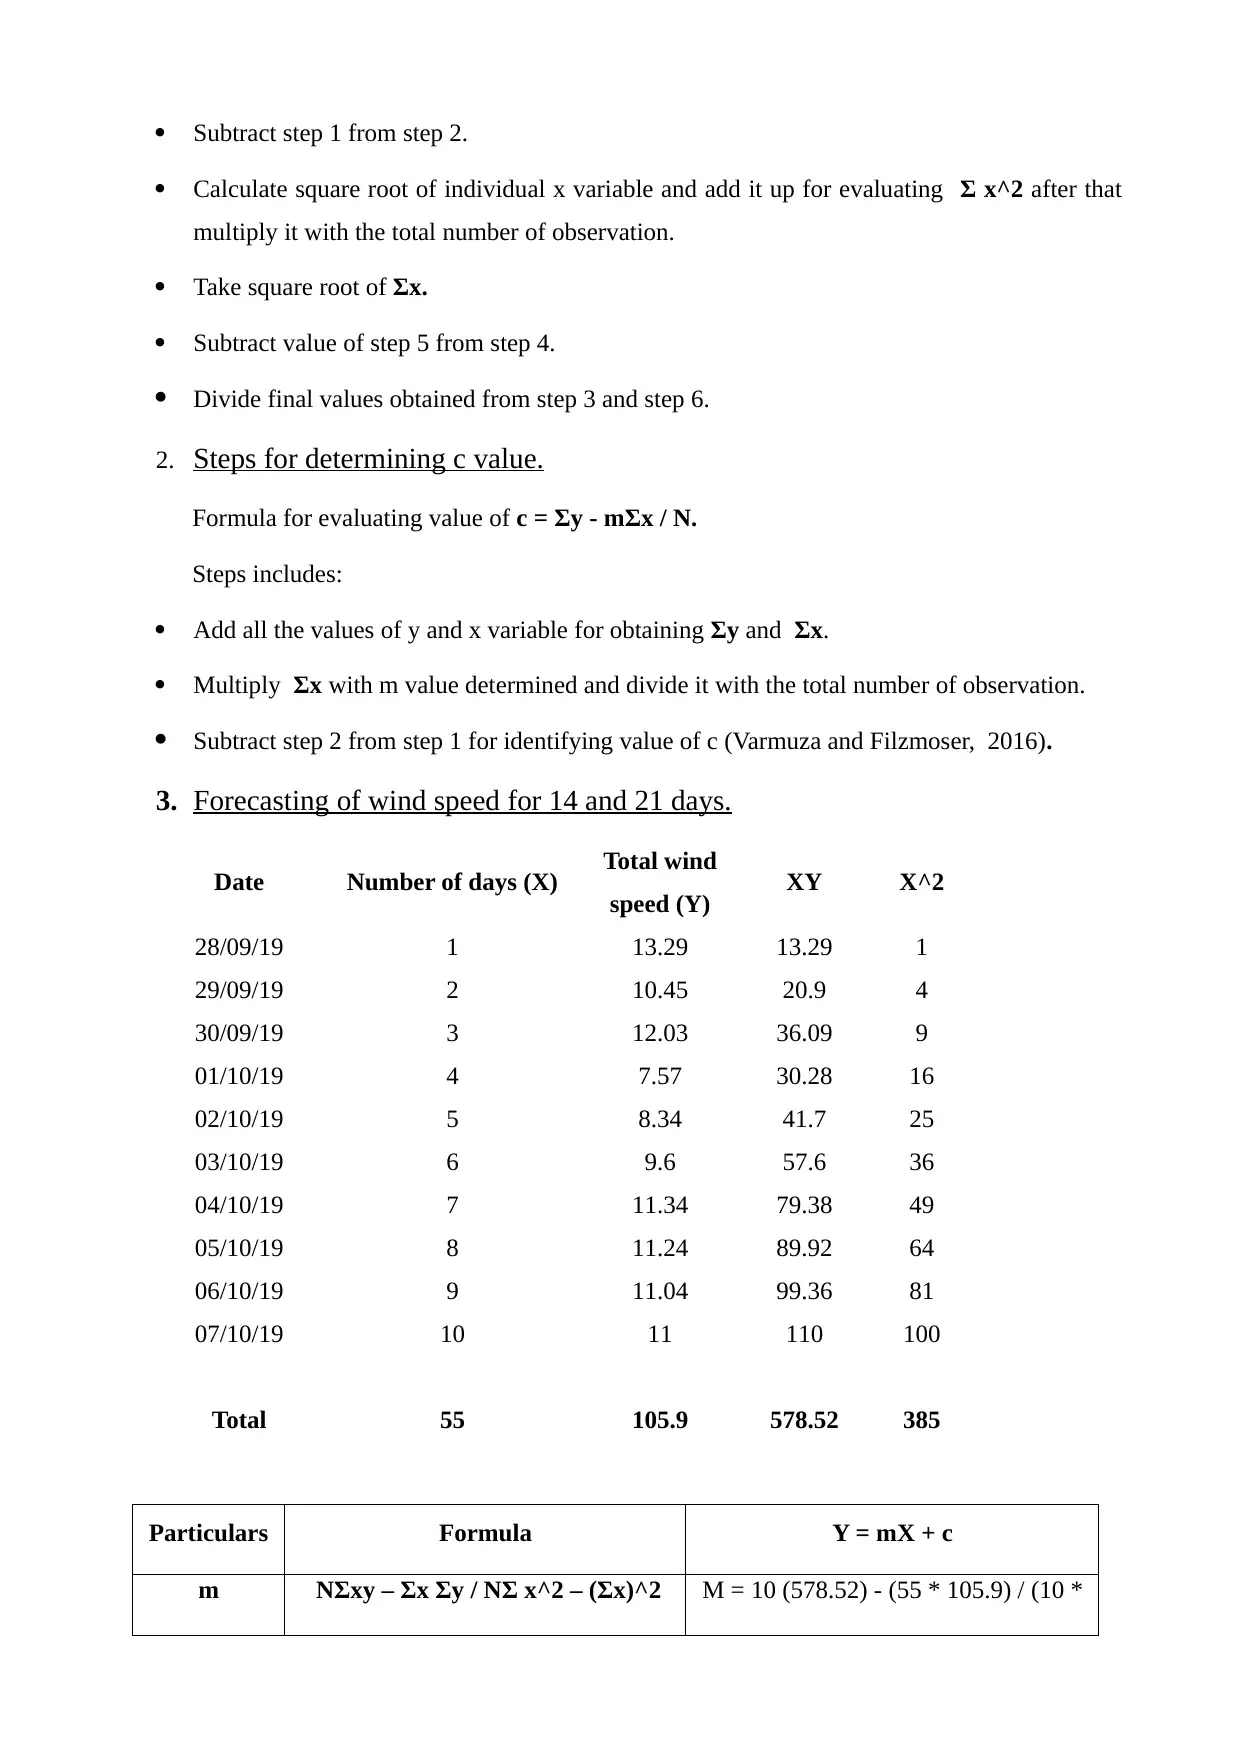
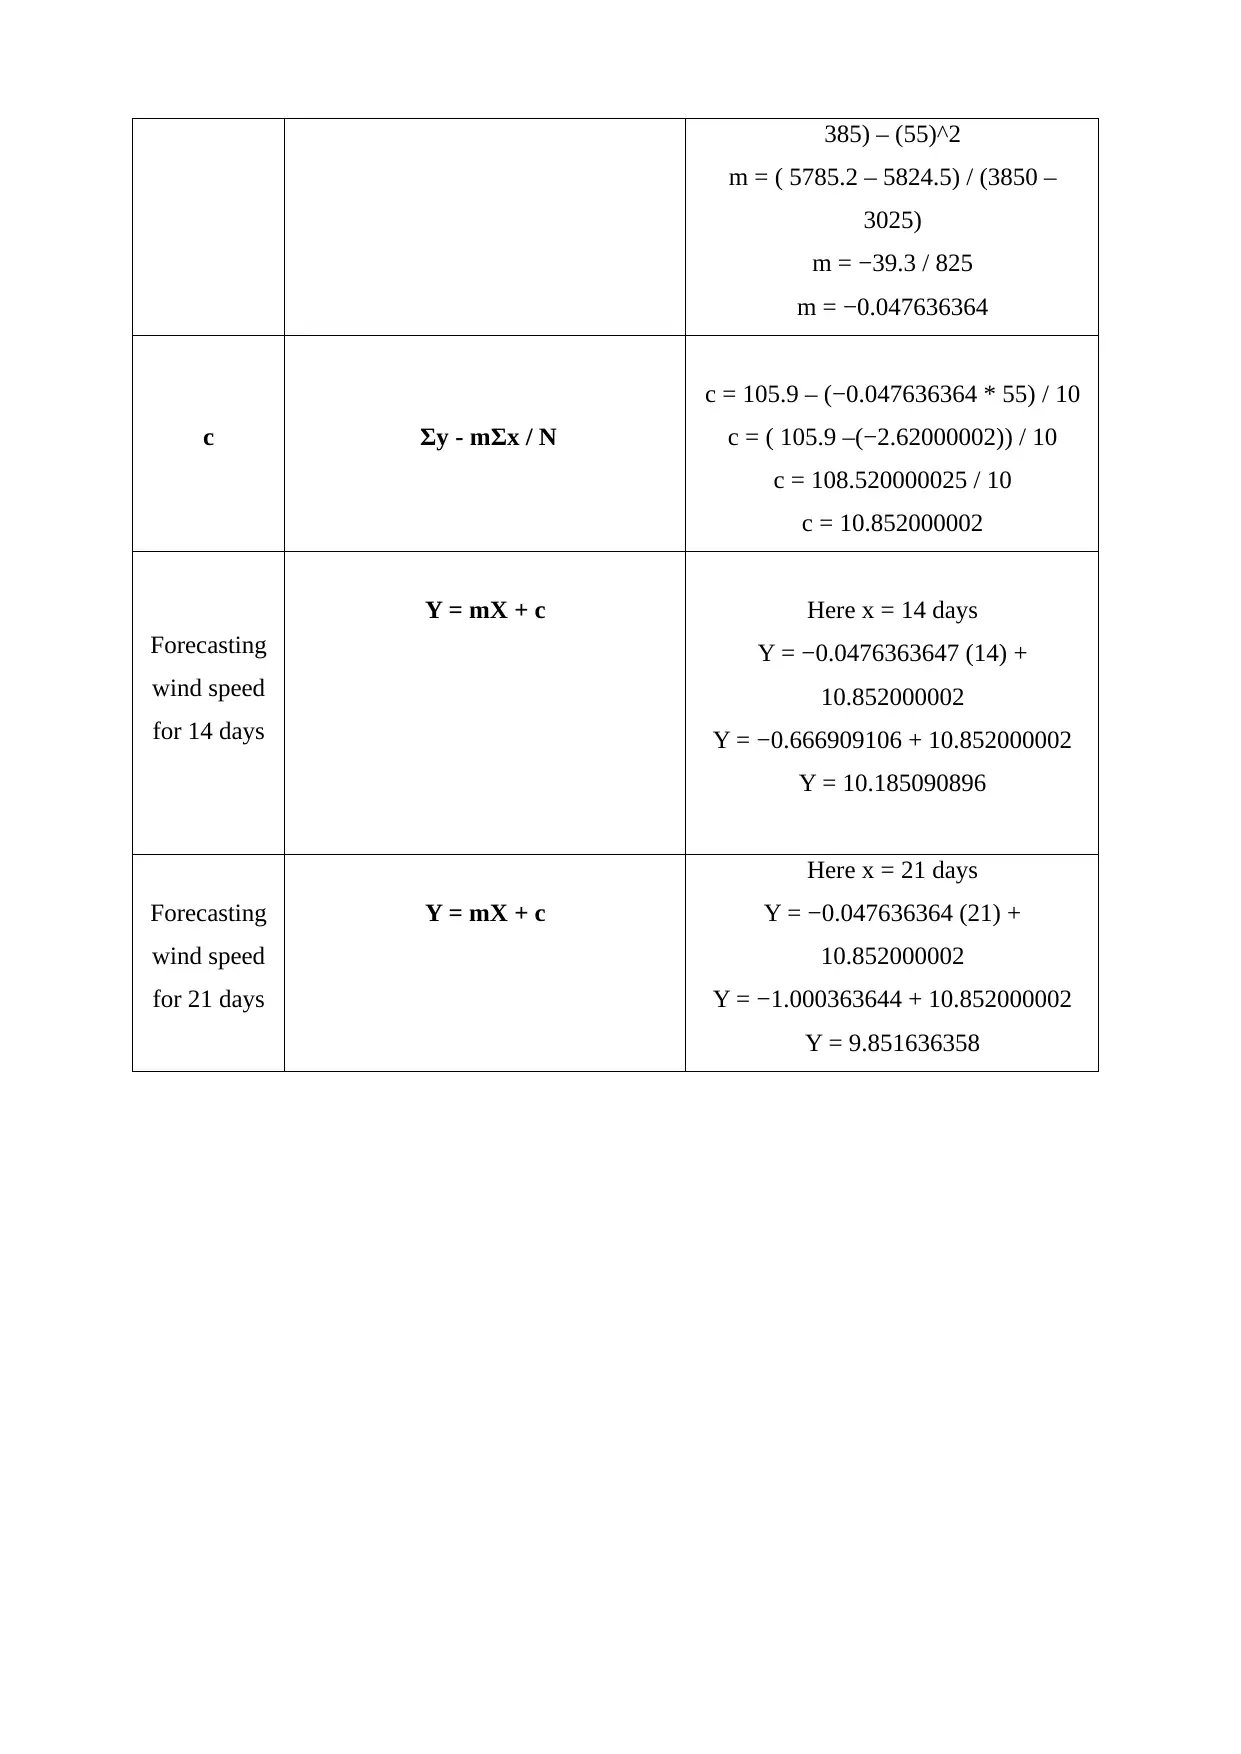
This report presents a data analysis of wind speed in Leeds, United Kingdom, over a ten-day period. The analysis begins with the arrangement of the dataset in a table format, followed by data presentation using column and bar charts. Key calculations, including mean, median, mode, range, and standard deviation, are performed to understand the central tendencies and variability of the wind speed. The report further includes a forecasting component, predicting wind speeds for 14 and 21 days using linear regression. The methodology involves calculating the values of 'm' and 'c' to establish a forecasting model. The conclusion summarizes the fluctuating wind speed trends and the forecasted wind speeds, providing insights into the data's behavior over time. The report utilizes Excel for data handling and employs statistical methods for interpretation and prediction. The report is contributed by a student to be published on the website Desklib.

1 out of 11


Your All-in-One AI-Powered Toolkit for Academic Success.
+13062052269
info@desklib.com
Available 24*7 on WhatsApp / Email
![[object Object]](/_next/static/media/star-bottom.7253800d.svg)
Copyright © 2020–2026 A2Z Services. All Rights Reserved. Developed and managed by ZUCOL.