Numeracy & Data Analysis Report: Forecasting Humidity Trends
VerifiedAdded on 2023/06/05
|10
|1479
|136
Report
AI Summary
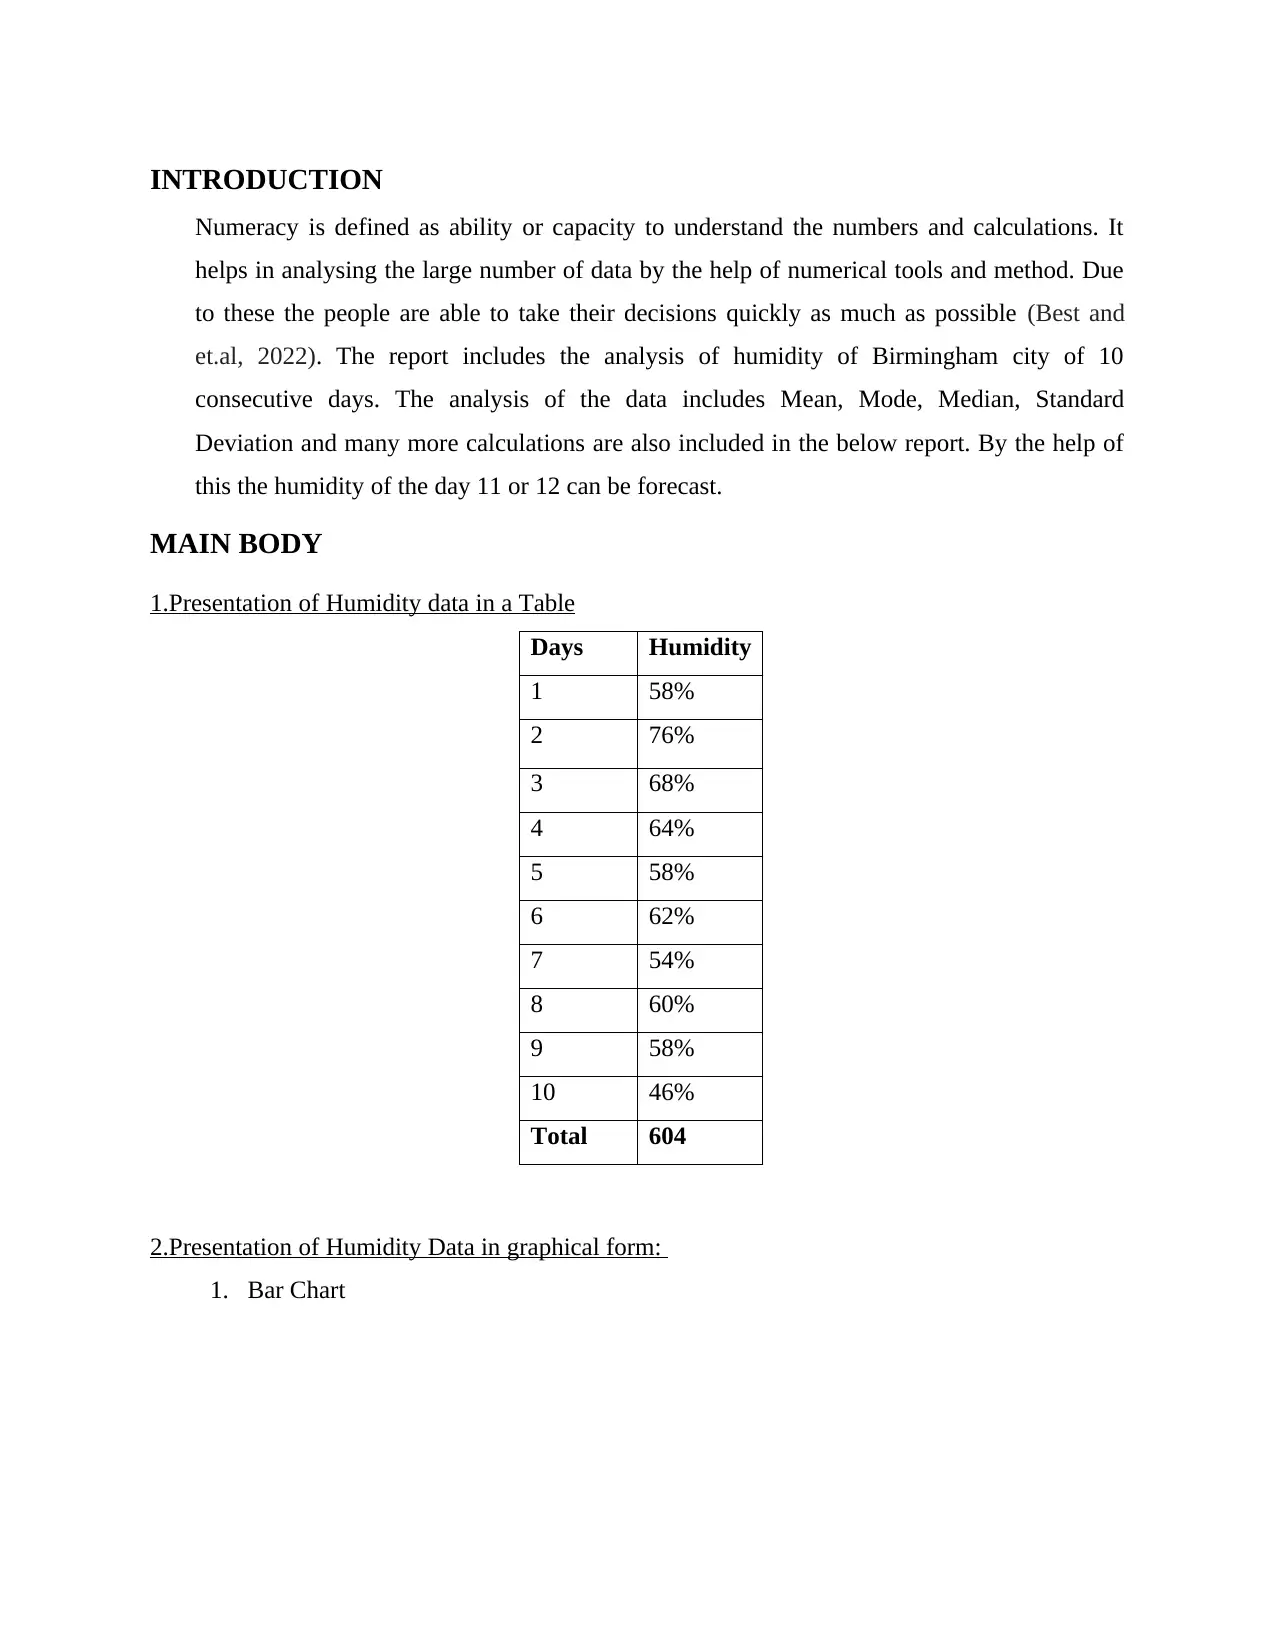
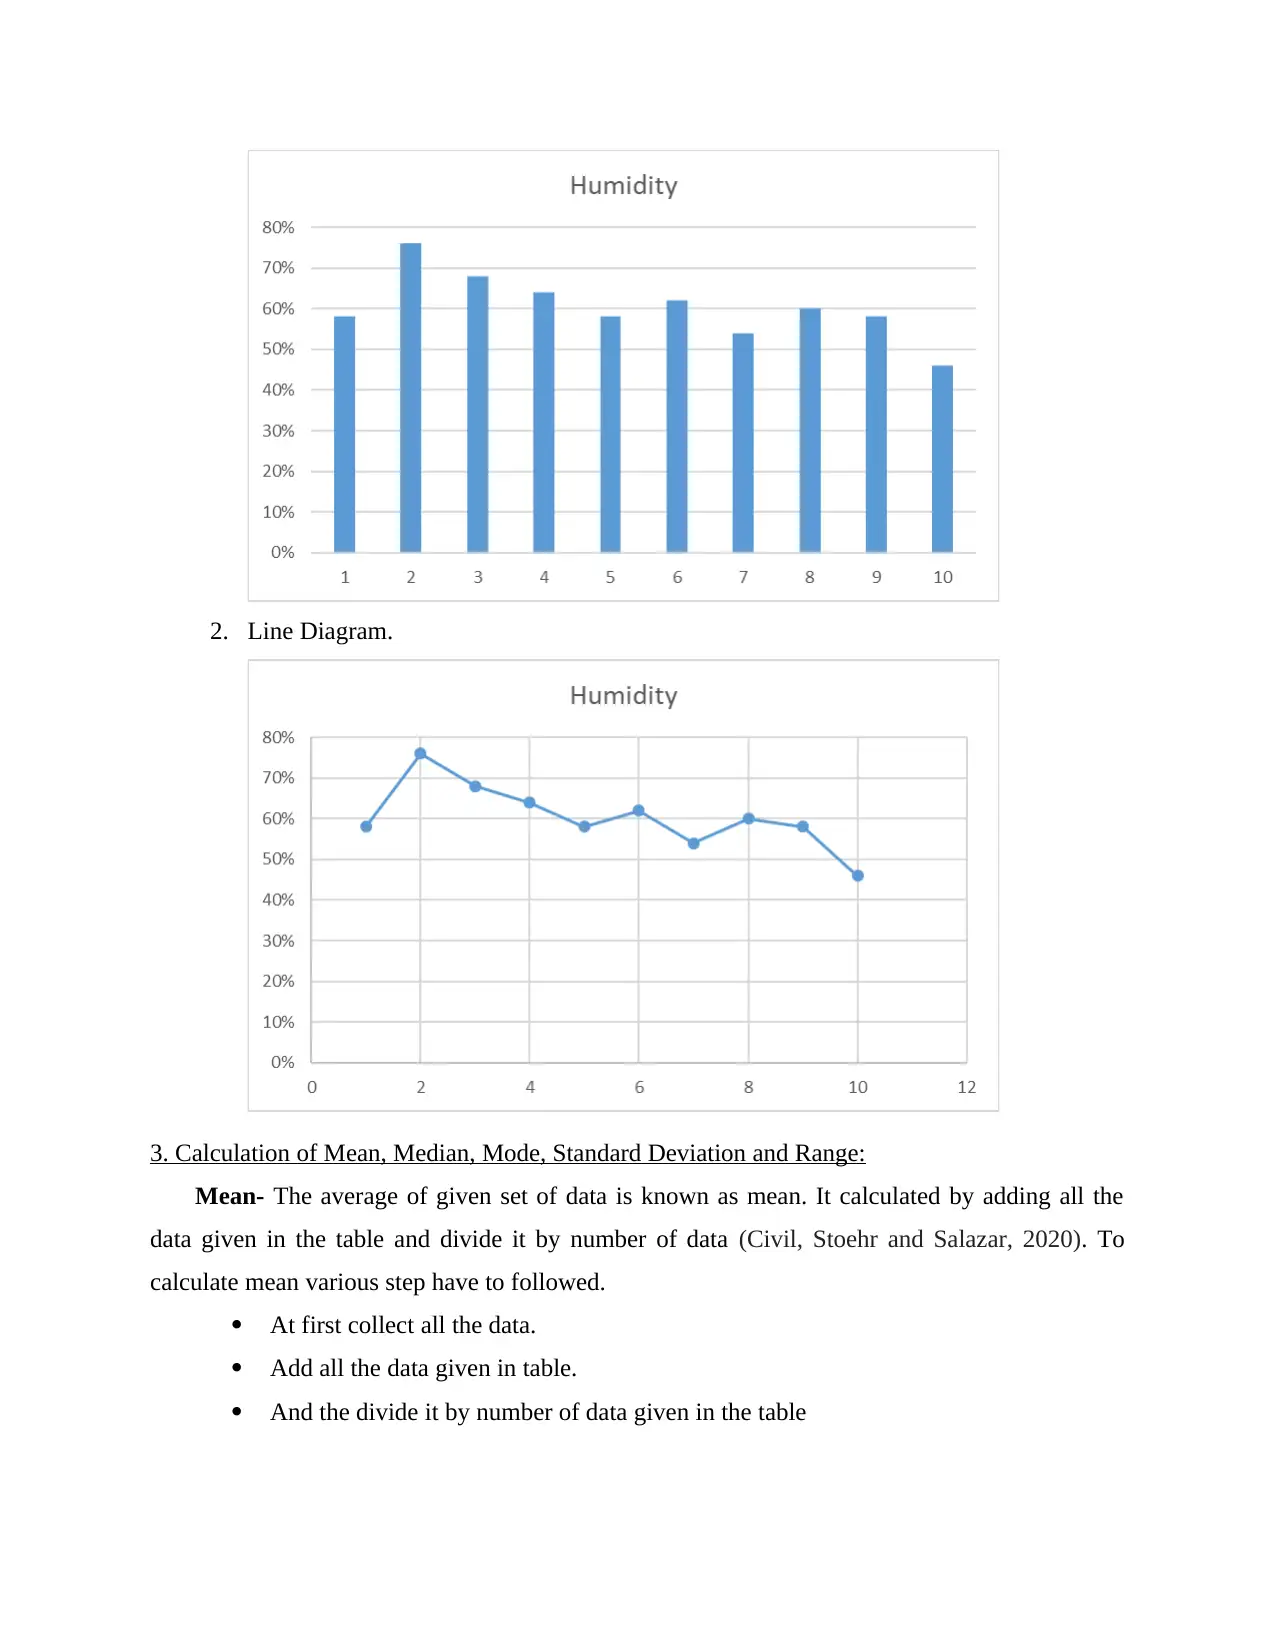
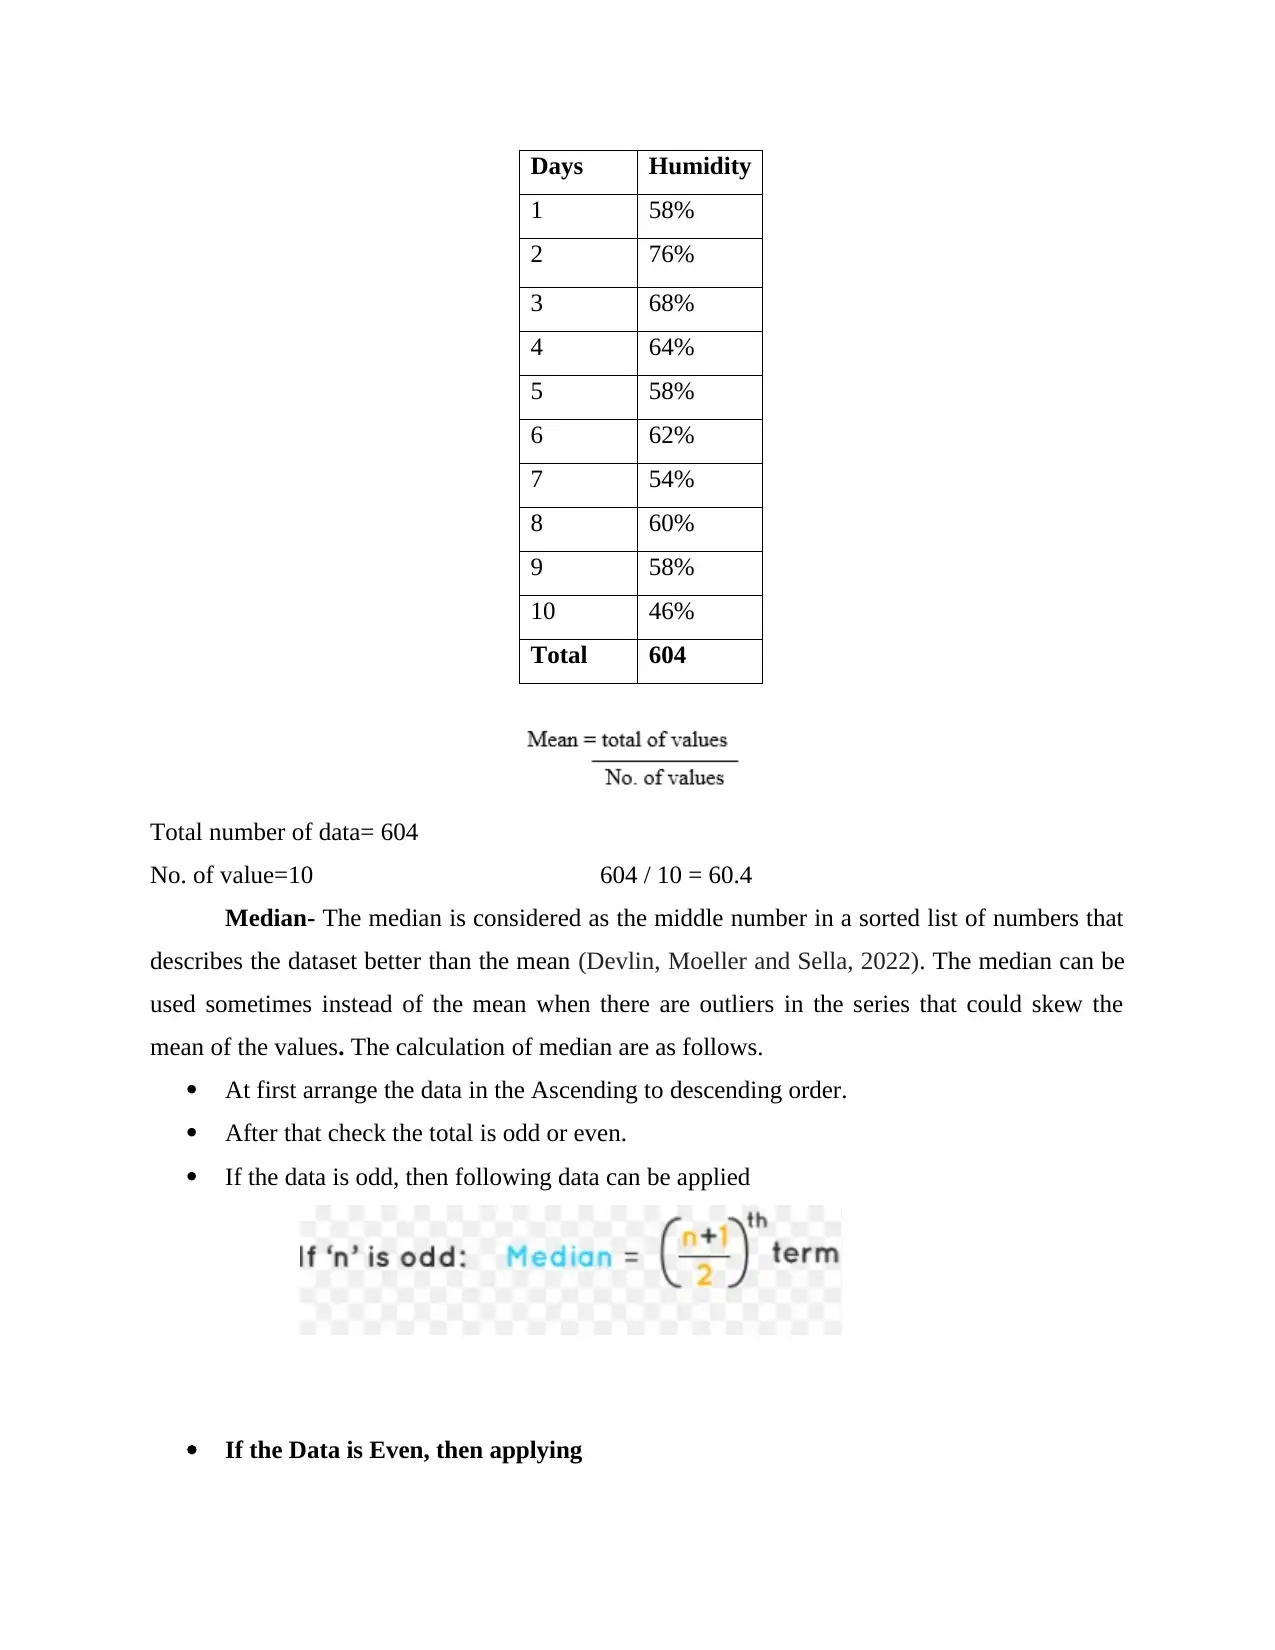
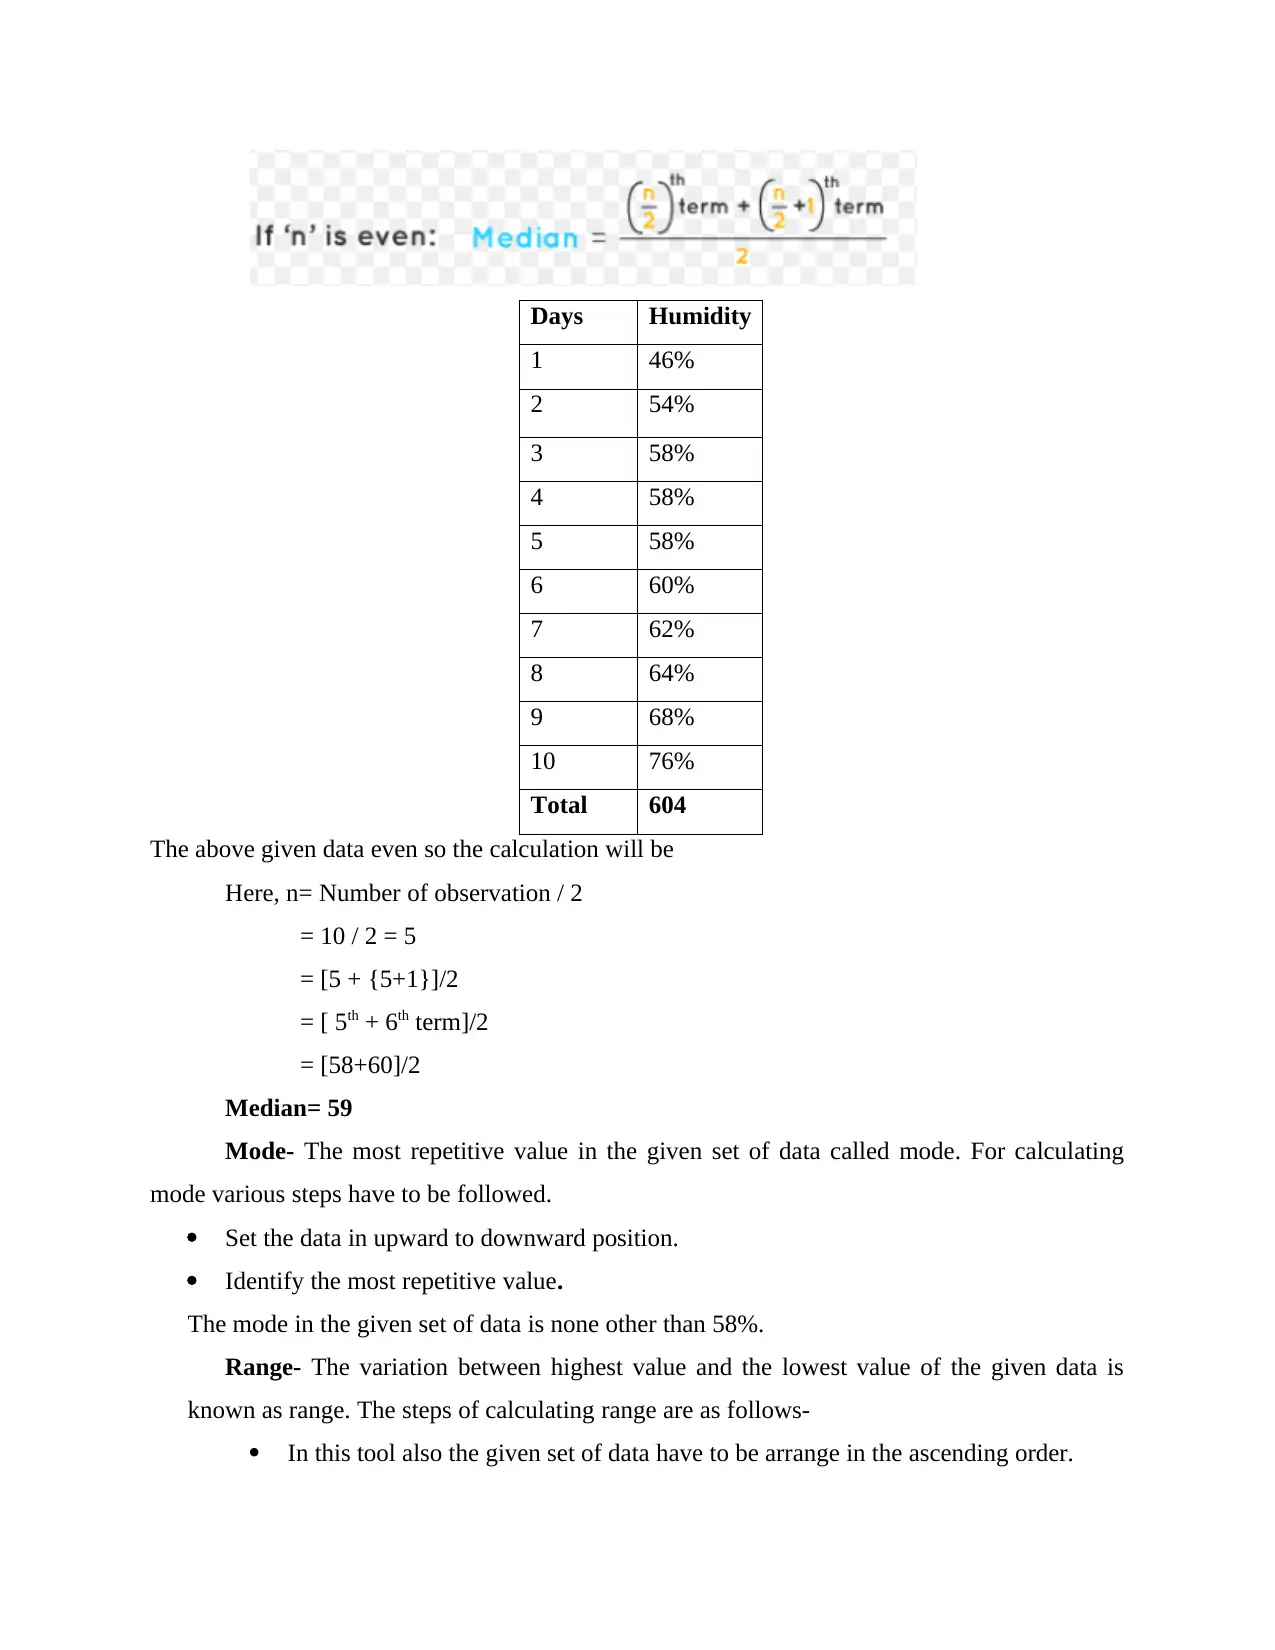
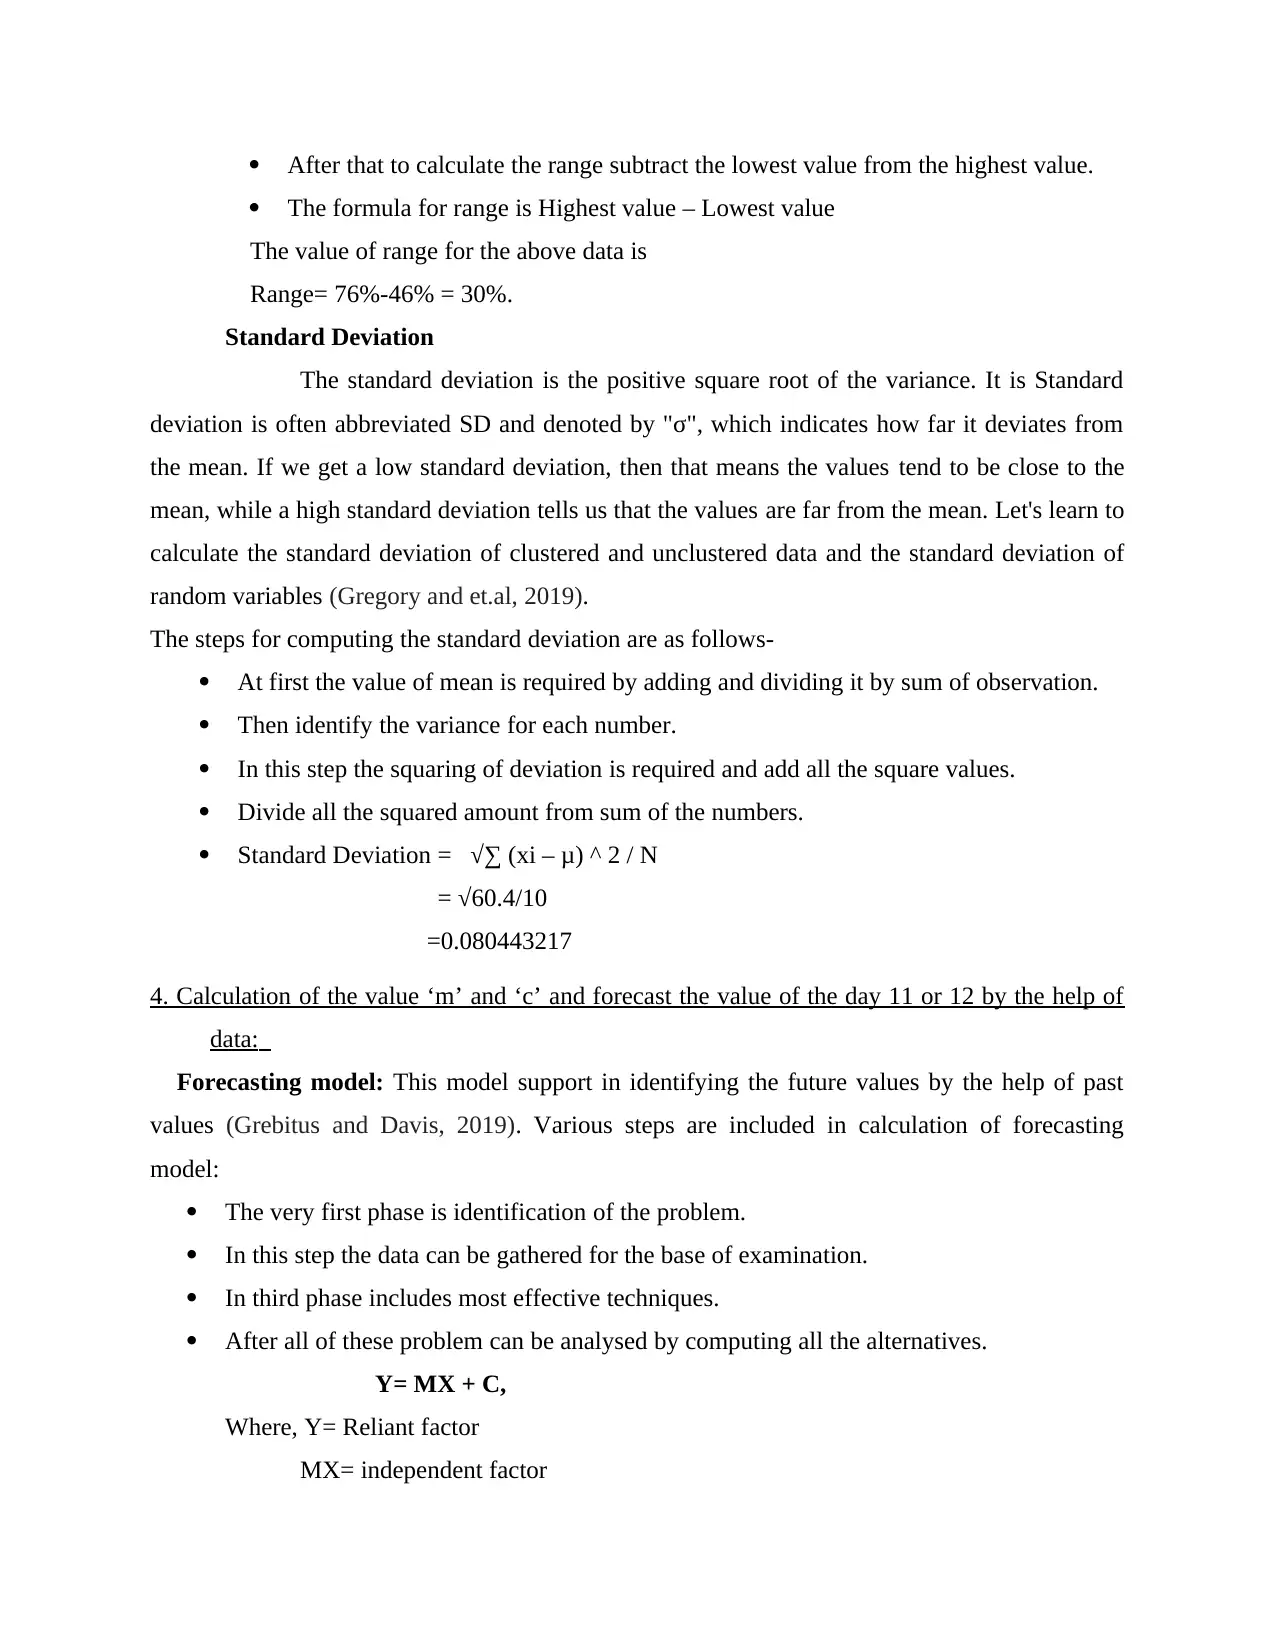
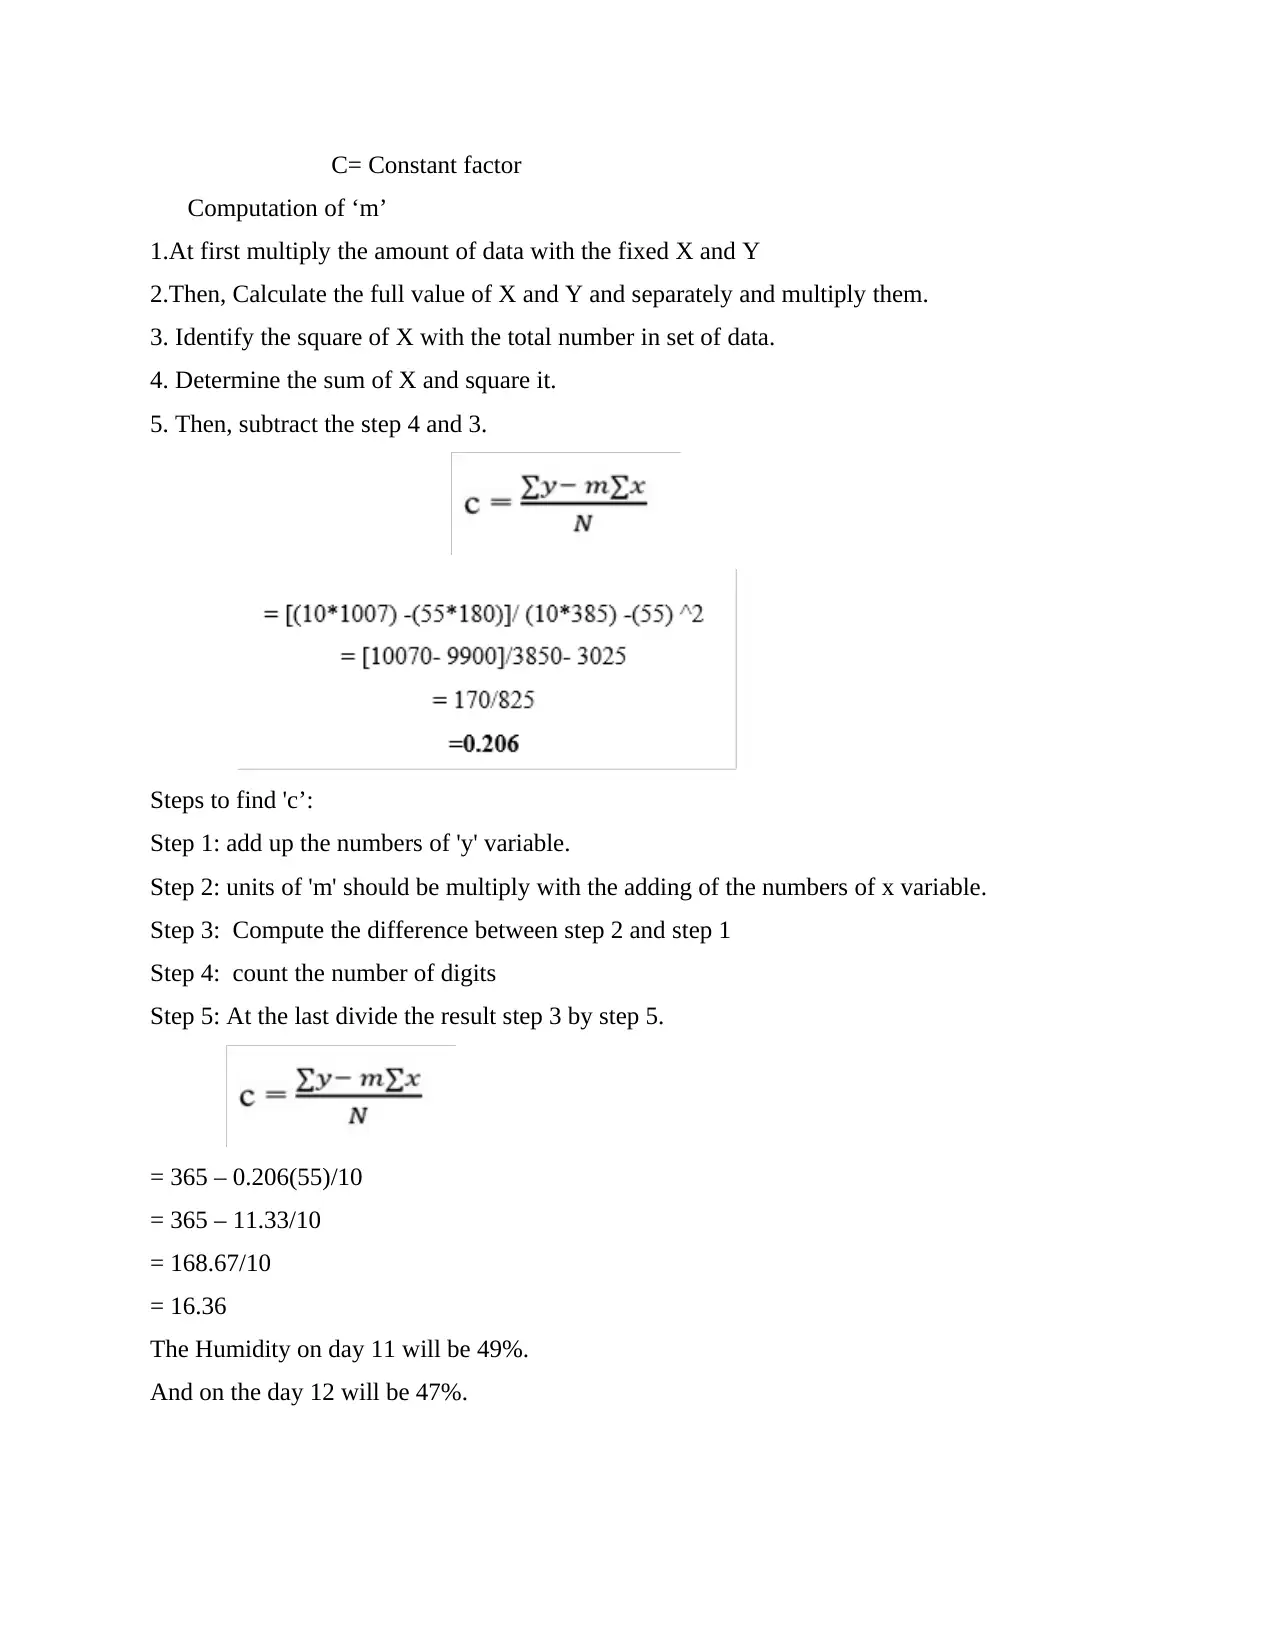
This report focuses on numeracy and data analysis, presenting a statistical analysis of humidity data collected over ten consecutive days in Birmingham. The analysis includes calculating the mean, median, mode, standard deviation, and range of the humidity data. The report details the steps involved in each calculation, providing formulas and examples. Additionally, the report uses a forecasting model to predict humidity values for days 11 and 12, based on the historical data. The report concludes that statistical tools are essential for forecasting and highlights the fluctuating nature of humidity levels in Birmingham.

Numeracy and Data
Analysis
Analysis
Paraphrase This Document
Need a fresh take? Get an instant paraphrase of this document with our AI Paraphraser

Contents
INTRODUCTION...........................................................................................................................3
MAIN BODY..................................................................................................................................3
1.Presentation of Humidity data in a Table.................................................................................3
2.Presentation of Humidity Data in graphical form:...................................................................3
3. Calculation of Mean, Median, Mode, Standard Deviation and Range:...................................4
4. Calculation of the value ‘m’ and ‘c’ and forecast the value of the day 11 or 12 by the help of
data:..............................................................................................................................................7
CONCLUSION................................................................................................................................9
REFERENCES..............................................................................................................................10

INTRODUCTION
Numeracy is defined as ability or capacity to understand the numbers and calculations. It
helps in analysing the large number of data by the help of numerical tools and method. Due
to these the people are able to take their decisions quickly as much as possible (Best and
et.al, 2022). The report includes the analysis of humidity of Birmingham city of 10
consecutive days. The analysis of the data includes Mean, Mode, Median, Standard
Deviation and many more calculations are also included in the below report. By the help of
this the humidity of the day 11 or 12 can be forecast.
MAIN BODY
1.Presentation of Humidity data in a Table
Days Humidity
1 58%
2 76%
3 68%
4 64%
5 58%
6 62%
7 54%
8 60%
9 58%
10 46%
Total 604
2.Presentation of Humidity Data in graphical form:
1. Bar Chart
⊘ This is a preview!⊘
Do you want full access?
Subscribe today to unlock all pages.

Trusted by 1+ million students worldwide

2. Line Diagram.
3. Calculation of Mean, Median, Mode, Standard Deviation and Range:
Mean- The average of given set of data is known as mean. It calculated by adding all the
data given in the table and divide it by number of data (Civil, Stoehr and Salazar, 2020). To
calculate mean various step have to followed.
At first collect all the data.
Add all the data given in table.
And the divide it by number of data given in the table
Paraphrase This Document
Need a fresh take? Get an instant paraphrase of this document with our AI Paraphraser

Days Humidity
1 58%
2 76%
3 68%
4 64%
5 58%
6 62%
7 54%
8 60%
9 58%
10 46%
Total 604
Total number of data= 604
No. of value=10 604 / 10 = 60.4
Median- The median is considered as the middle number in a sorted list of numbers that
describes the dataset better than the mean (Devlin, Moeller and Sella, 2022). The median can be
used sometimes instead of the mean when there are outliers in the series that could skew the
mean of the values. The calculation of median are as follows.
At first arrange the data in the Ascending to descending order.
After that check the total is odd or even.
If the data is odd, then following data can be applied
If the Data is Even, then applying

Days Humidity
1 46%
2 54%
3 58%
4 58%
5 58%
6 60%
7 62%
8 64%
9 68%
10 76%
Total 604
The above given data even so the calculation will be
Here, n= Number of observation / 2
= 10 / 2 = 5
= [5 + {5+1}]/2
= [ 5th + 6th term]/2
= [58+60]/2
Median= 59
Mode- The most repetitive value in the given set of data called mode. For calculating
mode various steps have to be followed.
Set the data in upward to downward position.
Identify the most repetitive value.
The mode in the given set of data is none other than 58%.
Range- The variation between highest value and the lowest value of the given data is
known as range. The steps of calculating range are as follows-
In this tool also the given set of data have to be arrange in the ascending order.
⊘ This is a preview!⊘
Do you want full access?
Subscribe today to unlock all pages.

Trusted by 1+ million students worldwide

After that to calculate the range subtract the lowest value from the highest value.
The formula for range is Highest value – Lowest value
The value of range for the above data is
Range= 76%-46% = 30%.
Standard Deviation
The standard deviation is the positive square root of the variance. It is Standard
deviation is often abbreviated SD and denoted by "σ", which indicates how far it deviates from
the mean. If we get a low standard deviation, then that means the values tend to be close to the
mean, while a high standard deviation tells us that the values are far from the mean. Let's learn to
calculate the standard deviation of clustered and unclustered data and the standard deviation of
random variables (Gregory and et.al, 2019).
The steps for computing the standard deviation are as follows-
At first the value of mean is required by adding and dividing it by sum of observation.
Then identify the variance for each number.
In this step the squaring of deviation is required and add all the square values.
Divide all the squared amount from sum of the numbers.
Standard Deviation = √∑ (xi – μ) ^ 2 / N
= √60.4/10
=0.080443217
4. Calculation of the value ‘m’ and ‘c’ and forecast the value of the day 11 or 12 by the help of
data:
Forecasting model: This model support in identifying the future values by the help of past
values (Grebitus and Davis, 2019). Various steps are included in calculation of forecasting
model:
The very first phase is identification of the problem.
In this step the data can be gathered for the base of examination.
In third phase includes most effective techniques.
After all of these problem can be analysed by computing all the alternatives.
Y= MX + C,
Where, Y= Reliant factor
MX= independent factor
Paraphrase This Document
Need a fresh take? Get an instant paraphrase of this document with our AI Paraphraser

C= Constant factor
Computation of ‘m’
1.At first multiply the amount of data with the fixed X and Y
2.Then, Calculate the full value of X and Y and separately and multiply them.
3. Identify the square of X with the total number in set of data.
4. Determine the sum of X and square it.
5. Then, subtract the step 4 and 3.
Steps to find 'c’:
Step 1: add up the numbers of 'y' variable.
Step 2: units of 'm' should be multiply with the adding of the numbers of x variable.
Step 3: Compute the difference between step 2 and step 1
Step 4: count the number of digits
Step 5: At the last divide the result step 3 by step 5.
= 365 – 0.206(55)/10
= 365 – 11.33/10
= 168.67/10
= 16.36
The Humidity on day 11 will be 49%.
And on the day 12 will be 47%.

CONCLUSION
From the above report it can be concluded that the without the statical tool and methods the
statical analyst cannot be able to forecast the humidity of the next two days. From the data it
can observed that the humidity in Birmingham is increasing or decreasing regularly. It is not
constant at all.
From the above report it can be concluded that the without the statical tool and methods the
statical analyst cannot be able to forecast the humidity of the next two days. From the data it
can observed that the humidity in Birmingham is increasing or decreasing regularly. It is not
constant at all.
⊘ This is a preview!⊘
Do you want full access?
Subscribe today to unlock all pages.

Trusted by 1+ million students worldwide

REFERENCES
Books and Journals
Best, D and et.al, 2022. Age declines in numeracy: An analysis of longitudinal data. Psychology
and Aging, 37(3). p.298.
Civil, M., Stoehr, K.J. and Salazar, F., 2020. Learning with and from immigrant mothers:
implications for adult numeracy. ZDM. 52(3). pp.489-500.
Devlin, D., Moeller, K. and Sella, F., 2022. The structure of early numeracy: evidence from
multi-factorial models. Trends in Neuroscience and Education. p.100171.
Grebitus, C. and Davis, G.C., 2019. Does the new nutrition facts panel help compensate for low
numeracy skills? An eye‐tracking analysis. Agricultural economics. 50(3). pp.249-258.
Gregory,F and et.al, 2019. The influence of mathematics self‐efficacy on numeracy performance
in first‐year nursing students: A quasi‐experimental study. Journal of Clinical
Nursing. 28(19-20). pp.3651-3659.
1 out of 10
Related Documents
Your All-in-One AI-Powered Toolkit for Academic Success.
+13062052269
info@desklib.com
Available 24*7 on WhatsApp / Email
Unlock your academic potential
Copyright © 2020–2026 A2Z Services. All Rights Reserved. Developed and managed by ZUCOL.


