Analysis of Data Using Numeracy and ICT Skills: A Comprehensive Report
VerifiedAdded on 2023/01/12
|11
|2635
|90
Report
AI Summary
This report examines the application of numeracy skills and ICT techniques in conducting research, particularly focusing on the analysis of data related to an aging population. It details the use of various ICT tools for data collection and storage, emphasizing the role of the internet and software in efficient research processes. The report outlines the application of different numerical techniques, including mean, median, standard deviation, trend analysis, and percentage calculations, to derive meaningful insights from the data. The results are presented through tables and graphs to aid in understanding and interpretation. The report concludes with an analysis of the demographic trends and their implications, recommending healthcare service improvements to support the workforce. This report provides a comprehensive overview of the methodologies and findings, making it a valuable resource for students and researchers in data analysis.
USING NUMERACY AND ICT
SKILLS
SKILLS
Paraphrase This Document
Need a fresh take? Get an instant paraphrase of this document with our AI Paraphraser
TABLE OF CONTENTS
INTRODUCTION...........................................................................................................................1
MAIN BODY...................................................................................................................................1
Background .................................................................................................................................1
Use of selected ICT techniques in carrying the research.............................................................1
Identification and application of numerical techniques in analysing the data.............................3
Choosing and interpreting the results in appropriate format. .....................................................4
Mean, median and standard deviations .......................................................................................6
CONCLUSION................................................................................................................................8
REFERENCES................................................................................................................................9
INTRODUCTION
The ICT techniques are used by every person for carrying out its research effectively and
accurately. It helps the researched in getting accurate and reliable information from different
sources. They also help in carrying out the numerical analysis so that accurate and reliable results
can be drawn by the experts. There has been widespread use of ICT techniques in the modern
time for carrying out research and practices effectively by the researcher. Present report is
focused over the use of numeracy skills and ICT Techniques for carrying out reliable research.
Study over the declining workforce due to ageing group is carried out in the report (Kahan and
et.al., 2017). It will cover the use of ICT techniques, use of different numeracy tools and
techniques for carrying out the research of organisation. It will also be presenting the results of
the research tables and figures. This will also provide recommendations and conclusions on the
research carried out on on ageing population.
MAIN BODY
Background
The population referring to the elders confronts Europe the double demographic
challenges. The ageing population is in requirement of healthcare services as it will also increase
the access over declining workforce. The ageing population is in requirement of healthcare
services as after sometimes it will be surpassing available workforce. It has strong implications
over everyone and the government. This is a serious concern to be taken care. The research
conducted has enabled to analyse the results of growing population and its impact over
Healthcare services.
Use of selected ICT techniques in carrying the research.
The research has been conducted on the use of ICT techniques for carrying out th
research. Information and communication technology is playing important role in helping the
researchers to analyse and obtain the informations. ICT tools and techniques are evolving
continuously and at very fast pace. It could be referred as the digital technology that can be used
in every possible manner for helping businesses, individuals and organisations. It cover tools for
storing, receiving information, transmitting and manipulating the information digitally or
electronically. Researchers also use technologies like computer based technology for carrying
out the research and on personal computers at anywhere (Rausch and et.al., 2017). Digital
1
⊘ This is a preview!⊘
Do you want full access?
Subscribe today to unlock all pages.
Trusted by 1+ million students worldwide
communication technology allows people & organisations in communicating and sharing the
information over digital platform. ICT tools like word processing, database software, graphics
software, digital communication technologies. This refers to internal and external networks.
ICT facilitate to carry out the research from even at home. Internet allows people to
receive information related to the concerned area from various sources that are reliable accurate.
This saves time and cost of the researcher as they do not have to visit different places and
libraries for getting information related to the research (Sgobbi, 2018). This enables to store the
data in different sources available to it. The new technology along with the research also
enhances the knowledge and understanding of the people. Software helps in analysing the data
and information gathered from different sources and drawing more accurate and reliable results.
They can structure the data appropriately as per the needs and requirements of the
researcher. Data and information are represented in tables and graphs for having more clear
understanding of the results and interpretation of the data. This also helps in demonstrating and
exploring the research more accurately to the audience. The ICT techniques has more capacity
and ability in analysing the data gathered. These tools provides the communication channel for
interacting with others for getting more clear results and also with the seniors and other
experienced executives to assists in the right direction. Appropriate use can help researchers in
carrying out in depth research of their topic and also applying these techniques for getting more
accurate and reliable results to the people. This has given a new era to the research practise by
making it more easy and having access over wider area within less time. ICT techniques is used
for communicating effectively with others over internet and getting proper guidance for further
research.
Researcher has used the ICT techniques in collecting the data for ageing population using
the internet computers. Information from the previous researches, books and other areas were
collected. This saved time the time of researcher. All the data was stored in computer and other
drives and this data with the help of software was properly structured. This provided the relevant
data in proper format on which different numeracy tools were applied for getting the results and
outcomes. Results were presented in graphs and tables for getting proper understanding and
interpreting th results more accurately. This also helped researcher in communicating with other
seniors for getting guidance to carry out research and clearing the doubts.
2
Paraphrase This Document
Need a fresh take? Get an instant paraphrase of this document with our AI Paraphraser
Identification and application of numerical techniques in analysing the data.
The research has been carried out using the descriptive approach in which statistical
techniques have been used. This involves quantitative approach of research involving analysis of
data in terms of numbers and figures. There are various numerical techniques that may be used
for getting the outcomes from the research carried out by the enterprise. The quantitative
research gives more clear representation of data and information using various statistical
techniques. Research is considered to be more successful if along with the qualitative
information also includes quantitative information in the form of numbers so that exact results
could be analysed and understood.
Mean
Mean is defined as average of numbers. Mean is used for calculating the average value
between given set of data. It is calculating by dividing the sum of numbers with the total number
of observations or numbers in group. This could be better explained with the help of example.
Suppose if X is at meeting with ten people, and sum of ages of all members in meeting is 450.
Mean age of members present in meeting is 45. This is obtained by dividing the sum of age 450
by number of members which is 10. It is used as general indicator for most of the data with gig
number of out-liners. It is very difficult to identify the age group or any such like data without
using mean as it is not possible to measure and come at results on individual basis (Ramteke,
2020). This tool has facilitated the users to come with the average figures for drawing their
attention and focusing over particular range in case of wide and bid set of data available. This is
used by the researcher in the present case for measuring the average of persons between different
age.
Median
Median refers to the measure of average values when data consists of exceptionally low
or high values as they have influences over the outcomes. Median is also referred as suitable
measures of average of data that is classified on ordinal and scale. This is also called as mid
point in a data set where the values are either arranged in ascending or descending order.
Median could also be used for getting ideas about what values are falling above mid point and
the values that are falling below mid point. For example, at a place there are five people having
age of 25,37,44 & 87. In this given data 37 is median age as the numbers of individuals younger
3
than 37 and older than 37 are equal. This is used at place where the representation of group may
be skewed by incomes. In the projects this will be used for getting the mid value of the data
given for finding the number of people belonging to particular age group in the years.
Mode
Mode is defined as the value that occurs most frequently in the data set. Mode is typically
used for categorical, ordinal and the discrete data. It only used for measuring the central
tendency which could be used for categorical data. This is not much used for describing the data
sets. It is also not used in the present data as this is not suitable for the given research.
Standard Deviations
It is used for measuring the deviations in data set. This tool is used by by number of
people according to their use. These are also used for assessing the deviations between the data
set. This is used by researchers for measuring how far are the individual measurement from mean
values of data set. It measures variability of distributions, if the variability is higher the standard
deviation will also be higher and lower with lower variability (Lane and Conlon, 2016). This is
applied in the present case for analysing the deviation of number of people from the average
people measured using mean.
Trend analysis
This is a technique used for analysing the movements based on previous available data.
This is used for analysing the trend for future in the data. This is a graphical representation that is
used for presenting the data in more understandable format. In the given data trend analysis has
been used for analysing the growth of population of the selected age group (Zaranis and
Exarchakos, 2018). This makes it easier to represent the data and information.
Percentage
This is used for analysing the change in variables of the given database. Percentage terms
are used for more accurately understanding and interpreting the data. This is used by the
researcher to find out the difference between different years for the selected age. The data set are
more accurately understood when they are presented in terms of percentage.
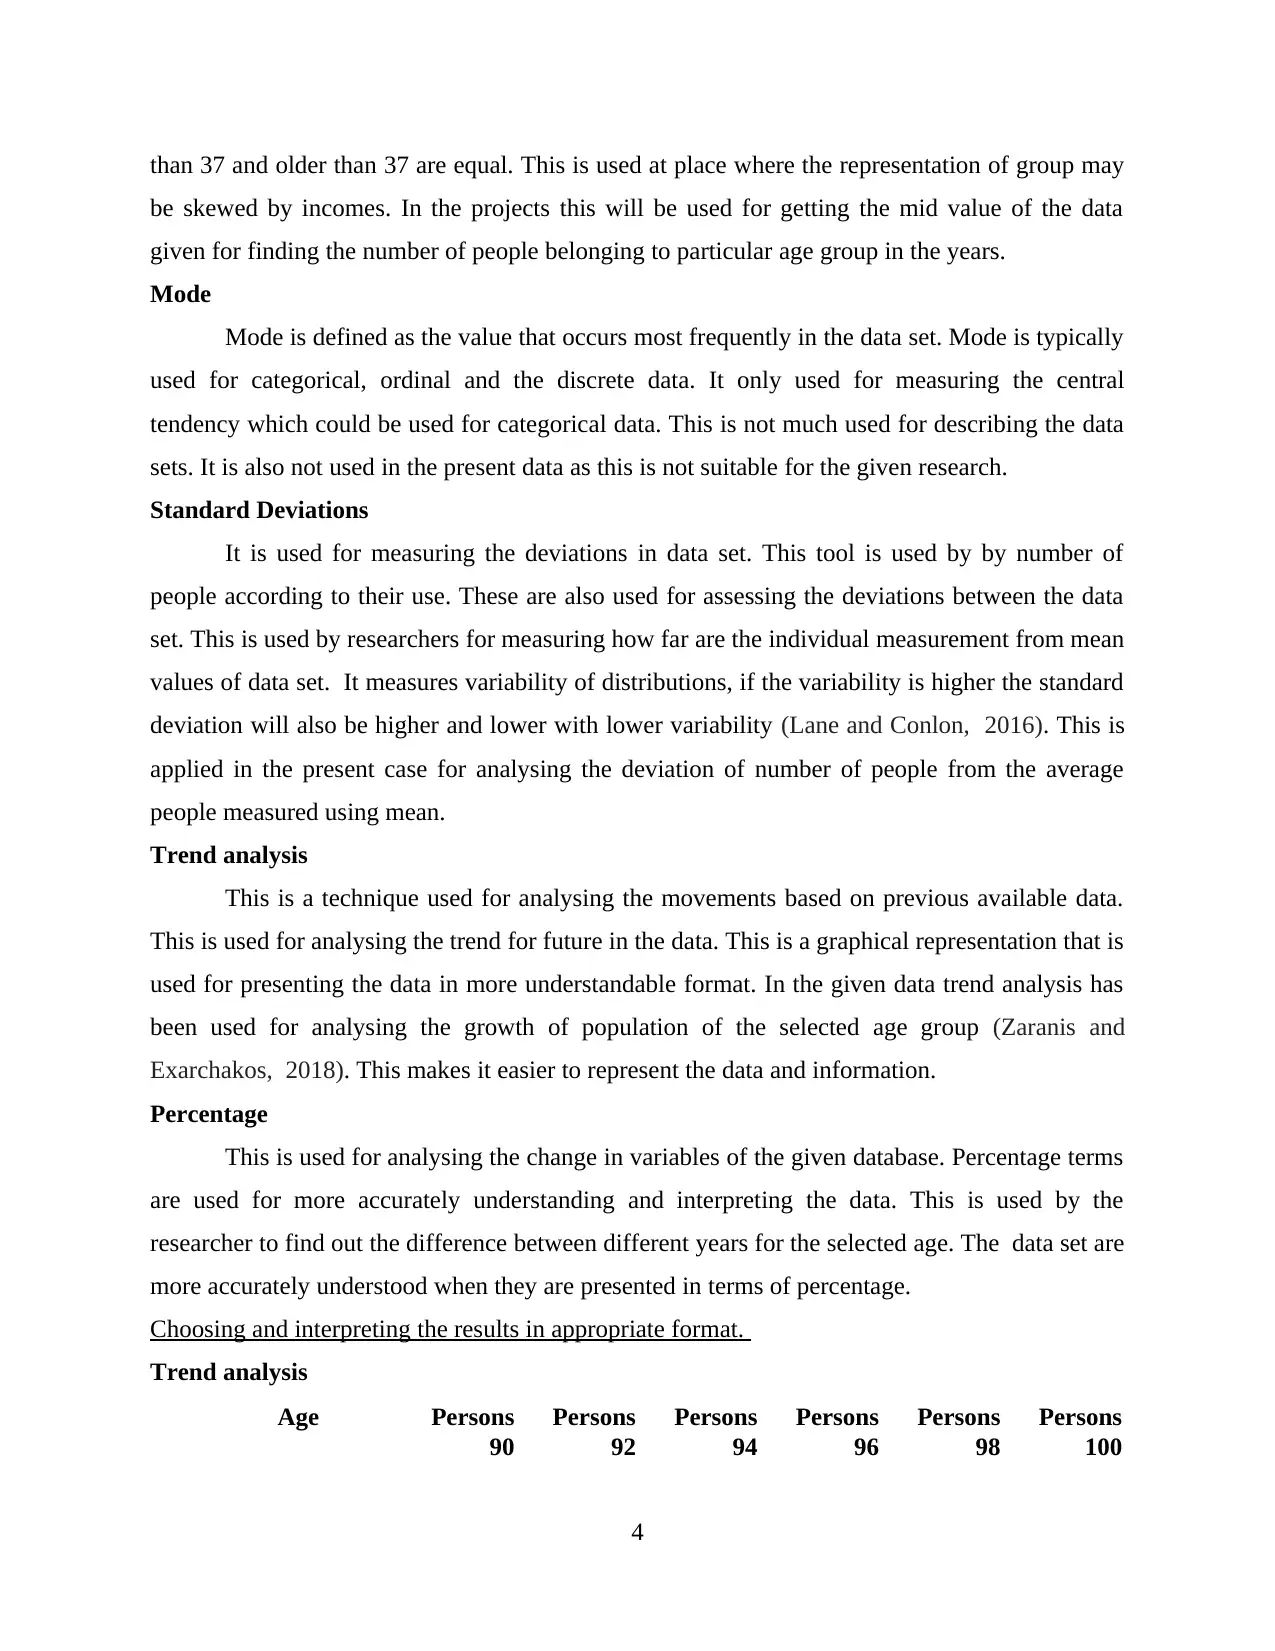
Choosing and interpreting the results in appropriate format.
Trend analysis
Age Persons Persons Persons Persons Persons Persons
90 92 94 96 98 100
4
be skewed by incomes. In the projects this will be used for getting the mid value of the data
given for finding the number of people belonging to particular age group in the years.
Mode
Mode is defined as the value that occurs most frequently in the data set. Mode is typically
used for categorical, ordinal and the discrete data. It only used for measuring the central
tendency which could be used for categorical data. This is not much used for describing the data
sets. It is also not used in the present data as this is not suitable for the given research.
Standard Deviations
It is used for measuring the deviations in data set. This tool is used by by number of
people according to their use. These are also used for assessing the deviations between the data
set. This is used by researchers for measuring how far are the individual measurement from mean
values of data set. It measures variability of distributions, if the variability is higher the standard
deviation will also be higher and lower with lower variability (Lane and Conlon, 2016). This is
applied in the present case for analysing the deviation of number of people from the average
people measured using mean.
Trend analysis
This is a technique used for analysing the movements based on previous available data.
This is used for analysing the trend for future in the data. This is a graphical representation that is
used for presenting the data in more understandable format. In the given data trend analysis has
been used for analysing the growth of population of the selected age group (Zaranis and
Exarchakos, 2018). This makes it easier to represent the data and information.
Percentage
This is used for analysing the change in variables of the given database. Percentage terms
are used for more accurately understanding and interpreting the data. This is used by the
researcher to find out the difference between different years for the selected age. The data set are
more accurately understood when they are presented in terms of percentage.
Choosing and interpreting the results in appropriate format.
Trend analysis
Age Persons Persons Persons Persons Persons Persons
90 92 94 96 98 100
4
⊘ This is a preview!⊘
Do you want full access?
Subscribe today to unlock all pages.
Trusted by 1+ million students worldwide
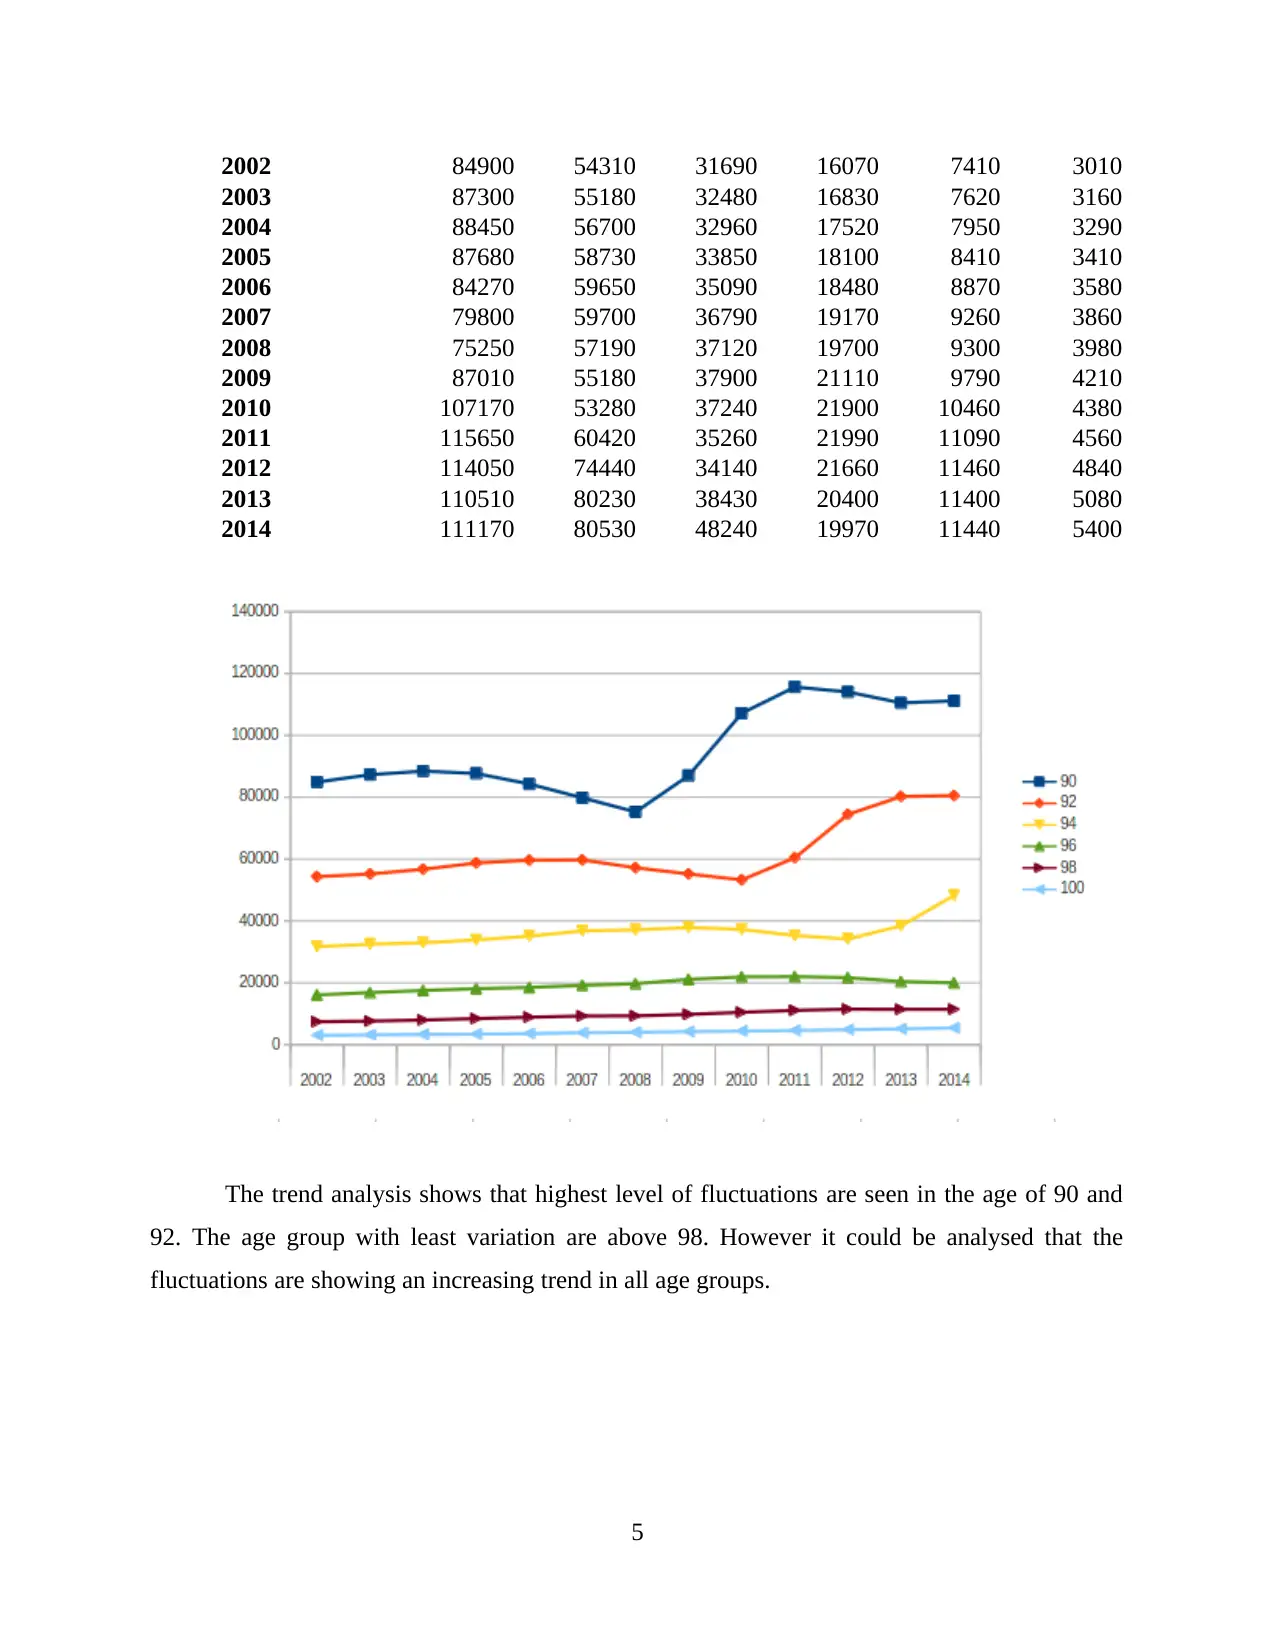
2002 84900 54310 31690 16070 7410 3010
2003 87300 55180 32480 16830 7620 3160
2004 88450 56700 32960 17520 7950 3290
2005 87680 58730 33850 18100 8410 3410
2006 84270 59650 35090 18480 8870 3580
2007 79800 59700 36790 19170 9260 3860
2008 75250 57190 37120 19700 9300 3980
2009 87010 55180 37900 21110 9790 4210
2010 107170 53280 37240 21900 10460 4380
2011 115650 60420 35260 21990 11090 4560
2012 114050 74440 34140 21660 11460 4840
2013 110510 80230 38430 20400 11400 5080
2014 111170 80530 48240 19970 11440 5400
The trend analysis shows that highest level of fluctuations are seen in the age of 90 and
92. The age group with least variation are above 98. However it could be analysed that the
fluctuations are showing an increasing trend in all age groups.
5
Paraphrase This Document
Need a fresh take? Get an instant paraphrase of this document with our AI Paraphraser
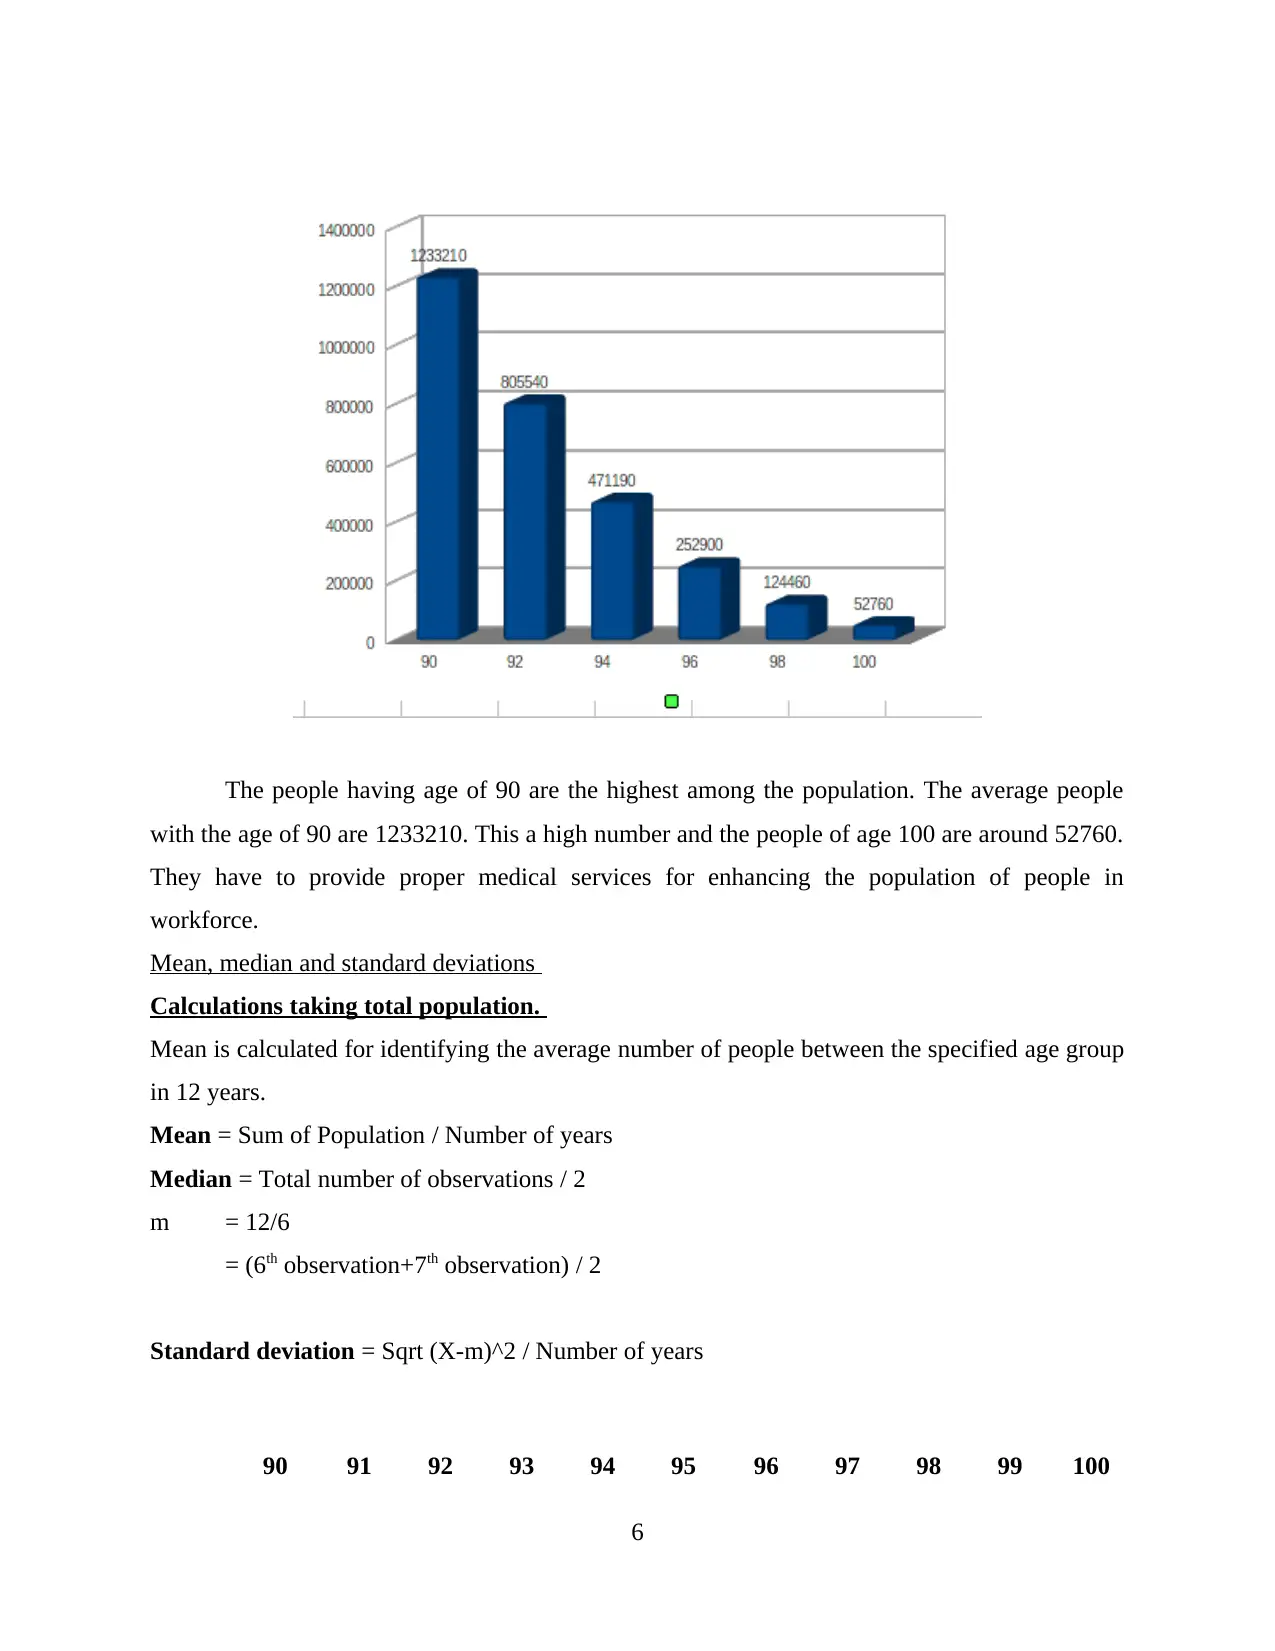
The people having age of 90 are the highest among the population. The average people
with the age of 90 are 1233210. This a high number and the people of age 100 are around 52760.
They have to provide proper medical services for enhancing the population of people in
workforce.
Mean, median and standard deviations
Calculations taking total population.
Mean is calculated for identifying the average number of people between the specified age group
in 12 years.
Mean = Sum of Population / Number of years
Median = Total number of observations / 2
m = 12/6
= (6th observation+7th observation) / 2
Standard deviation = Sqrt (X-m)^2 / Number of years
90 91 92 93 94 95 96 97 98 99 100
6
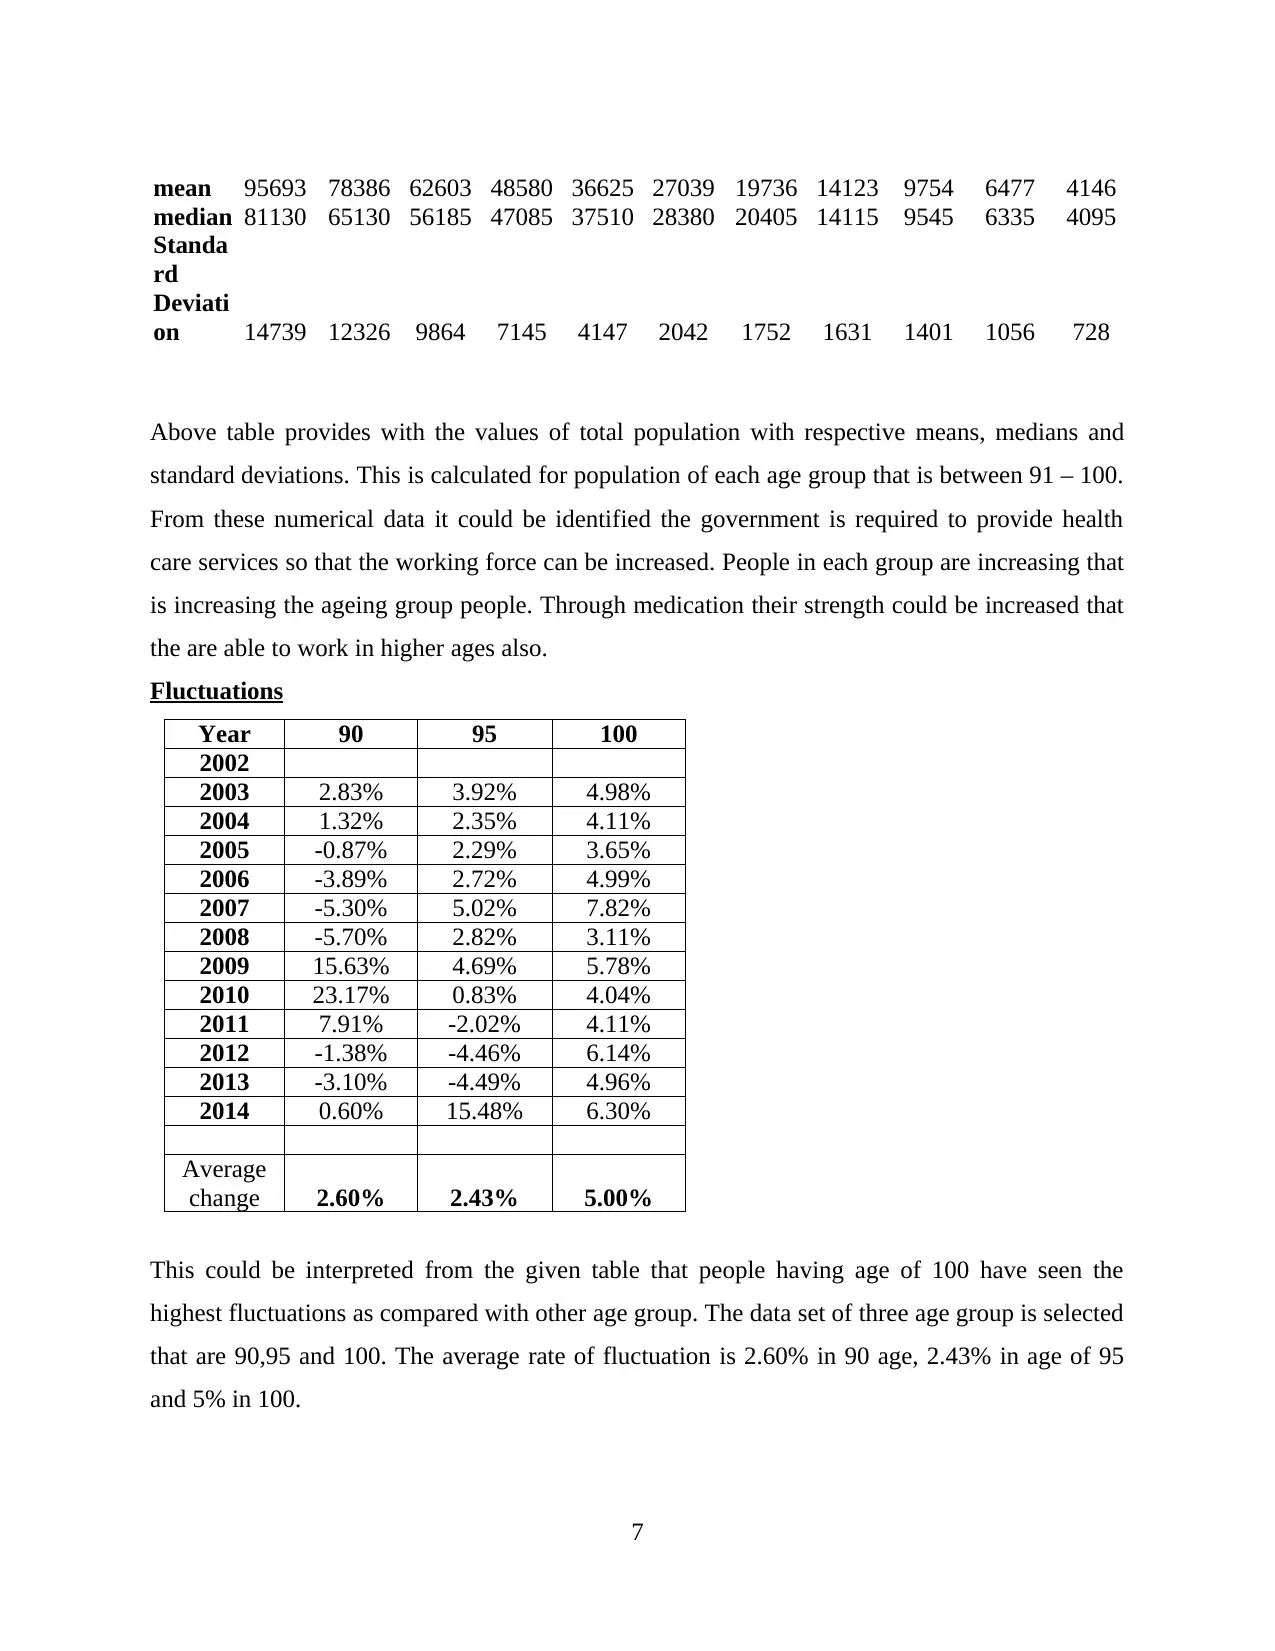
mean 95693 78386 62603 48580 36625 27039 19736 14123 9754 6477 4146
median 81130 65130 56185 47085 37510 28380 20405 14115 9545 6335 4095
Standa
rd
Deviati
on 14739 12326 9864 7145 4147 2042 1752 1631 1401 1056 728
Above table provides with the values of total population with respective means, medians and
standard deviations. This is calculated for population of each age group that is between 91 – 100.
From these numerical data it could be identified the government is required to provide health
care services so that the working force can be increased. People in each group are increasing that
is increasing the ageing group people. Through medication their strength could be increased that
the are able to work in higher ages also.
Fluctuations
Year 90 95 100
2002
2003 2.83% 3.92% 4.98%
2004 1.32% 2.35% 4.11%
2005 -0.87% 2.29% 3.65%
2006 -3.89% 2.72% 4.99%
2007 -5.30% 5.02% 7.82%
2008 -5.70% 2.82% 3.11%
2009 15.63% 4.69% 5.78%
2010 23.17% 0.83% 4.04%
2011 7.91% -2.02% 4.11%
2012 -1.38% -4.46% 6.14%
2013 -3.10% -4.49% 4.96%
2014 0.60% 15.48% 6.30%
Average
change 2.60% 2.43% 5.00%
This could be interpreted from the given table that people having age of 100 have seen the
highest fluctuations as compared with other age group. The data set of three age group is selected
that are 90,95 and 100. The average rate of fluctuation is 2.60% in 90 age, 2.43% in age of 95
and 5% in 100.
7
⊘ This is a preview!⊘
Do you want full access?
Subscribe today to unlock all pages.
Trusted by 1+ million students worldwide
CONCLUSION
The above report has given an understanding about the use of numeracy and ICT skills.
This is used by researchers for coming at more accurate and reliable results. Numeracy tools
include the mean, median and standard deviations. The ICT techniques such as computers,
internet and other software for analysing the data. Researchers use these descriptive analysis for
big data sets of information.
8
Paraphrase This Document
Need a fresh take? Get an instant paraphrase of this document with our AI Paraphraser
REFERENCES
Books and Journals
Kahan, D. M. and et.al., 2017. Motivated numeracy and enlightened self-
government. Behavioural Public Policy. 1(1). pp.54-86.
Rausch, A. and et.al., 2017. Exploring the possibilities of online assessment of early numeracy in
kindergarten. In Proceedings of the 41st Conference of the International Group for the
Psychology of Mathematics Education (Vol. 4, pp. 89-96).
Sgobbi, F., 2018. The Skills of European ICT Specialists. In Encyclopedia of Information
Science and Technology, Fourth Edition (pp. 4785-4796). IGI Global.
Ramteke, S., 2020. Effect of ICT on Students Achievements in Mathematics. Our
Heritage. 68(9). pp.1568-1571.
Lane, M. and Conlon, G., 2016. The impact of literacy, numeracy and computer skills on
earnings and employment outcomes. OECD.
Zaranis, N. and Exarchakos, G. M., 2018. The Use of ICT and the Realistic Mathematics
Education for Understanding Simple and Advanced Stereometry Shapes Among University
Students. In Research on e-Learning and ICT in Education(pp. 135-152). Springer, Cham.
9
1 out of 11
Related Documents


Your All-in-One AI-Powered Toolkit for Academic Success.
+13062052269
info@desklib.com
Available 24*7 on WhatsApp / Email
![[object Object]](/_next/static/media/star-bottom.7253800d.svg)
Unlock your academic potential
Copyright © 2020–2026 A2Z Services. All Rights Reserved. Developed and managed by ZUCOL.