Numeracy 2 (MAII3007) Coursework Portfolio Autumn 2018 Submission

Verified

Added on  2023/05/28

|21
|3161
|355
Homework Assignment
AI Summary
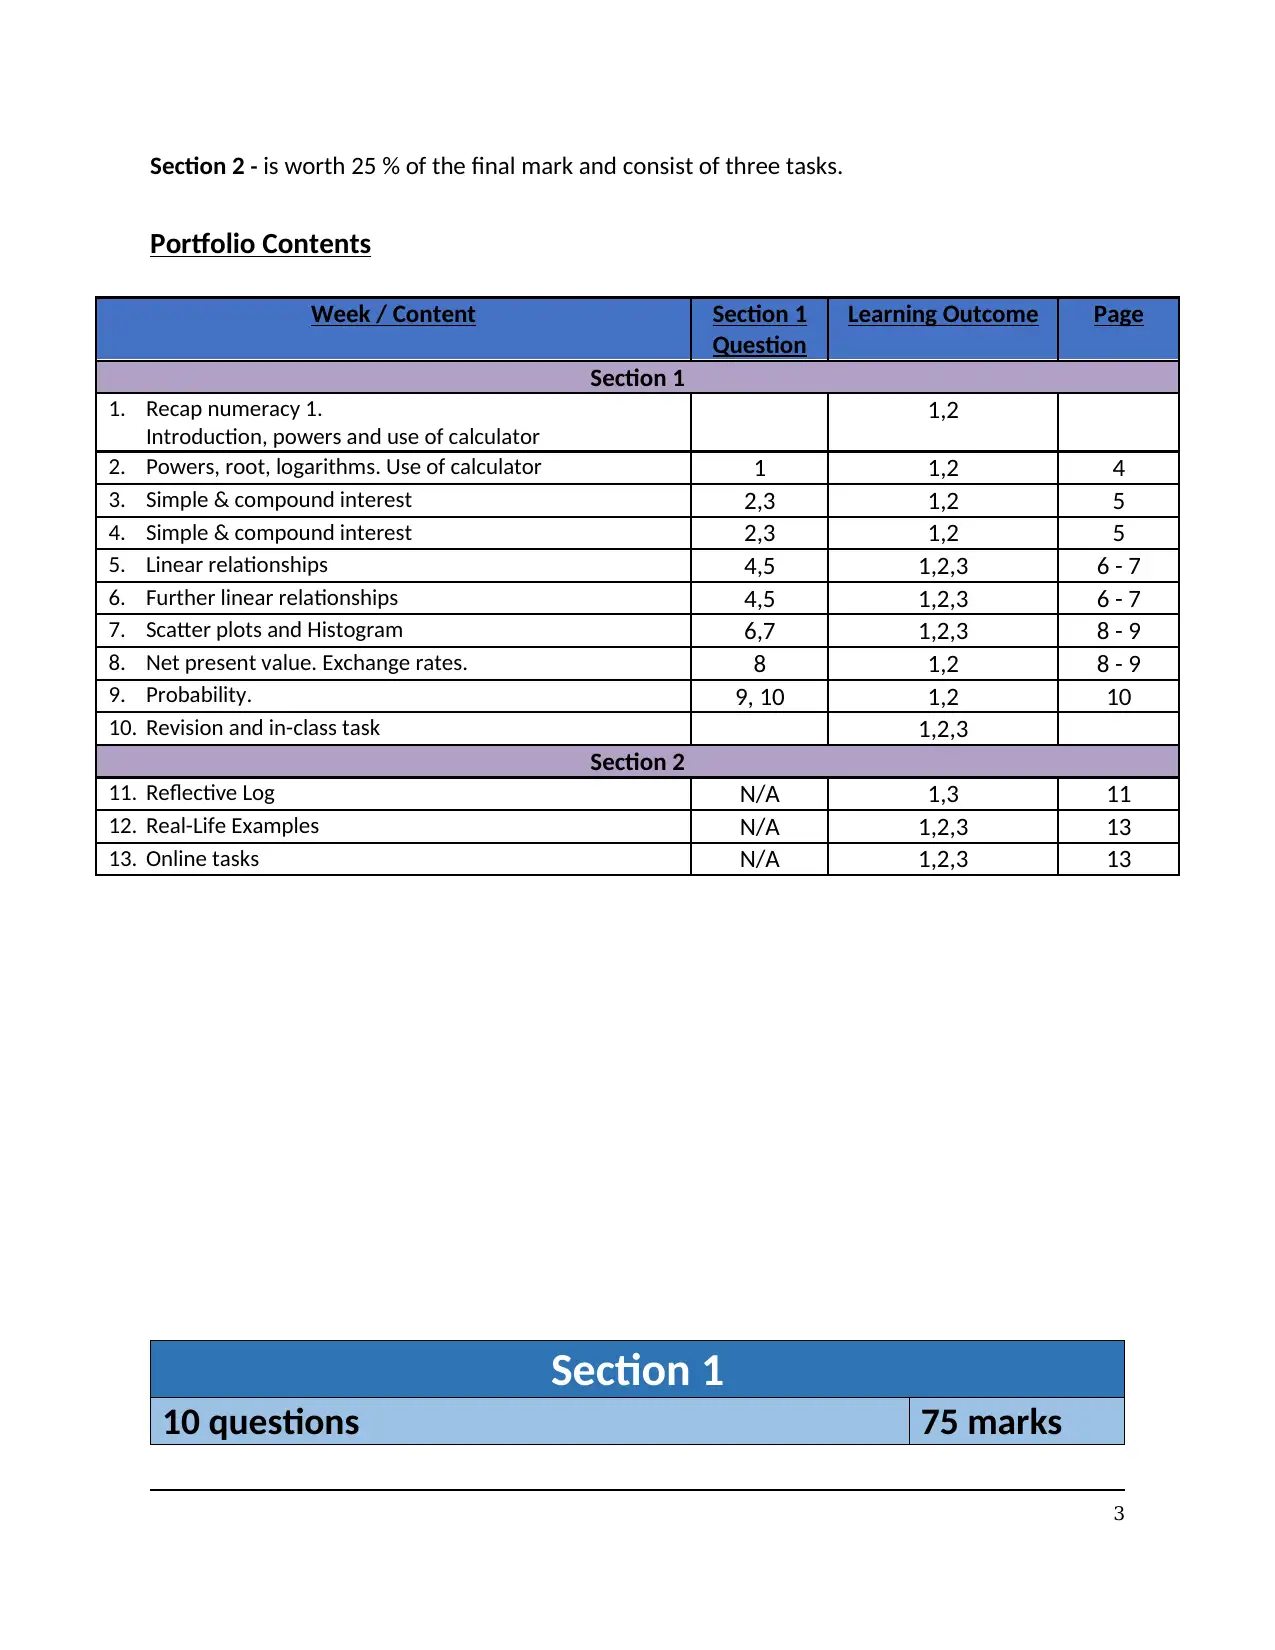
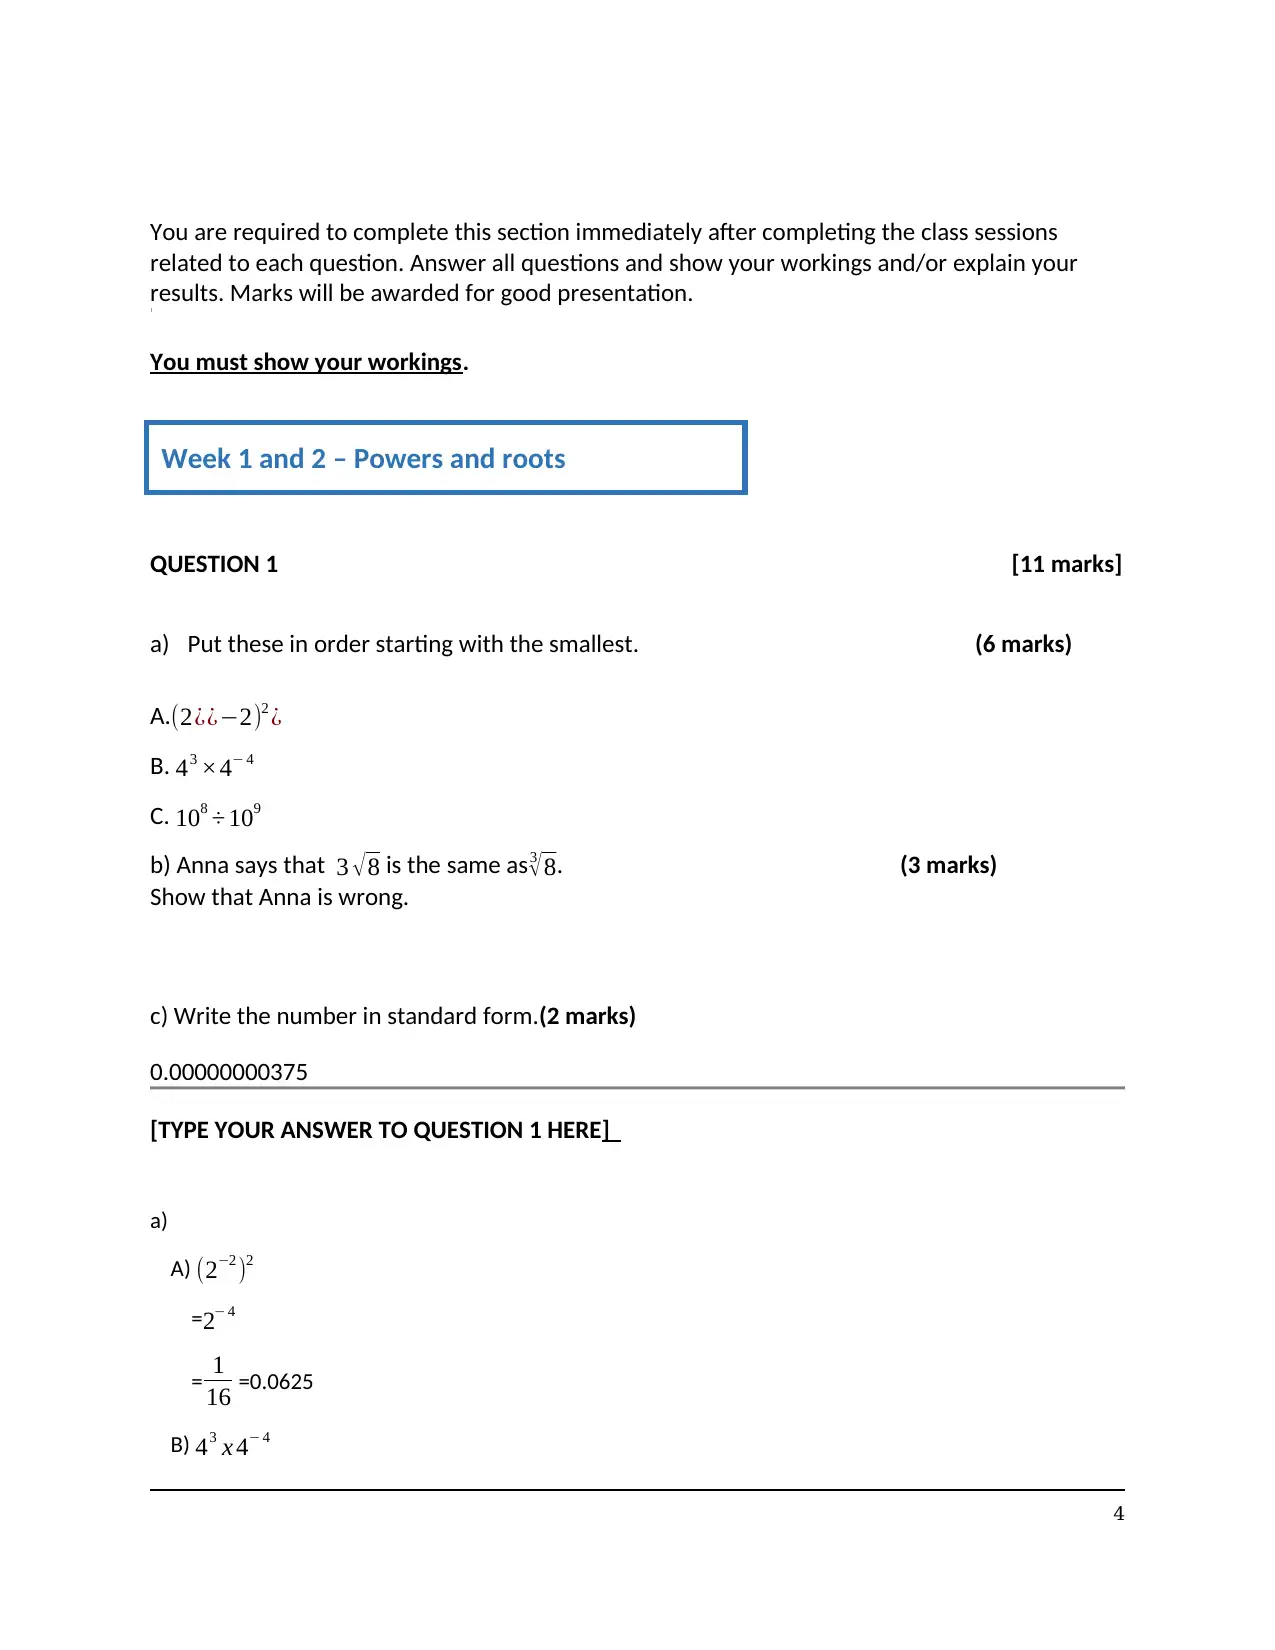
This document is a Numeracy 2 coursework portfolio from Autumn 2018, submitted by a student. The portfolio is divided into two sections. Section 1, worth 75% of the final mark, comprises 10 questions covering topics such as powers and roots, simple and compound interest, linear equations, scatter plots, histograms, net present value, exchange rates, and probability. The solutions include detailed workings and explanations. Section 2, worth 25% of the final mark, includes a reflective log, real-life examples, and online tasks. The assignment assesses the student's understanding of numeracy concepts through problem-solving and application of these concepts to real-world scenarios. The portfolio includes calculations, graphical representations, and interpretations of data, demonstrating the student's ability to apply mathematical principles to various financial and statistical problems. The reflective log encourages self-assessment and critical thinking about the learning process. The provided solutions and the portfolio structure aim to help students understand and master the course material.
tabler-icon-diamond-filled.svg

Contribute Materials

Your contribution can guide someone’s learning journey. Share your documents today.
Document Page
Numeracy 2 (MAII3007) Coursework
Portfolio
Autumn2018
Student Name
Student ID
Tutor
This is your Numeracy 2 e-portfolio which you must submit by Tuesday
18.12.2018 via the Student Portal.
Please read carefully
1
tabler-icon-diamond-filled.svg

Secure Best Marks with AI Grader

Need help grading? Try our AI Grader for instant feedback on your assignments.
Document Page
This is your Numeracy 2 e-portfolio for the semester commencing October 2018 (Autumn
2018). Please save a copy on your computer and back it up regularly (e.g. by saving it on your
computer/ in the cloud (e.g. Google Drive) / emailing it to yourself). You should print a working
copy and bring it to all lectures and tutorials. However, at the end of the course, you will need
to submit a completed electronic copy.
Please read carefully the module handbook, the marking criteria and the grade descriptors.
Academic Misconduct
You are responsible for ensuring that you understand the policy and regulations about
academic misconduct. You must:
Complete this work alone(except where required or allowed by this assignment briefing
paper) and ensure it has not been written or composed by or with the assistance of any
other person.
Make sure all sentences or passages quoted from other peoples’ work in this assignment
(with or without trivial changes) are in quotation marks, and are specifically acknowledged
by reference to the author, work and page.
The portfolio’s structure
Section 1 - is worth 75% of the final mark and consists of 10 questions.
2
Document Page
Section 2 - is worth 25 % of the final mark and consist of three tasks.
Portfolio Contents
Week / Content Section 1
Question
Learning Outcome Page
Section 1
1. Recap numeracy 1.
Introduction, powers and use of calculator
1,2
2. Powers, root, logarithms. Use of calculator 1 1,2 4
3. Simple & compound interest 2,3 1,2 5
4. Simple & compound interest 2,3 1,2 5
5. Linear relationships 4,5 1,2,3 6 - 7
6. Further linear relationships 4,5 1,2,3 6 - 7
7. Scatter plots and Histogram 6,7 1,2,3 8 - 9
8. Net present value. Exchange rates. 8 1,2 8 - 9
9. Probability. 9, 10 1,2 10
10. Revision and in-class task 1,2,3
Section 2
11. Reflective Log N/A 1,3 11
12. Real-Life Examples N/A 1,2,3 13
13. Online tasks N/A 1,2,3 13
Section 1
10 questions 75 marks
3
Document Page
You are required to complete this section immediately after completing the class sessions
related to each question. Answer all questions and show your workings and/or explain your
results. Marks will be awarded for good presentation.
You must show your workings.
QUESTION 1 [11 marks]
a) Put these in order starting with the smallest. (6 marks)
A.(2¿¿2)2 ¿
B. 43 ×4 4
C. 108 ÷ 109
b) Anna says that 3 8 is the same as3
8. (3 marks)
Show that Anna is wrong.
c) Write the number in standard form.(2 marks)
0.00000000375
[TYPE YOUR ANSWER TO QUESTION 1 HERE]
a)
A) (22 )2
= 2 4
= 1
16 =0.0625
B) 43 x 4 4
4
Week 1 and 2 – Powers and roots
tabler-icon-diamond-filled.svg

Secure Best Marks with AI Grader

Need help grading? Try our AI Grader for instant feedback on your assignments.
Document Page
=41
= 1
4 =0.25
C) 108
109 =0.1
A < C < B
b) 3√8
=3*2.828
=8.4852
3
8 =2
So Anna is wrong
c) 0.00000000375
standard form = 3.75x 10⁹
QUESTION 2 [9marks]
A. Anna deposited £3800 in a bank paying 3% simple interest rate. (3 marks)
Find out how much interest she will receive after 1 year and 3 months.
B. Amanda wants to invest £13,500. Two different institutions have offered her different
investment propositions. Showing your calculations, decide which investment option is more
beneficial for her. (6 marks)
Option 1
£13500 is deposited for 6 years in a bank paying 4% interest compounded annually.
Option 2
£13500 is deposited for 6 years in a bank paying 3.5% interest compounded semi - annually.
5
Week 3 and 4– Simple and compound interest
Document Page
[TYPE YOUR ANSWER TO QUESTION 2 HERE]
2)
A) £3800
Simple interest rate= 3% = .03
Interest received in 1 year 3 months= 3800 x.03 x1.25
= 142.5
B) Amanda wants to invest £13500
A= P*( 1+ r
n ¿ ¿nt
A= amount
P = principal amount
r = interest rate in decimals
n = number of times interest is compounded per year
t = time
option 1
P= 13500
n= 1
r=4% =.04
t=6
A= 13500(1+ .04
1 ¿ ¿16
=£17081.806
Option 2
P=13500
r=3.5% =.035
n= 2
t=6
A= 13500 x(1+ .035
2 )
26
6
Document Page
=£16624.430
Option 1 is beneficial for Amanda.
QUESTION 3 [6marks]
A. Sara invests £6850 at a 4.5% interest rate annually. How long would it take for Sara
to reach the balance of £8920.48 with annually compounding interest?(3 marks)
B. Matilda invests £8500 in a bank savings account and after 8 years her balance is
£13547.78.
Calculate the compound interest rate she received and round your answer to two
decimal places (2dp). (3 marks)
[TYPE YOUR ANSWER TO QUESTION 3 HERE]
3)
A) P= £6850
r=4.5% =.045
A= £8920.48
n =1
t =?
A= P*( 1+ r
n ¿ ¿nt
A= amount
P = principal amount
r = interest rate in decimals
n = number of times interest is compounded per year
t = time
8920.48= 6850(1+ .045
1 ¿ ¿t
1.3022= (1.045)t
7
tabler-icon-diamond-filled.svg

Paraphrase This Document

Need a fresh take? Get an instant paraphrase of this document with our AI Paraphraser
Document Page
t=6
6 years is needed
B) P=8500
t=8
A=13547.78
n= 1
r=?
A= P*( 1+ r
n ¿ ¿nt
A= amount
P = principal amount
r = interest rate in decimals
n = number of times interest is compounded per year
t = time
13547.78= 8500 (1+ r
1 )
8
1.0599=1+r
r=.0599
= .06
Interest 6%
QUESTION 4 [7 marks]
b) Calculate the intersect point for line y = 7x – 10 and y = 5x + 2 (4 marks)
8
Week 5 and 6 – Linear equations
Document Page
b) Solve the inequality and choose a correct graphical representation for your result. (3 marks)
6t – 6 ≤ 8t – 12
A. B. C.
D. E. F.
TYPE YOUR ANSWER TO QUESTION 4 HERE]
4)
a) at intersecting point
7x-10=5x+2
2x =12
X=6
Put x=6 in any equation
y=7x -10
=7*6 - 10
=42-10
=32
Intersecting point (x, y) = (6,32)
9
-3
3-33
-3 3
Document Page
b) 6t-6 ≤ 8t-12
12-6 ≤ 8t-6t
6 ≤ 2t
3 ≤ t
Option c
QUESTION 5 [5 marks]
Draw a line representing the given linear inequalities y > 3x + 1 and shade the region that
satisfies this inequality.
x -2 0 1
y
10
tabler-icon-diamond-filled.svg

Secure Best Marks with AI Grader

Need help grading? Try our AI Grader for instant feedback on your assignments.
Document Page
TYPE YOUR ANSWER TO QUESTION 5 HERE]
5)
Y > 3x + 1
x -2 0 1
y -5 1 4
11
Document Page
QUESTION 6 [10 marks]
The scatter plot presents the correlation between monthly expenses spent on advertising a
newly launched product and monthly profit from its sale. Knowing that the line of the best fit
crosses points (4000, 13057) and (6000, 17057) calculate the expected profit when company
invests £8000 for an advert.
12
Week 7 – Scatter plot and Histogram
Document Page
2500 3000 3500 4000 4500 5000 5500 6000 6500 7000
0
2000
4000
6000
8000
10000
12000
14000
16000
18000
20000
expenses
profit
Your calculation should including steps such as:
a) Calculate slope (m) (3 marks)
b) Calculate y – intercept (c) (3 marks)
c) Create the linear equation for the line of the best fit (y = mx + c) (2 marks)
d) Calculate the future profit (2 marks)
TYPE YOUR ANSWER TO QUESTION 6 HERE]
6)
a) slope of line, m = y2 y1
x2x1
( x1 , y1 ¿=¿ (4000, 13057)
( x2 , y2 ¿= (6000, 17057
m = 1705713057
60004000
=2
c) equation of line
y- y1 =m(x-x1)
13
Expenses Profit
3000 11000
3500 11600
4000 12500
4500 13800
5000 14500
5500 16100
6000 16950
6500 18000
tabler-icon-diamond-filled.svg

Paraphrase This Document

Need a fresh take? Get an instant paraphrase of this document with our AI Paraphraser
Document Page
y-13057 =2 (x-4000)
y-13057=2x-8000
y=2x+5057
b) y intercept is given by putting x =0 in equation of line
y=2*0 +5057
=5057
d) Future profit when expense is £8000
put x=8000 in the equation of line
so profit, y= 2*8000 +5057
y=21057
profit= £21057
QUESTION 7 [9 marks]
The histogram shows weekly customers’ orders in one of the online clothing shop.
20 - 30 30 -50 50 - 70 70 - 90 90 - 110 110 - 130 130 - 150
0
10
20
30
40
50
60
70
80
90
100
110
120
130
140
Online order per purchase price
Order price [£]
Number of orders
14
Document Page
a) How many orders were sold in total? (2 mark)
b) How you describe the shape of the histogram? (2 mark)
c) How many orders were sold below£70? (2 marks)
d) What percent of all sold items are in a range price between £90 – 150? (3 marks)
TYPE YOUR ANSWER TO QUESTION 7 HERE]
7)
a) Total order = 35+90+100+130+85+40+15
=495
b) The shape of the histogram is symmetric nature, because first number of order increases with
increase in order price and after £90 number of order decrease with order price.
c) Order sold below £70 =35+90+100
=225
d) number of orders in £90-150 =85+40+15
=140
Percent of all sold items in range between £90-150= number of oders £ 90150
total number of orders x 100
= 140100
495
= 28.28%
15
Week 8 – NPV
Document Page
QUESTION 8 [ 7 marks]
The owner of a bakery is considering an investment project to purchase new kitchen
equipment. The initial cost is £18,000. The annual cash inflows (income) are projected to be as
follows:
Year 1 Year 2 Year 3 Year 4
£1200 £1500 £900 £600
After 4 years the equipment will be disposed off. The discount rate for this investment is 5%
p.a., compounded annually.
a) Work out the Net Present Value (NPV) of this investment. (5marks)
b) Should the bakery proceed with this project?
Explain your reasoning. (2 marks)
TYPE YOUR ANSWER TO QUESTION 8 HERE]
8)
a) Net Present Value, NPV = - C0+ C1
1+ r + C2
(1+r )2 + C3
(1+r )3 + ..+ C
(1+r )T
C0 =Initial investment
C = Cash flow
r = Discount rate
T = Time
Initial cost =£18000
C1= £1200
C2 = £1500
C3 = £900
C4= £600
r = 0.05
NPV = -18000+ 1200
1+ .05 + 1500
(1+.05)2 + 900
¿ ¿ + 600
¿ ¿
=-14225.523
b) after 4 years NPV value is negative and equipment disposed off , so bakery not proceed with
16
tabler-icon-diamond-filled.svg

Secure Best Marks with AI Grader

Need help grading? Try our AI Grader for instant feedback on your assignments.
Document Page
this project
QUESTION 9 [7marks]
A box contains 2 red pens and 6 blue pens. One pen is taken at random and its colour noted
before being replaced. A second pen is taken.
a) Find the probability that both pens are red (3 marks)
b) Find the probability that that first pen is green and the second one is red. (4 marks)
TYPE YOUR ANSWER TO QUESTION 9 HERE]
9) Probability of getting red pen = 2
8 =0.25
Probability of getting blue pen = 6
8 = 0.75
a)Probability that both pens are red = 2
8 x 1
7 = 0.035714
b)Probability that first pen is blue and second one is red = 6
8 x 2
7
=0.21428
QUESTION 10 [4 marks]
The probability that Julie picks a winning ticket in a lottery is 0.3.
How many losing tickets are in the lottery if there are 390 tickets in total?
TYPE YOUR ANSWER TO QUESTION 10 HERE]
10) Probability of Julie picking a losing ticket = 1-0.3
=0.7
Number of losing tickets in 390 tickets = 0.7x390
= 273 tickets
17
Week 9 – Probability
Document Page
Section 2
In – class activity 25 marks
TASK 1 – Reflective log [5 marks]
This reflective log should develop as the course proceeds and can be the last part to be
completed. Reflect honestly on your experiences throughout the semester. For this reason, you
can use the skills audits to summarise all topics covered during the ten weeks.
In your reflection you must comment on the following points:
Which topics do you feel most confident about?
(e.g. powers and roots, interest rates, NPV etc.)
Are there areas for improvement?
(e.g. in probability, I need do practice more or research etc.)?
How would you evaluate your participation on the module
(e.g. contribution to classes, independent study etc.)?
TYPE YOUR ANSWER TO TASK 1 HERE]
Skills audit I know how to…. I can do
well
I need
practice
I’m not
sure
I can’t
do
1. I understand what a power is
2. I can perform calculations and
simplifications using power

3. I understand what a root is
4. I can perform calculations and
simplifications using roots, using a scientific
or financial calculator if required

5. I understand the idea of simple interest
6. I can perform simple interest calculations
7. I understand the idea of compound interest
8. I can perform compound interest
18
Document Page
calculations using a calculator if required
9. I understand the Rule of 72 (or 69 or 70)
and can apply it.

10. I understand the idea of a linear
relationship between two variables

11. I can manipulate a linear equation to
calculate a variable

12. I can construct a scatter plot from a set of
data (a linear relationship applies) and
apply a line of best fit.

13. I understand the y-intercept and slope
(gradient) of a graph and their relevance to
real situations ( y=mx+c).

14. I can use the scatter plot produced in part
(12) to derive a linear relationship between
two variables ( y=mx+c).

15. I can use the relationship from part (14) to
extrapolate and interpolate

16. I understand the idea of the future value of
money

17. I understand the idea the net present value
(NPV) of a project

18. I can complete a net present value
calculation, using a calculator if required

19. I understand the idea of frequency
distribution

20. I can read and interpret a histogram
21. I can construct a histogram from a set of
data

22. I understand simple probabilities
23. I can perform probability calculations, using
a calculator if required

24. I understand and can perform exchange
rate calculations

TASK 2 [8 marks]
19
tabler-icon-diamond-filled.svg

Paraphrase This Document

Need a fresh take? Get an instant paraphrase of this document with our AI Paraphraser
Document Page
a) Explain the difference between a bar chart and a histogram. Point at least two
characteristics. (4 marks)
b) Create one real – life example that involves simple or compound interest. Support your
example with appropriate calculations. (4 marks)
TYPE YOUR ANSWER TO TASK 2 HERE]
a) Histogram
Histogram refers to a graphical representation, that displays data by bars to show frequency of
numerical data.
Distribution of non discrete variables.
width of bars need not be same.
Bar chart
It is a pictorial representation of data that uses bars to compare different categories of data.
2) Comparison of discrete variables.
3)width of bars are same.
b) Real life example of simple interest is depositing an amount in bank. While depositing money
in bank, the bank will give interest to us. This interest may be simple or compound interest.
Example for simple interest.
Depositing an amount £6000 in bank and simple interest rate of 5% per year. Amount after
2 years is given by A=P(1+rt).
A = Amount
P = principal amount
r = interest rate in decimal
t = time in years
Amount after 2 years, A =6000 (1+.05*2)
=£6600.
20
Document Page
TASK 3 [12 marks]
This section covers the online quiz. You must complete and pass all 3 relevant quiz/activity;
screenshot and save the result’s screen ready to be pasted on the portfolio. Ensure the
followings are visible before the screenshot:
Your full names on the top right-hand corner of the screen
Your test result is any score from 40% to 100%
TYPE YOUR ANSWER TO TASK 3 HERE]
21
chevron_up_icon
1 out of 21
circle_padding
hide_on_mobile
zoom_out_icon
logo.png

Your All-in-One AI-Powered Toolkit for Academic Success.

Available 24*7 on WhatsApp / Email

[object Object]