Data Analysis and Numeracy Report: Statistical Calculations

Verified

Added on  2023/01/11

|9
|1316
|38
Report
AI Summary
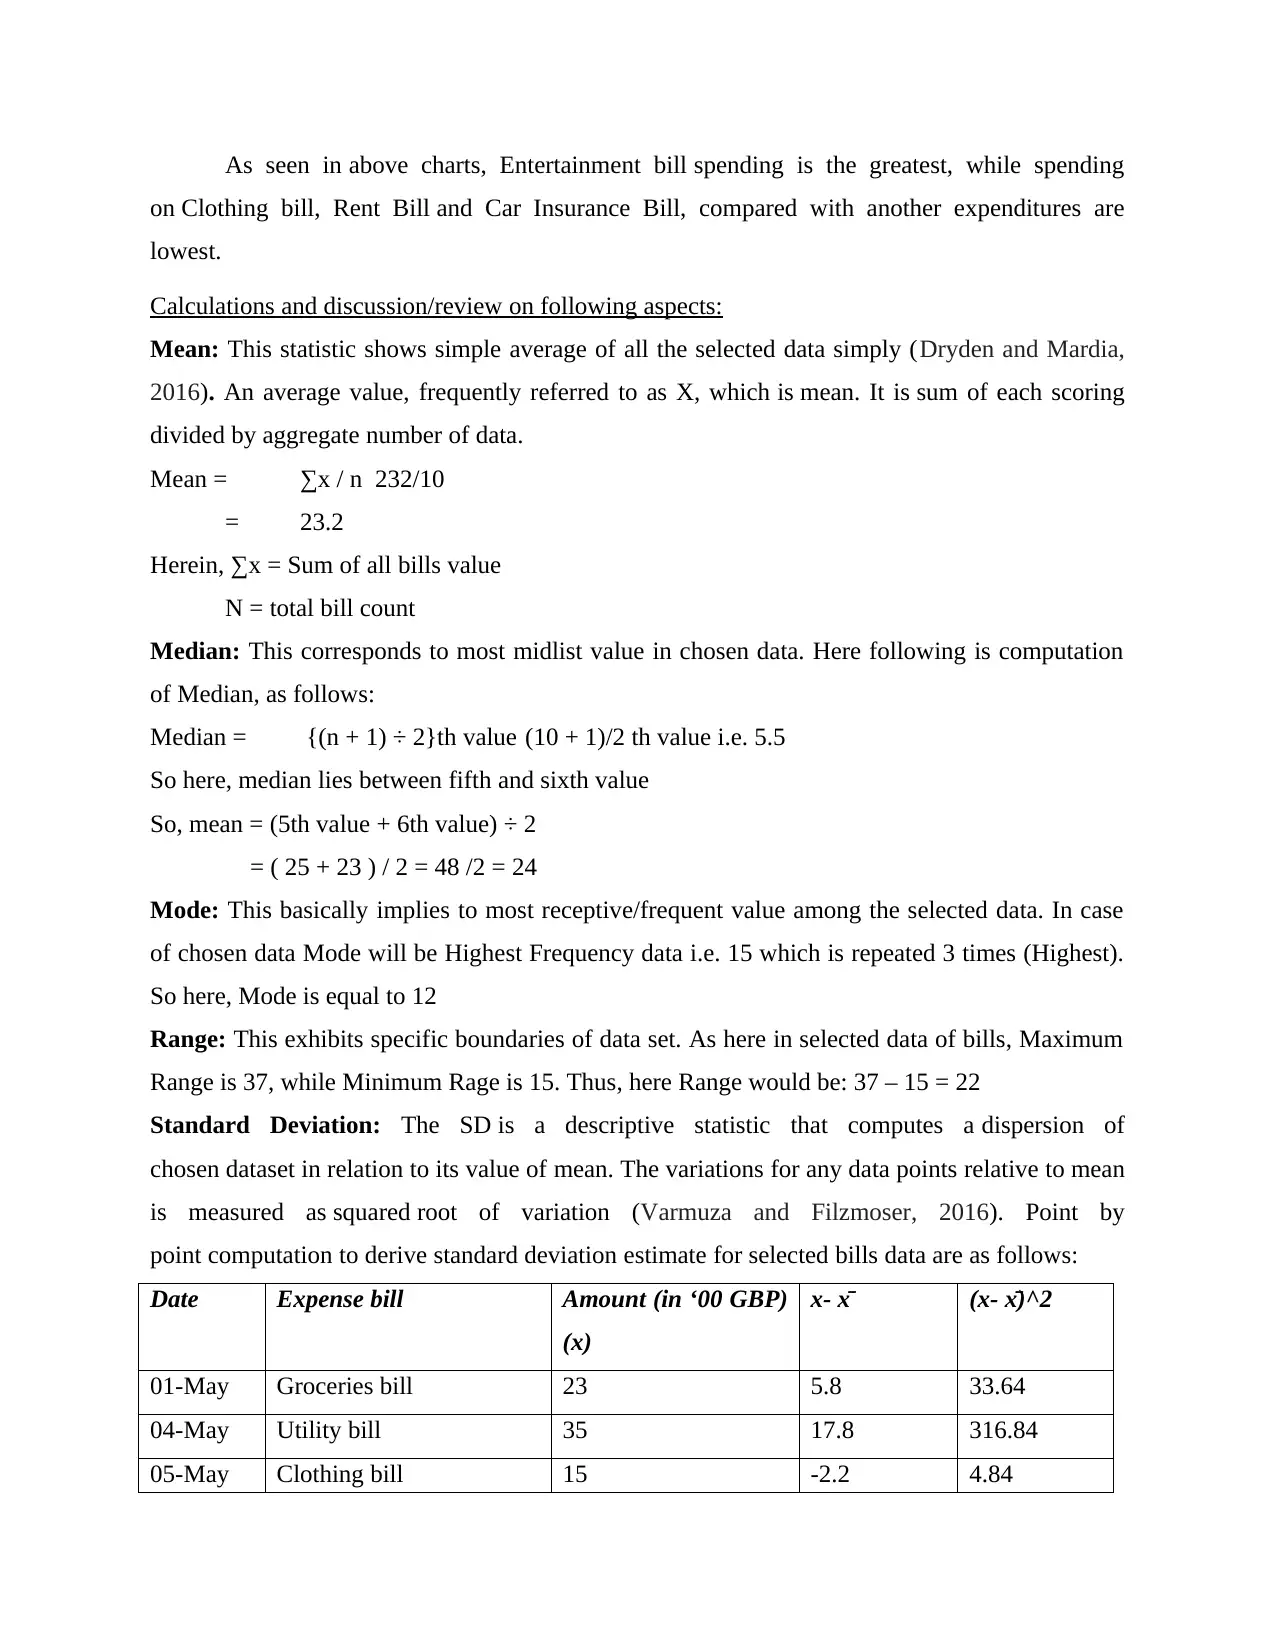
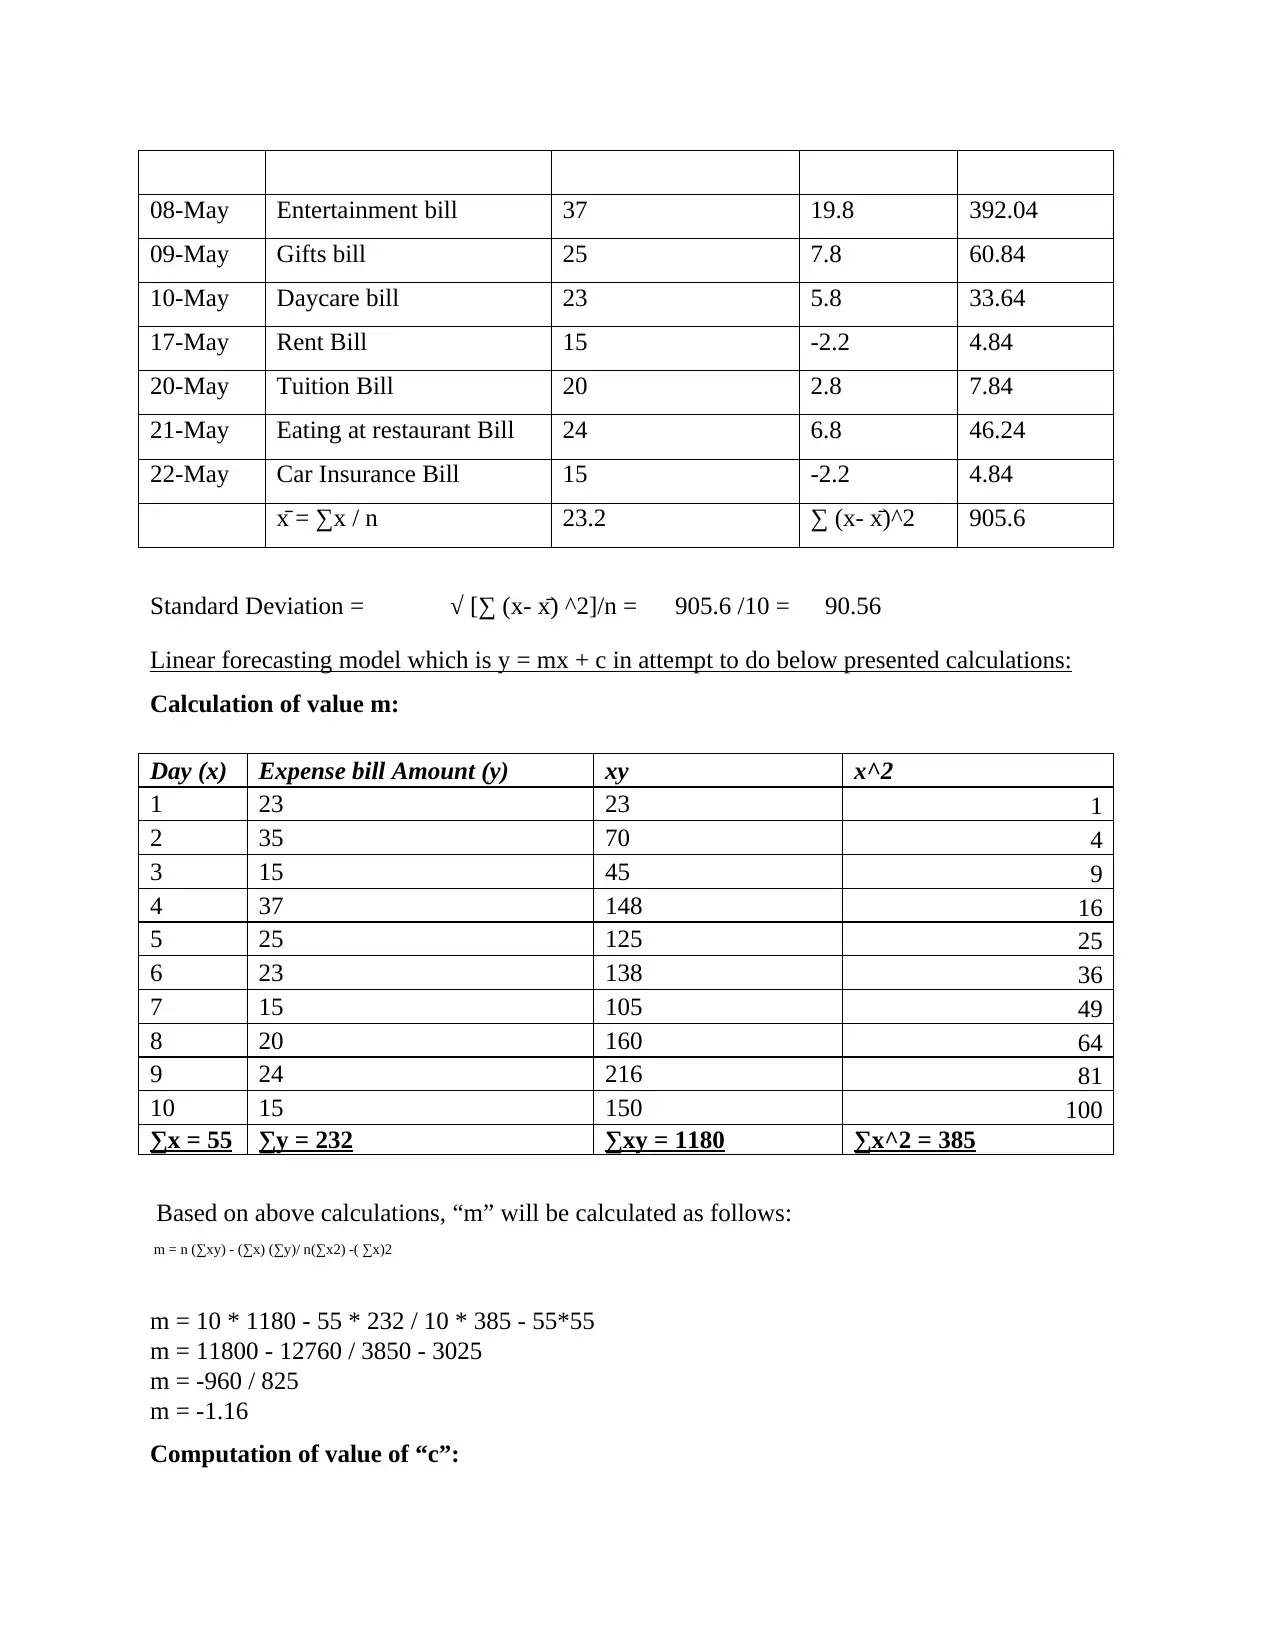
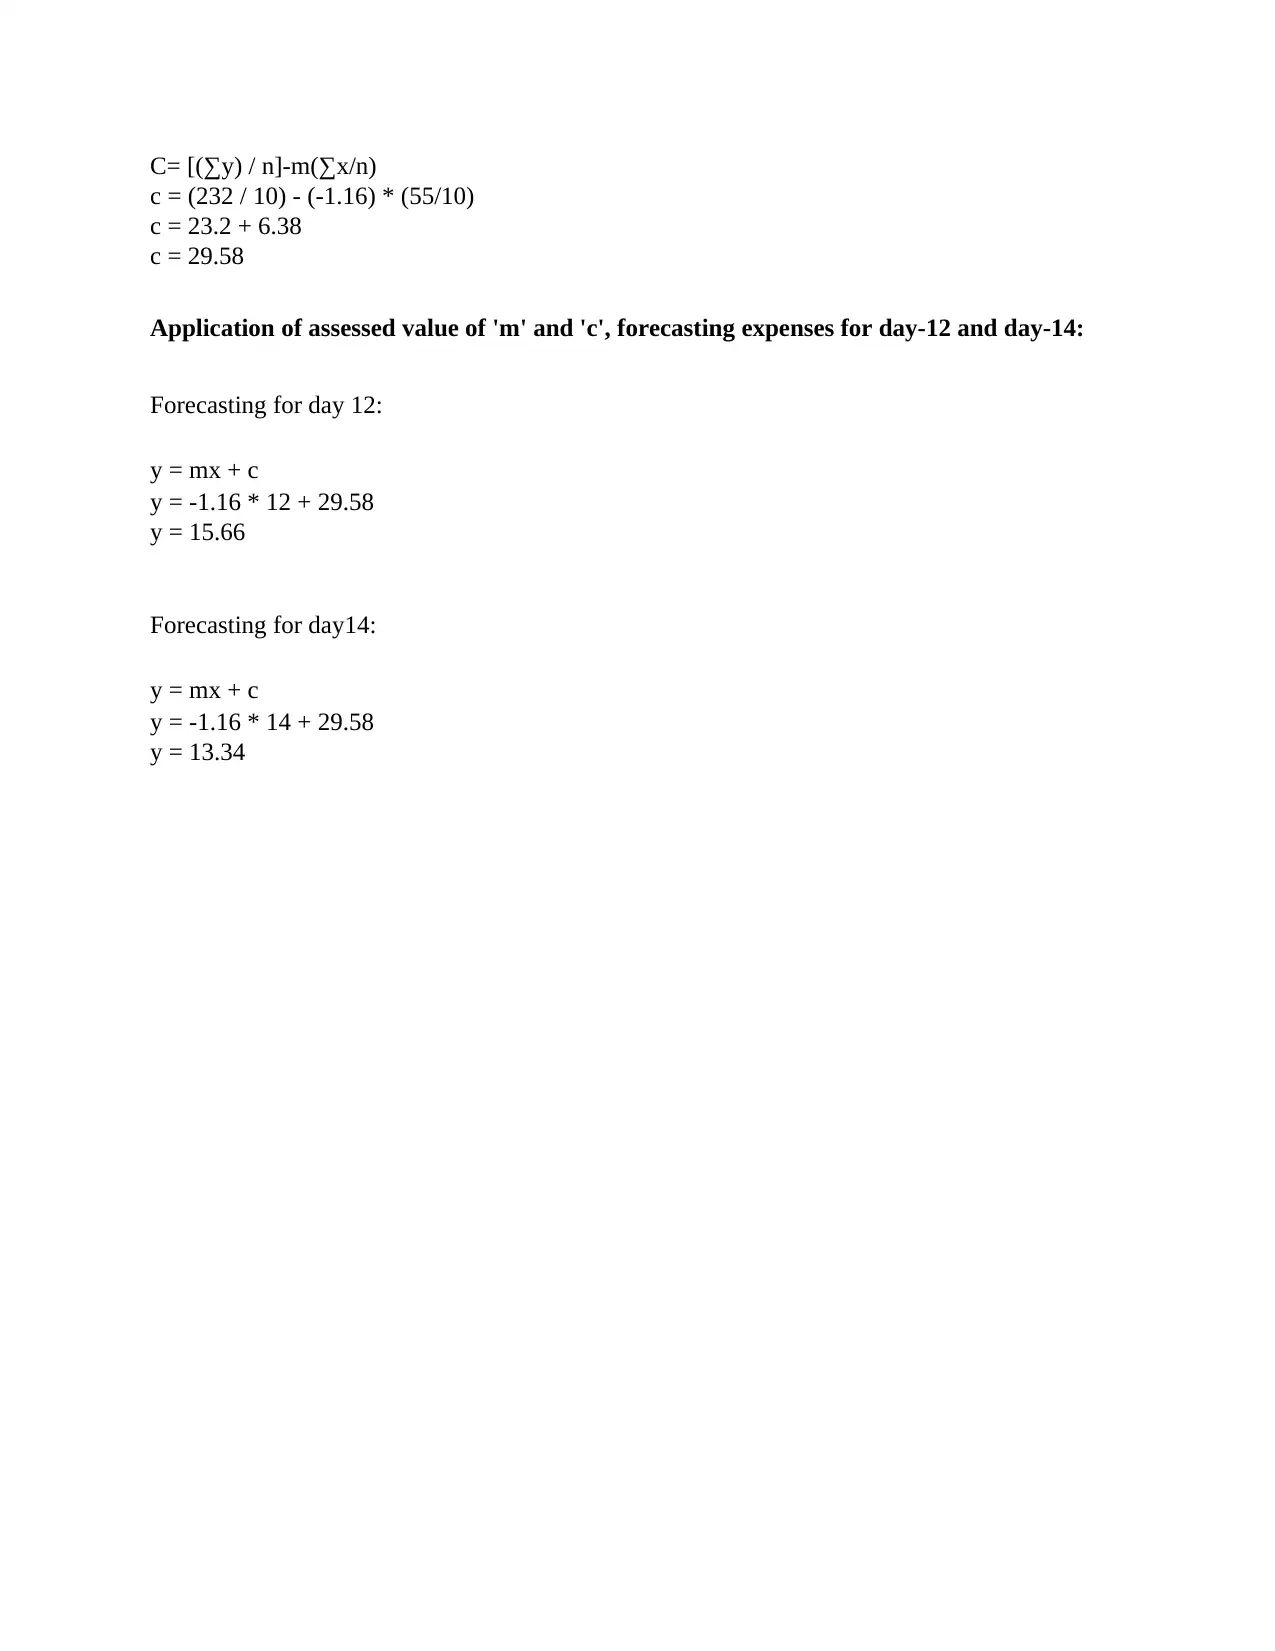
This report analyzes a dataset of 10 recent bill payments using various statistical methods. It begins with an introduction to numeracy and data analysis, followed by the presentation of data in a table and through line and column charts. The main body includes the calculation and discussion of mean, median, mode, range, and standard deviation. A linear forecasting model (y = mx + c) is then applied to estimate bill payments for specific days. The report concludes with a summary of the findings, emphasizing the application of mathematical formulas and statistical measures for accurate predictions and data evaluation. The report uses references to support the analysis.
Document Page
Numeracy and Data
Analysis
tabler-icon-diamond-filled.svg

Paraphrase This Document

Need a fresh take? Get an instant paraphrase of this document with our AI Paraphraser
Document Page
Contents
Contents...........................................................................................................................................2
INTRODUCTION...........................................................................................................................3
MAIN BODY..................................................................................................................................3
Arranging selected data into a table format:................................................................................3
Presentation of chosen data through multiple graphs:.................................................................3
Calculations and discussion/review on following aspects:..........................................................5
Linear forecasting model which is y = mx + c in attempt to do below presented calculations:..6
CONCLUSION................................................................................................................................8
REFERENCES................................................................................................................................9
Document Page
INTRODUCTION
Numeracy relates to ability related to justify and incorporate basic concepts of numeric.
Basic numeracy abilities include understanding of simple arithmetic such as addition,
subtractions, multiplications and division. While data analysis is method/technique of gathering
and arranging data/ raw details so that researcher can extract meaningful
knowledge/insights from it. The key aim of the process of data analysis, in simple words, is to
focus at what data is attempting to tell (Mulligan, 2015). The study-report emphasises on the
various aspects of data analysis and use of statistical methods. Herein report 10 random recent
bill payments have been chosen to apply statistical techniques like mean, mode, SD, median as
well as presentation of data on different graphs. Moreover, this also estimates the bill payment at
21st and 14th day applying linear-forecasting model.
MAIN BODY
Arranging selected data into a table format:
Date Expense bill Amount (in ‘00 GBP)
01-May Groceries bill 23
04-May Utility bill 35
05-May Clothing bill 15
08-May Entertainment bill 37
09-May Gifts bill 25
10-May Day-care bill 23
17-May Rent Bill 15
20-May Tuition Bill 20
21-May Eating at restaurant Bill 24
22-May Car Insurance Bill 15
Presentation of chosen data through multiple graphs:
Line Chart: Data points are depicted by line charts using one or even more horizontal lines. The
diagram helps to distribute categories across horizontal axis and figures along vertical axis.
Here, horizontal line joins the markings and provides a clear view of patterns in results. When
Document Page
displaying information over uniformly distributed times, line charts perform nicely (Jimenez and
Staples, 2015).
Column Chart: Any spreadsheets data in the columns or rows could be taken and plotted
in column charts. Here, horizontal axis of the diagram shows the diagrammatic definitions,
while vertical axis displays charted values. By horizontal axis vertical columns of different
colours reflect desired data creatively. The simple layout and colourful columns create visual
comparisons convenient.
tabler-icon-diamond-filled.svg

Paraphrase This Document

Need a fresh take? Get an instant paraphrase of this document with our AI Paraphraser
Document Page
As seen in above charts, Entertainment bill spending is the greatest, while spending
on Clothing bill, Rent Bill and Car Insurance Bill, compared with another expenditures are
lowest.
Calculations and discussion/review on following aspects:
Mean: This statistic shows simple average of all the selected data simply (Dryden and Mardia,
2016). An average value, frequently referred to as X, which is mean. It is sum of each scoring
divided by aggregate number of data.
Mean = ∑x / n 232/10
= 23.2
Herein, ∑x = Sum of all bills value
N = total bill count
Median: This corresponds to most midlist value in chosen data. Here following is computation
of Median, as follows:
Median = {(n + 1) ÷ 2}th value (10 + 1)/2 th value i.e. 5.5
So here, median lies between fifth and sixth value
So, mean = (5th value + 6th value) ÷ 2
= ( 25 + 23 ) / 2 = 48 /2 = 24
Mode: This basically implies to most receptive/frequent value among the selected data. In case
of chosen data Mode will be Highest Frequency data i.e. 15 which is repeated 3 times (Highest).
So here, Mode is equal to 12
Range: This exhibits specific boundaries of data set. As here in selected data of bills, Maximum
Range is 37, while Minimum Rage is 15. Thus, here Range would be: 37 – 15 = 22
Standard Deviation: The SD is a descriptive statistic that computes a dispersion of
chosen dataset in relation to its value of mean. The variations for any data points relative to mean
is measured as squared root of variation (Varmuza and Filzmoser, 2016). Point by
point computation to derive standard deviation estimate for selected bills data are as follows:
Date Expense bill Amount (in ‘00 GBP)
(x)
x- x̄ (x- x̄)^2
01-May Groceries bill 23 5.8 33.64
04-May Utility bill 35 17.8 316.84
05-May Clothing bill 15 -2.2 4.84
Document Page
08-May Entertainment bill 37 19.8 392.04
09-May Gifts bill 25 7.8 60.84
10-May Daycare bill 23 5.8 33.64
17-May Rent Bill 15 -2.2 4.84
20-May Tuition Bill 20 2.8 7.84
21-May Eating at restaurant Bill 24 6.8 46.24
22-May Car Insurance Bill 15 -2.2 4.84
x̄ = ∑x / n 23.2 (x- x̄)^2 905.6
Standard Deviation = √ [∑ (x- x̄) ^2]/n = 905.6 /10 = 90.56
Linear forecasting model which is y = mx + c in attempt to do below presented calculations:
Calculation of value m:
Day (x) Expense bill Amount (y) xy x^2
1 23 23 1
2 35 70 4
3 15 45 9
4 37 148 16
5 25 125 25
6 23 138 36
7 15 105 49
8 20 160 64
9 24 216 81
10 15 150 100
∑x = 55 ∑y = 232 ∑xy = 1180 ∑x^2 = 385
Based on above calculations, “m” will be calculated as follows:
m = n (∑xy) - (∑x) (∑y)/ n(∑x2) -( ∑x)2
m = 10 * 1180 - 55 * 232 / 10 * 385 - 55*55
m = 11800 - 12760 / 3850 - 3025
m = -960 / 825
m = -1.16
Computation of value of “c”:
Document Page
C= [(∑y) / n]-m(∑x/n)
c = (232 / 10) - (-1.16) * (55/10)
c = 23.2 + 6.38
c = 29.58
Application of assessed value of 'm' and 'c', forecasting expenses for day-12 and day-14:
Forecasting for day 12:
y = mx + c
y = -1.16 * 12 + 29.58
y = 15.66
Forecasting for day14:
y = mx + c
y = -1.16 * 14 + 29.58
y = 13.34
tabler-icon-diamond-filled.svg

Paraphrase This Document

Need a fresh take? Get an instant paraphrase of this document with our AI Paraphraser
Document Page
CONCLUSION
From the above study it has been analysed that numeracy and data analysis are much wider
areas which involve use of mathematical formulas as well as statistical measures to make
accurate predictions. These also help to evaluate data thoroughly and support the predications
already made.
Document Page
REFERENCES
Books and Journals:
Mulligan, J., 2015. Moving beyond basic numeracy: data modeling in the early years of
schooling. ZDM, 47(4), pp.653-663..
Jimenez, B.A. and Staples, K., 2015. Access to the common core state standards in mathematics
through early numeracy skill building for students with significant intellectual
disability. Education and Training in Autism and Developmental Disabilities, pp.17-30.
Varmuza, K. and Filzmoser, P., 2016. Introduction to multivariate statistical analysis in
chemometrics. CRC press.
Dryden, I.L. and Mardia, K.V., 2016. Statistical shape analysis: with applications in R (Vol.
995). John Wiley & Sons.
chevron_up_icon
1 out of 9
circle_padding
hide_on_mobile
zoom_out_icon
[object Object]