Patient Falls, Pressure Ulcers, and Nurse Staffing Study
VerifiedAdded on 2022/11/16
|24
|11914
|298
Report
AI Summary
This report, "Are Patient Falls and Pressure Ulcers Sensitive to Nurse Staffing?" published in the Western Journal of Nursing Research, evaluates the existing research linking nurse staffing levels to patient outcomes, specifically focusing on patient falls and pressure ulcers. The study examines eleven studies that employed multivariate analysis to discern the effect of nurse staffing on patient falls and pressure ulcers in hospitals. The article contrasts these studies based on their data sources, measures, data analysis techniques, risk adjustment methods, and reported results. The findings indicate that the evidence of an effect of nursing hours or skill mix on patient falls and pressure ulcers is equivocal due to differences in research methods. The report identifies two study types based on staffing measurement levels and suggests improvements in measurement and methods. The study also provides background on theoretical frameworks, adverse events, and risk adjustment in nursing outcomes research, offering a comprehensive overview of the complexities and challenges within this field. The research aims to guide practice and further scientific investigation into the relationship between nursing resources and patient safety.
654
Are Patient Falls and
Pressure Ulcers Sensitive
to Nurse Staffing?
Eileen T. Lake
Robyn B. Cheung
University of Pennsylvania
Research has demonstrated an association between more nurses and more
qualified nursing staff in hospitals and better patient outcomes. Patient falls
and pressure ulcers have been advanced as nursing-sensitive outcomes. This
article evaluates the state of the science linking nurse staffing to falls and
pressure ulcers. Studies that employed multivariate analysis to discern the
effect of nurse staffing on patient falls and pressure ulcers in hospitals were
evaluated. Eleven studies that met inclusion criteria were contrasted on their
data sources and measures, data analysis, risk adjustment, and results. The
evidence of an effect of nursing hours or skill mix on patient falls and pres-
sure ulcers is equivocal. Substantial differences in research methods across
studies may account for the mixed findings. Two study types were identified
based on the level at which nurse staffing was measured, hospital or nurs-
ing unit, which exhibited systematic differences in measures and methods.
Improvements in measurement and methods are suggested.
Keywords: nurse staffing; pressure ulcers; patient falls; multilevel research
methods
The quantity and quality of nursing care are expected to influence the
occurrence of patient falls and pressure ulcers. Some of these events are
preventable given sufficient nursing resources to assess risk and implement
Western Journal of
Nursing Research
Volume 28 Number 6
October 2006 654-677
© 2006 Sage Publications
10.1177/0193945906290323
http://wjn.sagepub.com
hosted at
http://online.sagepub.com
Authors’ Note: This article was funded in part by grants from the University of Pennsylvania
Research Foundation, the Xi Chapter, Sigma Theta Tau International, and the National Institute
of Nursing Research, National Institutes of Health (Grant NR009068) to Dr. Lake and by an
institutional postdoctoral fellowship (National Institute of Nursing Research, National Institutes
of Health, Grant T32-NR07104) to Dr. Cheung. Dr. Cheung compiled and summarized the
empirical literature. Dr. Lake prepared the critical review of the empirical literature, developed
the tables, and developed the contributions to the science on staffing, falls, and pressure ulcers.
We appreciate the thoughtful review and helpful comments of the anonymous reviewers.
at University of Ulster Library on January 4, 2015wjn.sagepub.comDownloaded from
Paraphrase This Document
Need a fresh take? Get an instant paraphrase of this document with our AI Paraphraser
Lake, Cheung / Nurse Staffing and Adverse Events 655
prevention strategies. Since 1996, the American Nurses Association (1999)
has considered falls and pressure ulcers to be “nursing-sensitive quality indi-
cators.” The National Quality Forum (2004) recently endorsed both falls and
pressure ulcers as core measures of nursing care performance in hospitals.
The Institute of Medicine’s (IOM) landmark volume (Wunderlich, Sloan, &
Davis, 1996) revealed the dearth of empirical evidence on the relationships
between nurse staffing and quality of care. The theoretical basis for a link
among staffing, falls, and pressure ulcers, coupled with the IOM’s research
recommendations prompted scientific investigation of this link. A decade of
research can now be assessed to determine whether there is clear evidence
to guide practice and research. More broadly, the state of the science on this
question can be considered an exemplar of theoretical issues and method-
ological challenges in the field of nursing outcomes research.
The purposes of this article are to present and evaluate the state of the
science linking nurse staffing to patient falls and pressure ulcers and to
identify research methods to advance the science. To prepare the reader for
an evaluation of this science, the Background section provides an overview
of theoretical frameworks in nursing outcomes research, an initial descrip-
tion of the adverse events and measurement issues, and an overview of risk
adjustment in outcomes research.
Background
The Theoretical Link
Several theoretical or conceptual frameworks for the relationships
between nursing organizational factors and outcomes have been proposed
(Aiken, Sochalski, & Lake, 1997; Irvine, Sidani, & Hall, 1998; Mark,
Sayler, & Smith, 1996; Mitchell, Ferketich, Jennings, & American Academy
of Nursing Expert Panel on Quality Health Care, 1998). Mark et al. (1996)
theorized that both the hospital organizational context (i.e., environment and
technology) and the nursing unit structure (e.g., nurse–physician collabora-
tion) influence outcomes. They considered nursing skill mix and education
mix as context variables but did not mention staffing ratios. Aiken etal.
(1997) proposed that organizational models,such as magnet hospitals or
dedicated AIDS units, achieve better patient and nurse outcomes via
enhanced nurse autonomy, nurses’ control over the work environment, and
nurses’ relations with physicians. A subsequent framework incorporated
nurse staffing ratios and skill mix as hospital organizational features that
at University of Ulster Library on January 4, 2015wjn.sagepub.comDownloaded from
affect outcomes (Aiken,Clarke, & Sloane, 2002). Mitchell et al. (1998)
developed the quality health outcomes model, positing reciprocal relations
among system characteristics, interventions, client characteristics, and out-
comes; they identified nursing skill mix as a system characteristic. Irvine
et al. (1998) developed a nursing role effectiveness model that specified
nursing staff mix and workload as structural variables in a causal chain influ-
encing outcomes. Collectively, these models describe a theoretical link
between nurse staffing and patient outcomes and provide the basis for empir-
ical investigations of nurse staffing, patient falls, and pressure ulcers.
The nursing role, encompassing both surveillance and care, makes nurses
uniquely suited to prevent falls and pressure ulcers. The patients at greatest
risk of these events and the best prevention protocols have been well docu-
mented (Ayello & Braden, 2001; Olson et al., 1996; Rutledge, Donaldson,
& Pravikoff, 2003). Several basic elements of prevention, such as systematic
falls risk assessment once a shift or more and repositioning every 2 hours
for pressure ulcer prevention,depend directly on staff availability. Thus,
patients in better staffed hospitals may be expected to experience fewer falls
or pressure ulcers. Some preventive efforts may be provided by staff that are
not registered nurses (RNs). The key staffing component may be hours of
nursing care by all licensed staff (i.e., RNs and licensed practical nurses,
LPNs) or by total nursing staff rather than RN hours.
Occurrence of Falls and Pressure Ulcers
Falls and pressure ulcers occur rarely. Their frequency can be calculated
as rates of incidence (number of new cases occurring over a given period;
e.g., per 1,000 patient days) or rates of prevalence (a count or proportion of
a population observed at one time point that has the condition of interest;
Frantz, 1997). Falls incidence among hospital inpatients has been reported
as ranging from 2.3 to 7.0 falls per 1,000 patient days (Hitcho et al., 2004).
A large observational study revealed that 7% of medical–surgical and inten-
sive care patients developed pressure ulcers (Stages I through necrotic)
after hospital admission (Whittington, Patrick, & Roberts, 2000).
Risk Adjustment in Outcomes Research
Differences across patients influence the likelihood of an adverse event
(Iezzoni, 2003). In outcomes research, if differences in patients across orga-
nizational settings (hospitals or nursing units) are not controlled for, spuri-
ous relationships might be identified. Better staffed units may appear to
656 Western Journal of Nursing Research
at University of Ulster Library on January 4, 2015wjn.sagepub.comDownloaded from
⊘ This is a preview!⊘
Do you want full access?
Subscribe today to unlock all pages.
Trusted by 1+ million students worldwide
have poorer outcomes, when, in fact, the better staffing is because of a
sicker, higher risk patient group. The matter of differential risk is important
because most of the variation in adverse outcomes derives from patient
characteristics not hospital characteristics such as resources available for
treatment (Silber, Rosenbaum, & Ross, 1995). “It is vastly better to be a
little healthier than to go to a well-equipped hospital with a superior staff”
(Silber et al., 1995, p. 11).
In a multivariate model, there are several ways to account for the
patient’s contribution to the likelihood of the adverse event. The best way
is to include a measure of the patient’s risk for the specific outcome. Several
risk assessment scales for these adverse events are commonly used in acute
care: Morse (1996) and Schmid (1990) for falls risk and Braden (Braden &
Maklebust, 2005) and Norton (1996) for pressure ulcers. The patient’s risk
status (at risk or not) and risk score would be included in a patient-level
model predicting whether the patient did or did not have the adverse event.
Unfortunately, such risk data are not often available.
The second best way to account for differences across patients is to
include a measure of the patient’s severity of illness. A variety of severity
of illness measures have been developed based on medical record review or
discharge abstracts (Kane, 2006). These measures may focus on the physi-
ological severity of the principal diagnosis (the principal basis for the hos-
pital stay) and/or the number and severity of comorbid conditions.
A third way to measure differences across patients is by their differential
nursing care needs, or nursing acuity. The expectation is that patients with
greater nursing care needs are more likely to be at risk for adverse events.
Patients are classified daily according to a variety of factors that may include
physical activity, hygiene, feeding, medications, vital signs, and treatment.
Researchers may use aggregate measures to adjust for patient mix. An
example is the Medicare case mix index (CMI), which reflects the average
resources needed to care for the diagnostic mix of elderly patients in a hos-
pital or nursing unit. Although the CMI may be a proxy for patient mix in
an institution, it may not be suitable or sufficient for case mix adjustment
of younger adults or children. Sometimes researchers account for case mix
differences across institutions by conducting separate analyses for different
clinical subgroups of patients identified by nursing unit types or diagnoses.
This method does not account for severity of illness differences within clin-
ical subgroups.
In summary, risk adjustment approaches cover a range from the most
preferable but least available data (patient-specific risk data) to the least
preferable but most available (aggregated case mix or clinical data). The
Lake, Cheung / Nurse Staffing and Adverse Events 657
at University of Ulster Library on January 4, 2015wjn.sagepub.comDownloaded from
Paraphrase This Document
Need a fresh take? Get an instant paraphrase of this document with our AI Paraphraser
choice of risk adjustment approach is generally dictated by data availa-
bility. Researchers may use multiple approaches simultaneously to take
advantage of all available data.
Method
The study design was critical analysis of empirical studies of the rela-
tionships among nurse staffing, falls, and pressure ulcers in hospitals. To
identify articles, multiple databases (CINAHL, PubMed, OVID) and terms
(nurse staffing, work environment, falls, pressure ulcers, patient outcomes)
were searched from their earliest dates through October 2005. The most
efficient search was obtained via PubMed with the terms nurse staffing and
pressure ulcer, or nurse staffing and falls. This database and strategy
yielded 37 articles. The inclusion criteria were publication in a peer-
reviewed journal, research about an acute care setting,falls or pressure
ulcers as outcomes of interest, and multivariate analysis of staffing and one
or both outcomes. Eleven studies met the criteria.
The analysis began with a description of the research design and findings.
Then, studies were compared on the clinical composition of the patient sam-
ple, the adverse event rates, the data sources and measures of nurse staffing
and adverse events, the data analyses, and the risk adjustment approaches.
These features were assessed to determine if certain samples,measures,
methods, or events consistently yielded significant or null findings.
Findings
In one study, nurse staffing was measured at the nurse level (Krauss etal.,
2005). In this innovative and intensive, prospective, case-control study, 98
patients who fell were matched to 318 controls randomly selected from all
inpatients and matched on length of stay at the point the fall occurred. The
other studies could be differentiated by the organizational level for nurse
staffing: nursing unit or hospital. The organizational level was the key design
feature associated with systematic differences in adverse event measurement
and risk adjustment methods across studies. Studies were classified into two
groups by level (Table 1). In five studies, hospital-level staffing was linked to
hospital- or patient-level adverse events (Table 1, Panel A). These studies had
from 200 to 800 hospitals and from 100,000 to 6 million patients. In five stud-
ies, both staffing and adverse events were measured at the nursing unit level
658 Western Journal of Nursing Research
at University of Ulster Library on January 4, 2015wjn.sagepub.comDownloaded from
(Panel B). These studies had from 39 to 1,751 nursing units in 1 to 282 hos-
pitals. The Krauss et al. (2005) study is displayed in Panel B of Table 1.
Effect of Staffing on Falls and Pressure Ulcers
For each study, for the respective adverse events, Table 1 shows whether
the results across one or more analyses linking staffing measures to the
event were all significant, all not significant, or mixed (some significant and
others not). Falls were an outcome in eight studies. The results were sig-
nificant in two, mixed in three, and not significant in three. Pressure ulcers
were analyzed in seven studies. The results were significant in two, mixed
in three, and not significant in two. This initial picture suggests that the
evidence linking nurse staffing to these two events is inconclusive.
The inconclusive results may indicate a weak effect of staffing on these
events. An alternative explanation is that methodological limitations in
the literature prevent significant effects from being detected. An informed
judgment about the evidence requires a careful assessment of the methods.
Adverse Event Measurement and Frequency
Falls. For hospital-level studies, adverse events were identified by diag-
nosis or event codes in patient discharge abstracts in administrative data sets.
Cho, Ketefian, Barkauskas, and Smith (2003) used diagnosis codes indicat-
ing falls “with injury” among patients hospitalized for common surgeries in
California in 1997. Unruh (2003) used event codes indicating a low-level fall
or an accidental fall from a bed or chair for all medical and surgical patients
in Pennsylvania hospitals in 1991 to 1997. The fall rates from these studies
were trivial—less than 1% (Table 1). The rate detected by Unruh was more
than double the rate detected by Cho et al. This difference may reflect the
fact that most falls do not result in injury and that medical patients have
higher fall rates than do surgical patients (Hitcho et al., 2004). Rate com-
parisons across these different data sources may be inappropriate.
For nursing unit studies, falls were identified from incident reports. The
incidence ranged from 2 to 4 falls per 1,000 patient days. Blegen, Goode,
and Reed (1998) studied all 42 acute units in one hospital. Blegen and Vaughn
(1998) studied 39 medical/surgical, intensive care, obstetrics, and skilled
units in 11 hospitals. The fall rate was highest for skilled (4.0) and medical/
surgical units (2.7) and lowest for intensive care (1.4) and obstetrics (0.4).
Dunton, Gajewski, Taunton, and Moore (2004) studied data from 2,351
medical, surgical, step-down, and critical care units in 282 hospitals in
Lake, Cheung / Nurse Staffing and Adverse Events 659
at University of Ulster Library on January 4, 2015wjn.sagepub.comDownloaded from
⊘ This is a preview!⊘
Do you want full access?
Subscribe today to unlock all pages.
Trusted by 1+ million students worldwide
660
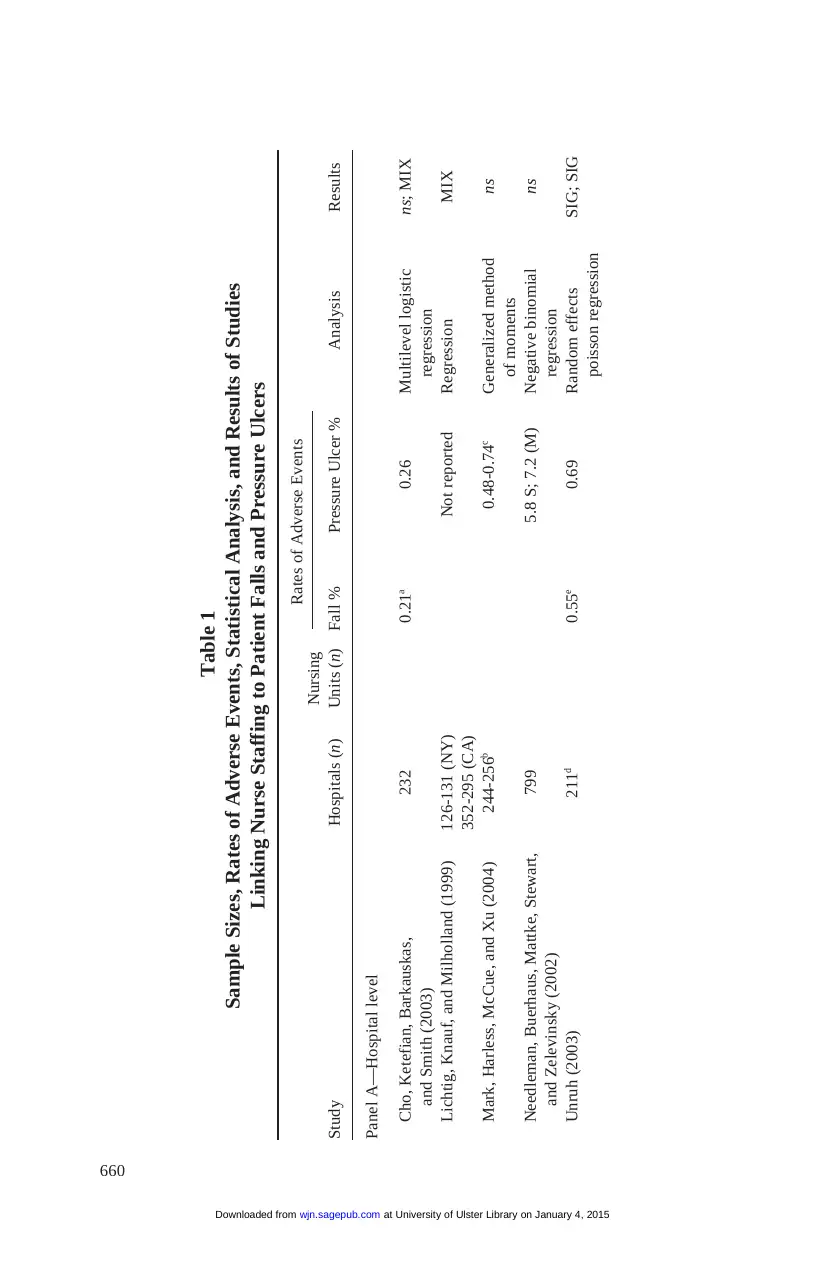
Table 1
Sample Sizes, Rates of Adverse Events, Statistical Analysis, and Results of Studies
Linking Nurse Staffing to Patient Falls and Pressure Ulcers
Nursing
Rates of Adverse Events
Study Hospitals (n) Units (n) Fall % Pressure Ulcer % Analysis Results
Panel A—Hospital level
Cho, Ketefian, Barkauskas, 232 0.21a 0.26 Multilevel logistic ns; MIX
and Smith (2003) regression
Lichtig, Knauf, and Milholland (1999) 126-131 (NY) Not reported Regression MIX
352-295 (CA)
Mark, Harless, McCue, and Xu (2004) 244-256b 0.48-0.74c Generalized method ns
of moments
Needleman, Buerhaus, Mattke, Stewart, 799 5.8 S; 7.2 (M) Negative binomial ns
and Zelevinsky (2002) regression
Unruh (2003) 211d 0.55e 0.69 Random effects SIG; SIG
poisson regression
at University of Ulster Library on January 4, 2015wjn.sagepub.comDownloaded from
Paraphrase This Document
Need a fresh take? Get an instant paraphrase of this document with our AI Paraphraser
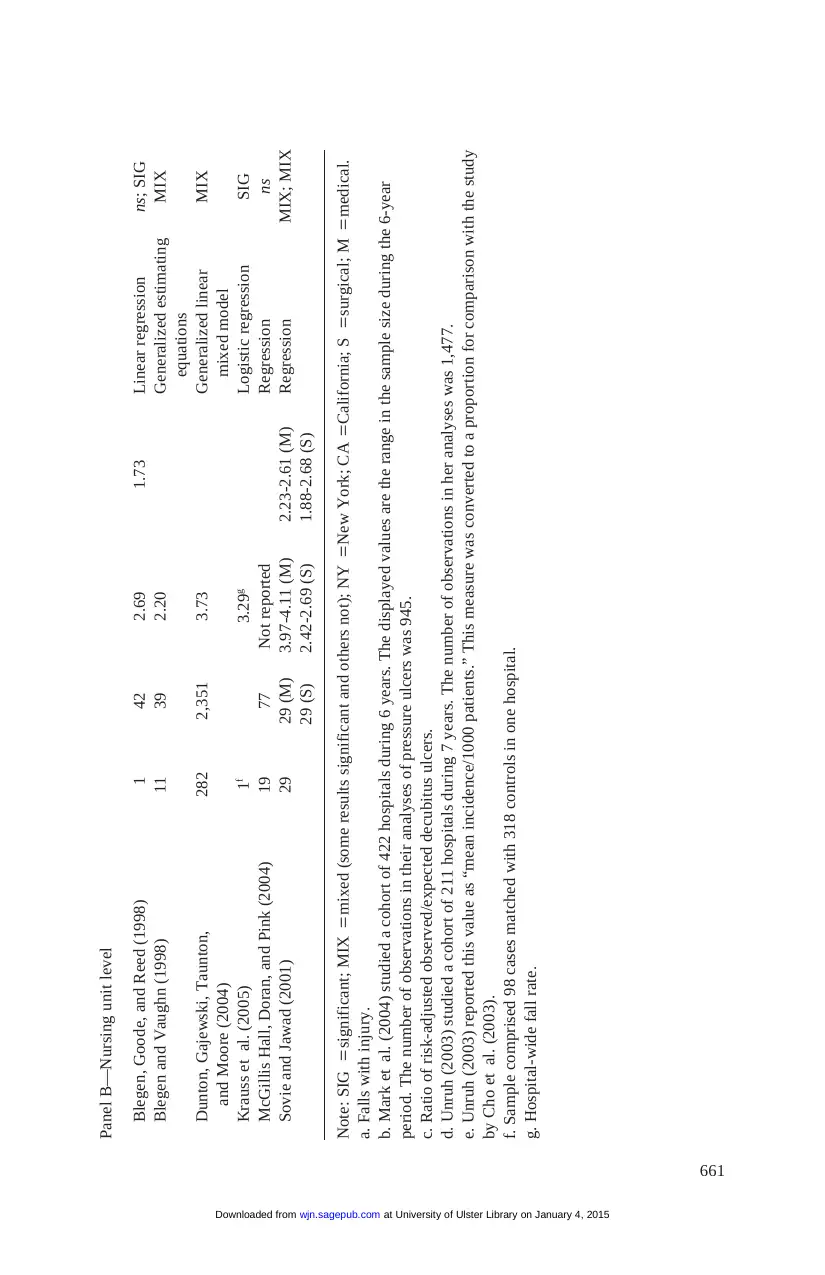
661
Panel B—Nursing unit level
Blegen, Goode, and Reed (1998) 1 42 2.69 1.73 Linear regression ns; SIG
Blegen and Vaughn (1998) 11 39 2.20 Generalized estimating MIX
equations
Dunton, Gajewski, Taunton, 282 2,351 3.73 Generalized linear MIX
and Moore (2004) mixed model
Krauss et al. (2005) 1f 3.29g Logistic regression SIG
McGillis Hall, Doran, and Pink (2004) 19 77 Not reported Regression ns
Sovie and Jawad (2001) 29 29 (M) 3.97-4.11 (M) 2.23-2.61 (M) Regression MIX; MIX
29 (S) 2.42-2.69 (S) 1.88-2.68 (S)
Note: SIG =significant; MIX =mixed (some results significant and others not); NY =New York; CA =California; S =surgical; M =medical.
a. Falls with injury.
b. Mark et al. (2004) studied a cohort of 422 hospitals during 6 years. The displayed values are the range in the sample size during the 6-year
period. The number of observations in their analyses of pressure ulcers was 945.
c. Ratio of risk-adjusted observed/expected decubitus ulcers.
d. Unruh (2003) studied a cohort of 211 hospitals during 7 years. The number of observations in her analyses was 1,477.
e. Unruh (2003) reported this value as “mean incidence/1000 patients.” This measure was converted to a proportion for comparison with the study
by Cho et al. (2003).
f. Sample comprised 98 cases matched with 318 controls in one hospital.
g. Hospital-wide fall rate.
at University of Ulster Library on January 4, 2015wjn.sagepub.comDownloaded from
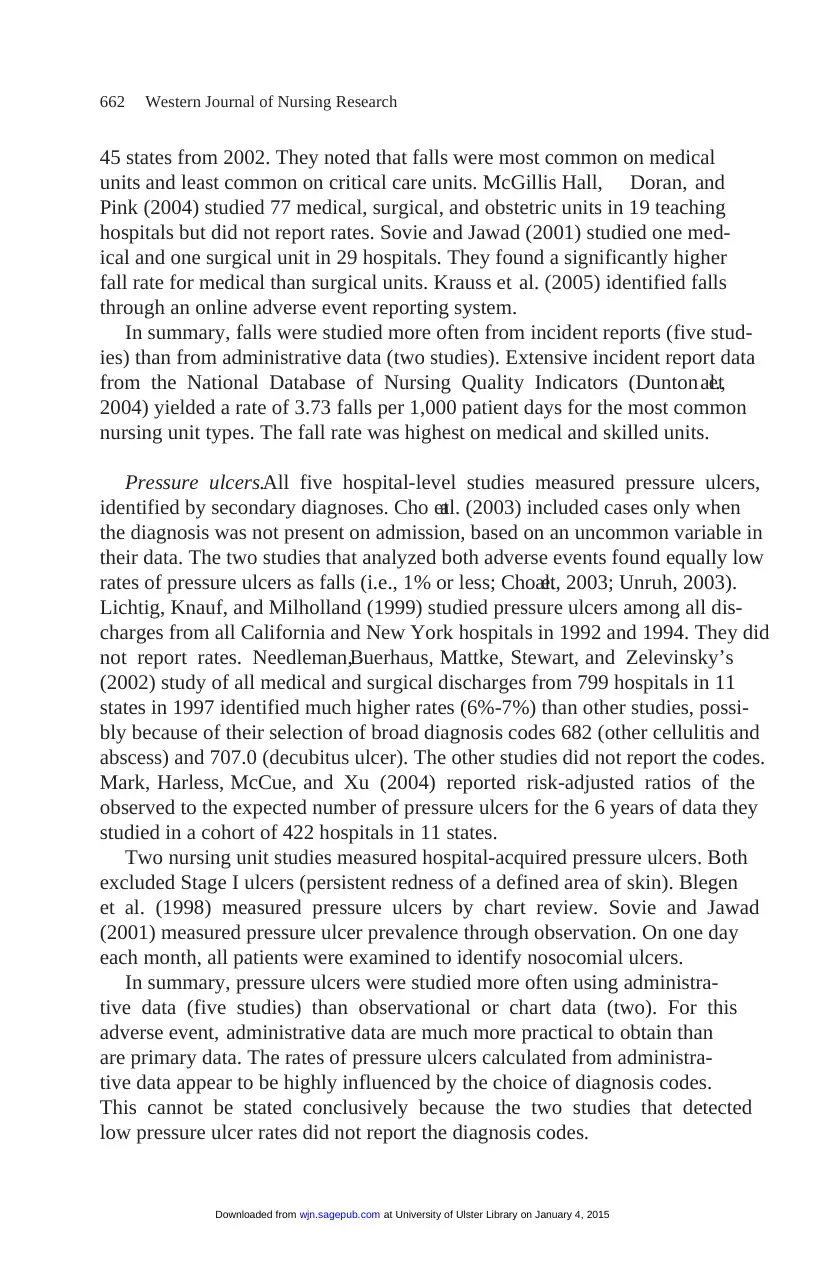
45 states from 2002. They noted that falls were most common on medical
units and least common on critical care units. McGillis Hall, Doran, and
Pink (2004) studied 77 medical, surgical, and obstetric units in 19 teaching
hospitals but did not report rates. Sovie and Jawad (2001) studied one med-
ical and one surgical unit in 29 hospitals. They found a significantly higher
fall rate for medical than surgical units. Krauss et al. (2005) identified falls
through an online adverse event reporting system.
In summary, falls were studied more often from incident reports (five stud-
ies) than from administrative data (two studies). Extensive incident report data
from the National Database of Nursing Quality Indicators (Dunton etal.,
2004) yielded a rate of 3.73 falls per 1,000 patient days for the most common
nursing unit types. The fall rate was highest on medical and skilled units.
Pressure ulcers.All five hospital-level studies measured pressure ulcers,
identified by secondary diagnoses. Cho etal. (2003) included cases only when
the diagnosis was not present on admission, based on an uncommon variable in
their data. The two studies that analyzed both adverse events found equally low
rates of pressure ulcers as falls (i.e., 1% or less; Cho etal., 2003; Unruh, 2003).
Lichtig, Knauf, and Milholland (1999) studied pressure ulcers among all dis-
charges from all California and New York hospitals in 1992 and 1994. They did
not report rates. Needleman,Buerhaus, Mattke, Stewart, and Zelevinsky’s
(2002) study of all medical and surgical discharges from 799 hospitals in 11
states in 1997 identified much higher rates (6%-7%) than other studies, possi-
bly because of their selection of broad diagnosis codes 682 (other cellulitis and
abscess) and 707.0 (decubitus ulcer). The other studies did not report the codes.
Mark, Harless, McCue, and Xu (2004) reported risk-adjusted ratios of the
observed to the expected number of pressure ulcers for the 6 years of data they
studied in a cohort of 422 hospitals in 11 states.
Two nursing unit studies measured hospital-acquired pressure ulcers. Both
excluded Stage I ulcers (persistent redness of a defined area of skin). Blegen
et al. (1998) measured pressure ulcers by chart review. Sovie and Jawad
(2001) measured pressure ulcer prevalence through observation. On one day
each month, all patients were examined to identify nosocomial ulcers.
In summary, pressure ulcers were studied more often using administra-
tive data (five studies) than observational or chart data (two). For this
adverse event, administrative data are much more practical to obtain than
are primary data. The rates of pressure ulcers calculated from administra-
tive data appear to be highly influenced by the choice of diagnosis codes.
This cannot be stated conclusively because the two studies that detected
low pressure ulcer rates did not report the diagnosis codes.
662 Western Journal of Nursing Research
at University of Ulster Library on January 4, 2015wjn.sagepub.comDownloaded from
⊘ This is a preview!⊘
Do you want full access?
Subscribe today to unlock all pages.
Trusted by 1+ million students worldwide
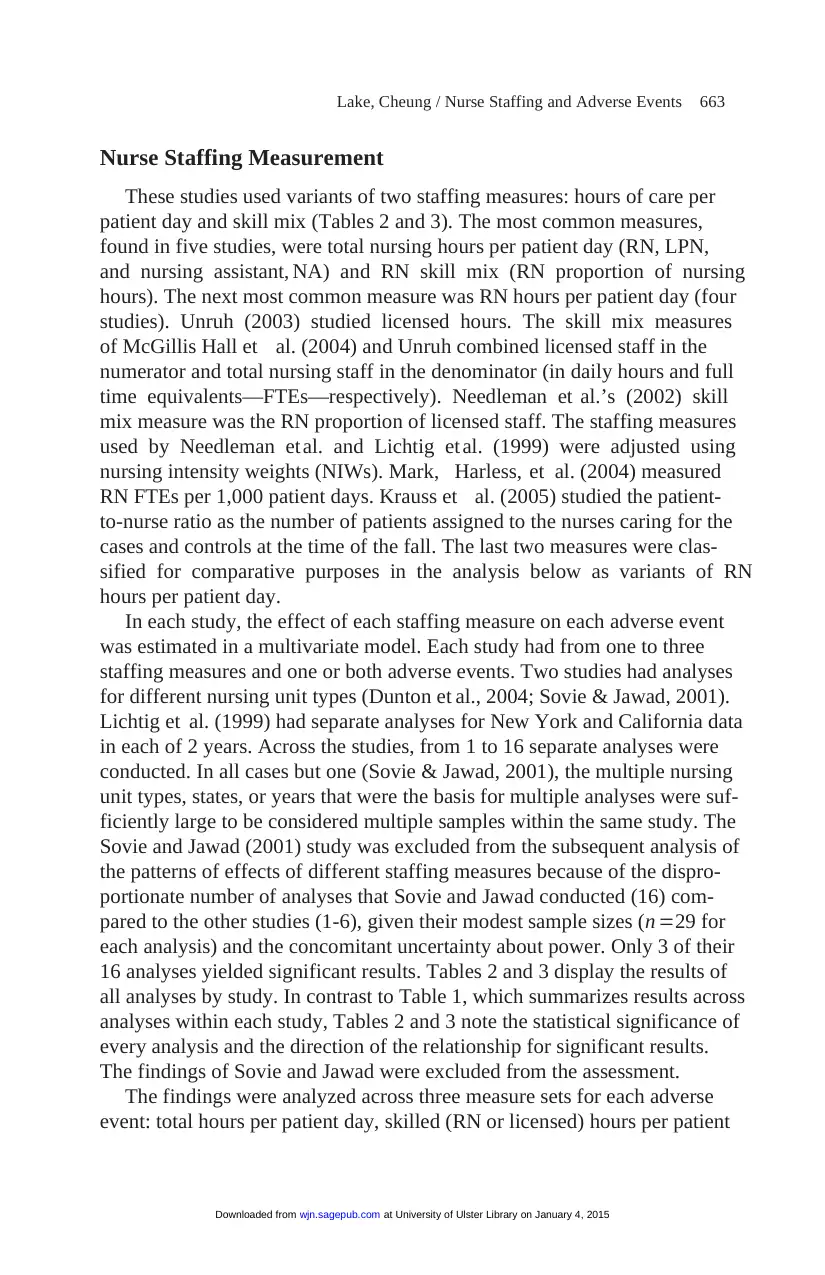
Nurse Staffing Measurement
These studies used variants of two staffing measures: hours of care per
patient day and skill mix (Tables 2 and 3). The most common measures,
found in five studies, were total nursing hours per patient day (RN, LPN,
and nursing assistant, NA) and RN skill mix (RN proportion of nursing
hours). The next most common measure was RN hours per patient day (four
studies). Unruh (2003) studied licensed hours. The skill mix measures
of McGillis Hall et al. (2004) and Unruh combined licensed staff in the
numerator and total nursing staff in the denominator (in daily hours and full
time equivalents—FTEs—respectively). Needleman et al.’s (2002) skill
mix measure was the RN proportion of licensed staff. The staffing measures
used by Needleman et al. and Lichtig et al. (1999) were adjusted using
nursing intensity weights (NIWs). Mark, Harless, et al. (2004) measured
RN FTEs per 1,000 patient days. Krauss et al. (2005) studied the patient-
to-nurse ratio as the number of patients assigned to the nurses caring for the
cases and controls at the time of the fall. The last two measures were clas-
sified for comparative purposes in the analysis below as variants of RN
hours per patient day.
In each study, the effect of each staffing measure on each adverse event
was estimated in a multivariate model. Each study had from one to three
staffing measures and one or both adverse events. Two studies had analyses
for different nursing unit types (Dunton et al., 2004; Sovie & Jawad, 2001).
Lichtig et al. (1999) had separate analyses for New York and California data
in each of 2 years. Across the studies, from 1 to 16 separate analyses were
conducted. In all cases but one (Sovie & Jawad, 2001), the multiple nursing
unit types, states, or years that were the basis for multiple analyses were suf-
ficiently large to be considered multiple samples within the same study. The
Sovie and Jawad (2001) study was excluded from the subsequent analysis of
the patterns of effects of different staffing measures because of the dispro-
portionate number of analyses that Sovie and Jawad conducted (16) com-
pared to the other studies (1-6), given their modest sample sizes (n =29 for
each analysis) and the concomitant uncertainty about power. Only 3 of their
16 analyses yielded significant results. Tables 2 and 3 display the results of
all analyses by study. In contrast to Table 1, which summarizes results across
analyses within each study, Tables 2 and 3 note the statistical significance of
every analysis and the direction of the relationship for significant results.
The findings of Sovie and Jawad were excluded from the assessment.
The findings were analyzed across three measure sets for each adverse
event: total hours per patient day, skilled (RN or licensed) hours per patient
Lake, Cheung / Nurse Staffing and Adverse Events 663
at University of Ulster Library on January 4, 2015wjn.sagepub.comDownloaded from
Paraphrase This Document
Need a fresh take? Get an instant paraphrase of this document with our AI Paraphraser
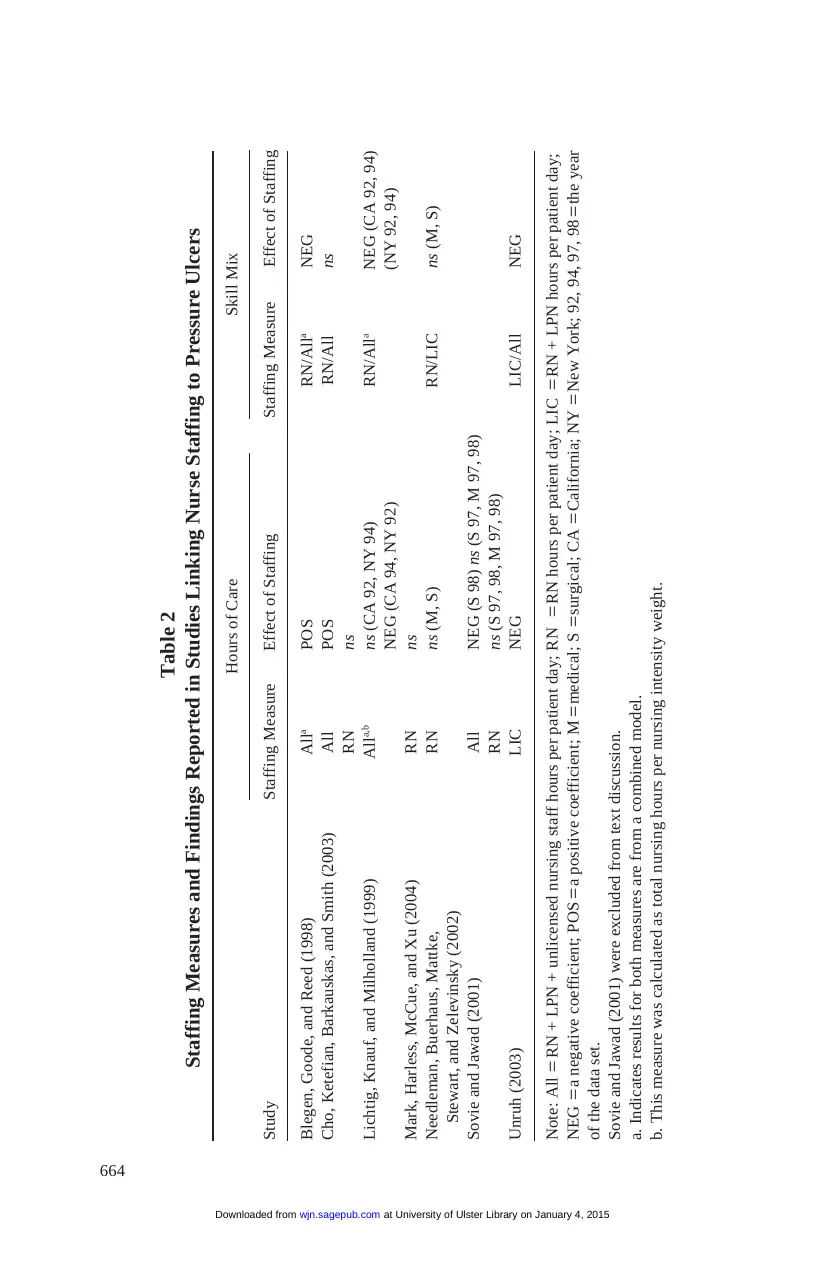
664
Table 2
Staffing Measures and Findings Reported in Studies Linking Nurse Staffing to Pressure Ulcers
Hours of Care Skill Mix
Study Staffing Measure Effect of Staffing Staffing Measure Effect of Staffing
Blegen, Goode, and Reed (1998) Alla POS RN/Alla NEG
Cho, Ketefian, Barkauskas, and Smith (2003) All POS RN/All ns
RN ns
Lichtig, Knauf, and Milholland (1999) Alla,b ns (CA 92, NY 94) RN/Alla NEG (CA 92, 94)
NEG (CA 94, NY 92) (NY 92, 94)
Mark, Harless, McCue, and Xu (2004) RN ns
Needleman, Buerhaus, Mattke, RN ns (M, S) RN/LIC ns (M, S)
Stewart, and Zelevinsky (2002)
Sovie and Jawad (2001) All NEG (S 98) ns (S 97, M 97, 98)
RN ns (S 97, 98, M 97, 98)
Unruh (2003) LIC NEG LIC/All NEG
Note: All =RN + LPN + unlicensed nursing staff hours per patient day; RN =RN hours per patient day; LIC =RN + LPN hours per patient day;
NEG =a negative coefficient; POS =a positive coefficient; M =medical; S =surgical; CA =California; NY =New York; 92, 94, 97, 98 =the year
of the data set.
Sovie and Jawad (2001) were excluded from text discussion.
a. Indicates results for both measures are from a combined model.
b. This measure was calculated as total nursing hours per nursing intensity weight.
at University of Ulster Library on January 4, 2015wjn.sagepub.comDownloaded from
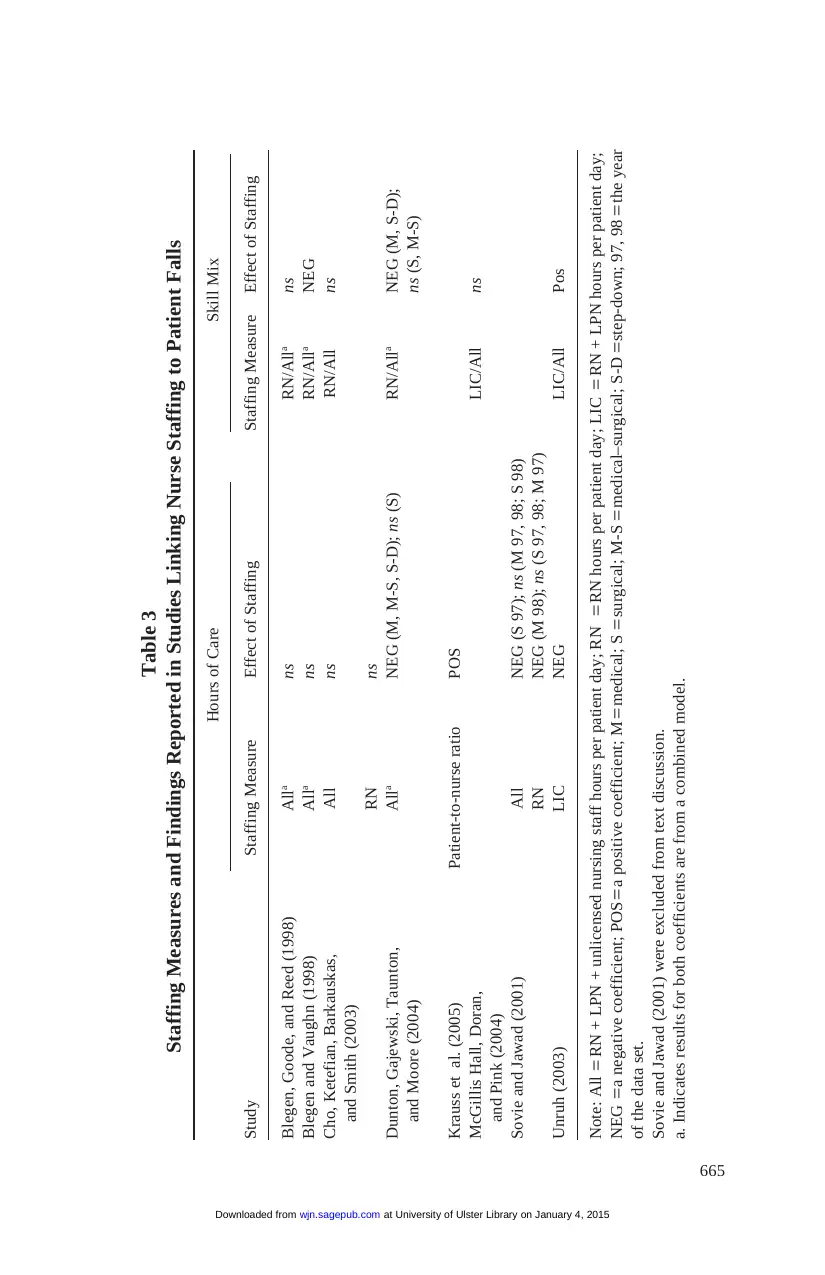
665
Table 3
Staffing Measures and Findings Reported in Studies Linking Nurse Staffing to Patient Falls
Hours of Care Skill Mix
Study Staffing Measure Effect of Staffing Staffing Measure Effect of Staffing
Blegen, Goode, and Reed (1998) Alla ns RN/Alla ns
Blegen and Vaughn (1998) Alla ns RN/Alla NEG
Cho, Ketefian, Barkauskas, All ns RN/All ns
and Smith (2003)
RN ns
Dunton, Gajewski, Taunton, Alla NEG (M, M-S, S-D); ns (S) RN/Alla NEG (M, S-D);
and Moore (2004) ns (S, M-S)
Krauss et al. (2005) Patient-to-nurse ratio POS
McGillis Hall, Doran, LIC/All ns
and Pink (2004)
Sovie and Jawad (2001) All NEG (S 97); ns (M 97, 98; S 98)
RN NEG (M 98); ns (S 97, 98; M 97)
Unruh (2003) LIC NEG LIC/All Pos
Note: All =RN + LPN + unlicensed nursing staff hours per patient day; RN =RN hours per patient day; LIC =RN + LPN hours per patient day;
NEG =a negative coefficient; POS =a positive coefficient; M =medical; S =surgical; M-S =medical–surgical; S-D =step-down; 97, 98 =the year
of the data set.
Sovie and Jawad (2001) were excluded from text discussion.
a. Indicates results for both coefficients are from a combined model.
at University of Ulster Library on January 4, 2015wjn.sagepub.comDownloaded from
⊘ This is a preview!⊘
Do you want full access?
Subscribe today to unlock all pages.
Trusted by 1+ million students worldwide
1 out of 24

Your All-in-One AI-Powered Toolkit for Academic Success.
+13062052269
info@desklib.com
Available 24*7 on WhatsApp / Email
![[object Object]](/_next/static/media/star-bottom.7253800d.svg)
Unlock your academic potential
Copyright © 2020–2026 A2Z Services. All Rights Reserved. Developed and managed by ZUCOL.