Comprehensive Master Budget Analysis for Business Decision Making

Verified

Added on  2020/01/23

|13
|1872
|116
Report
AI Summary
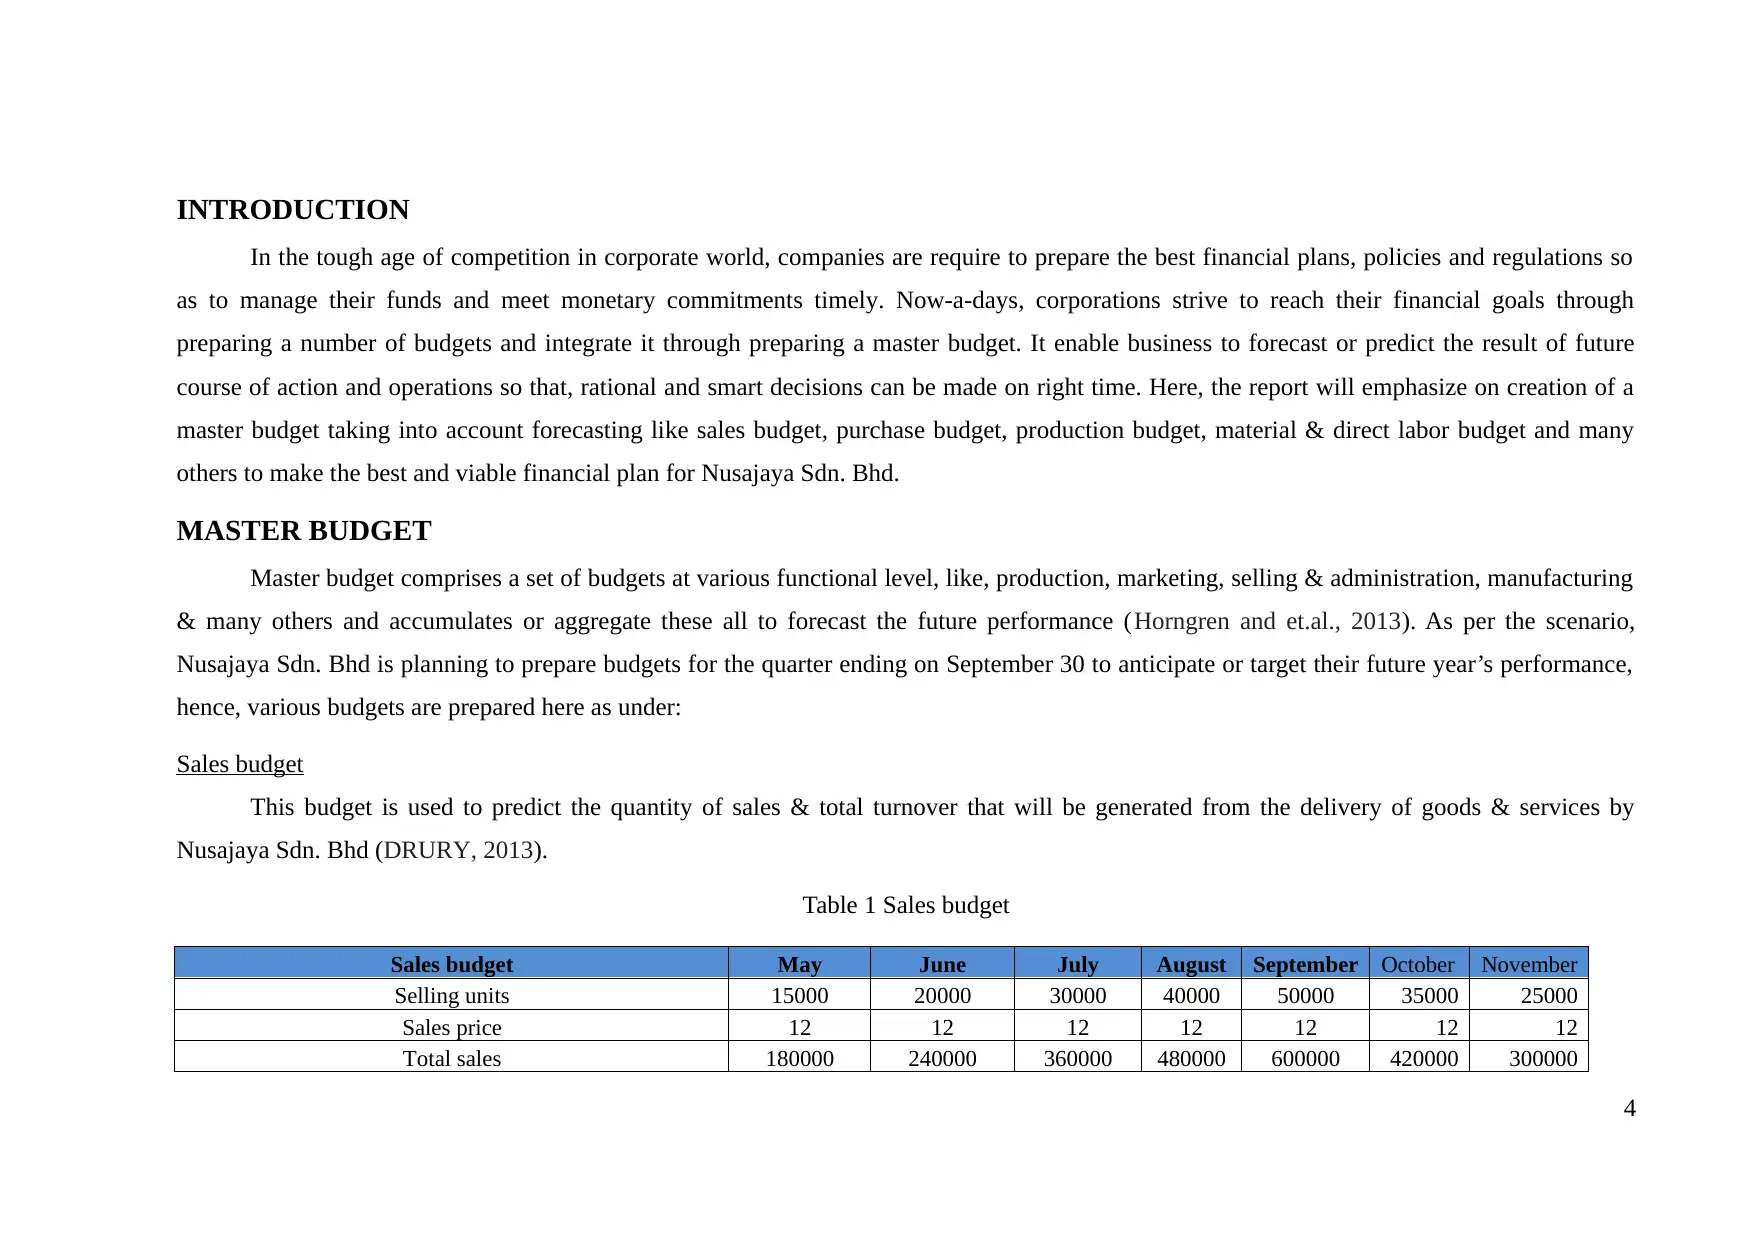
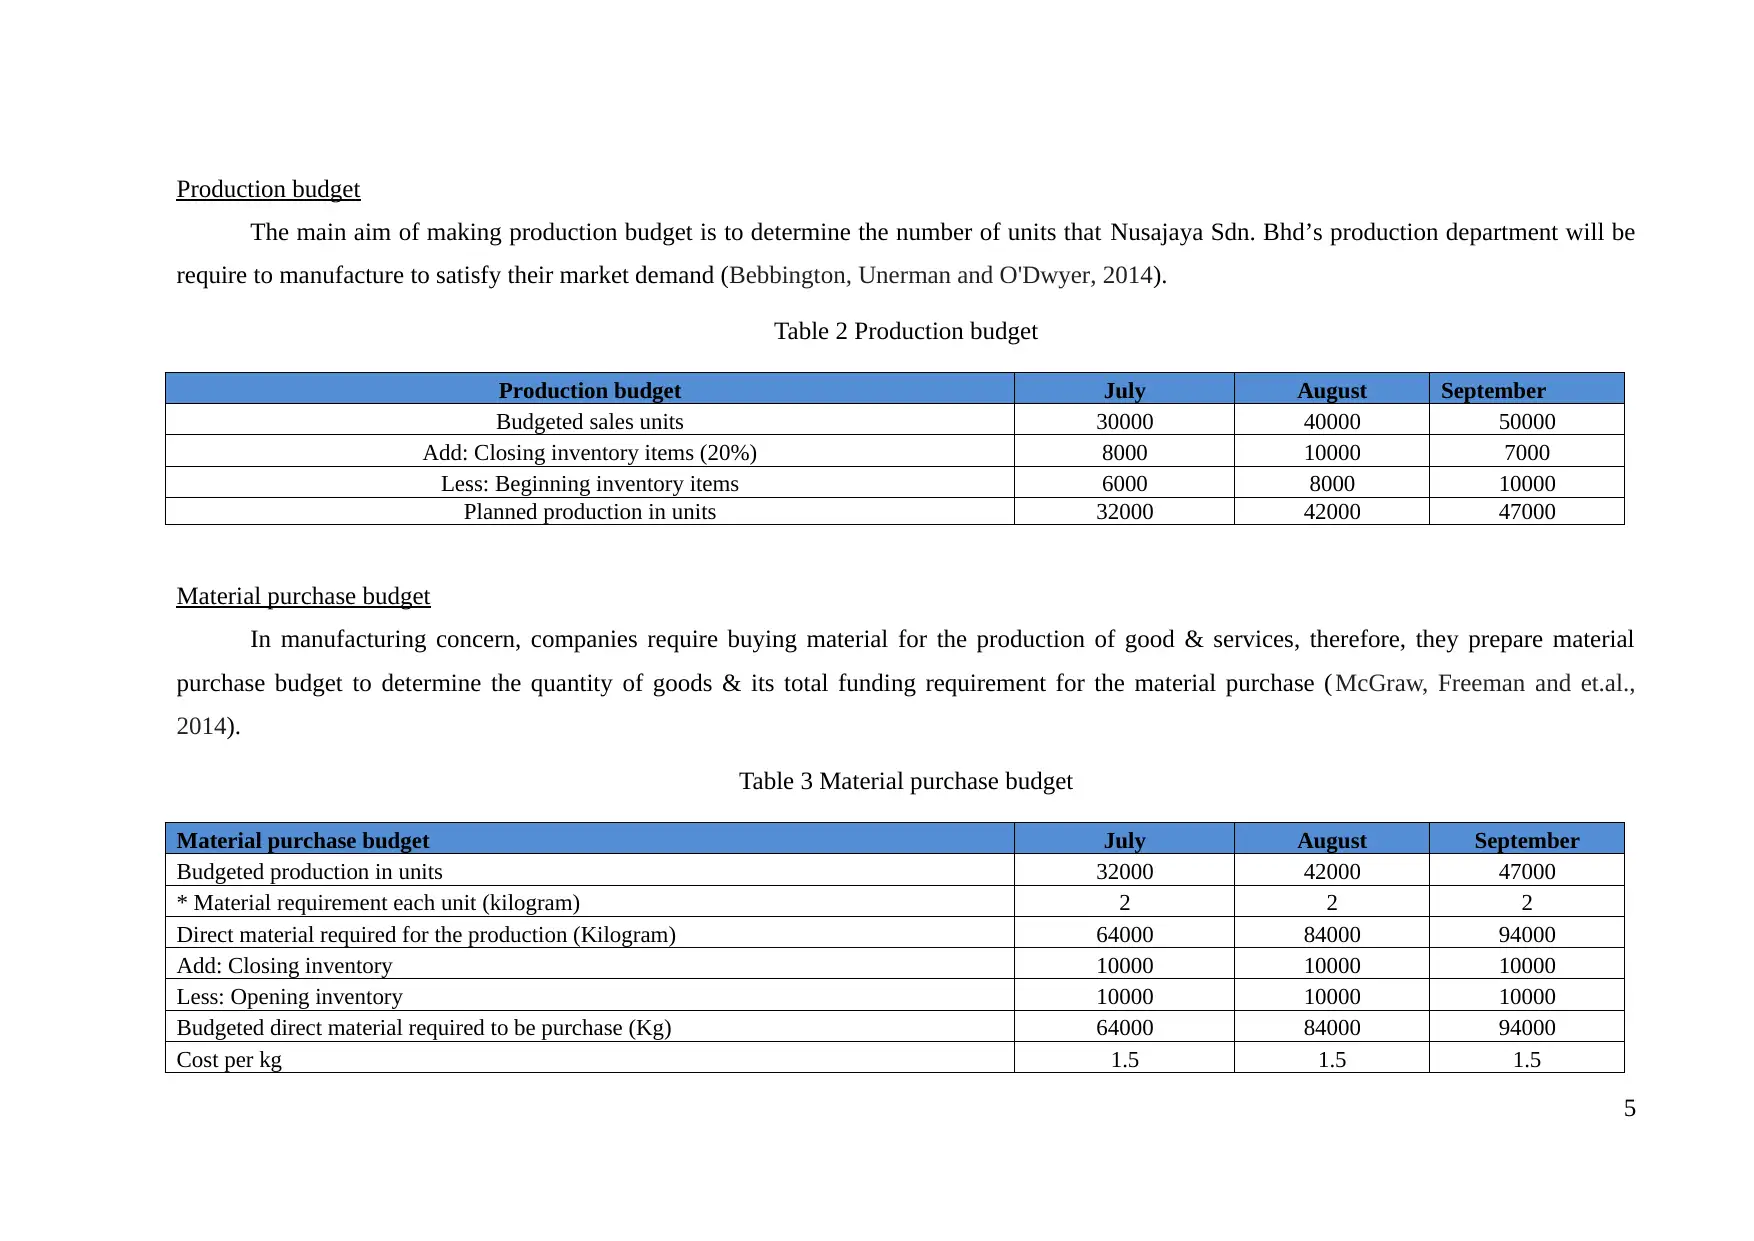
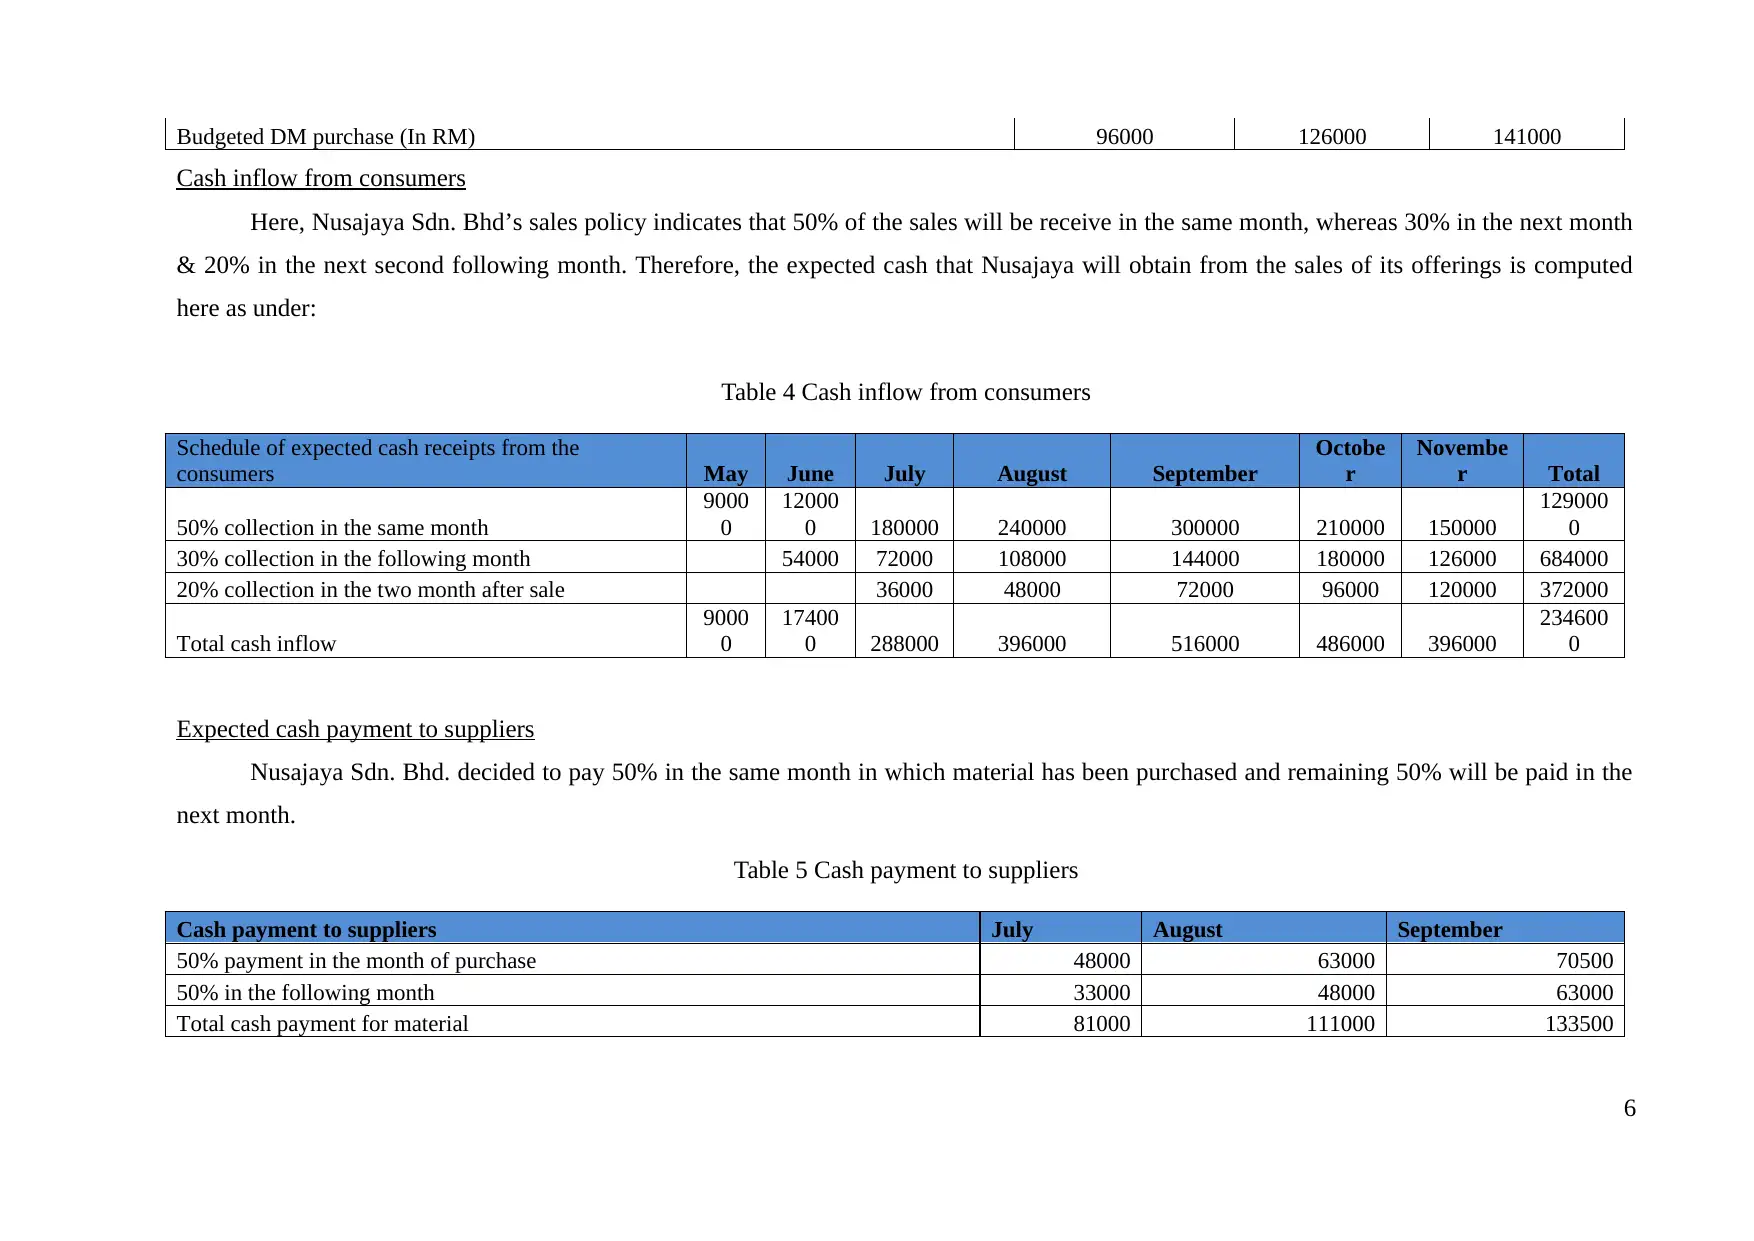
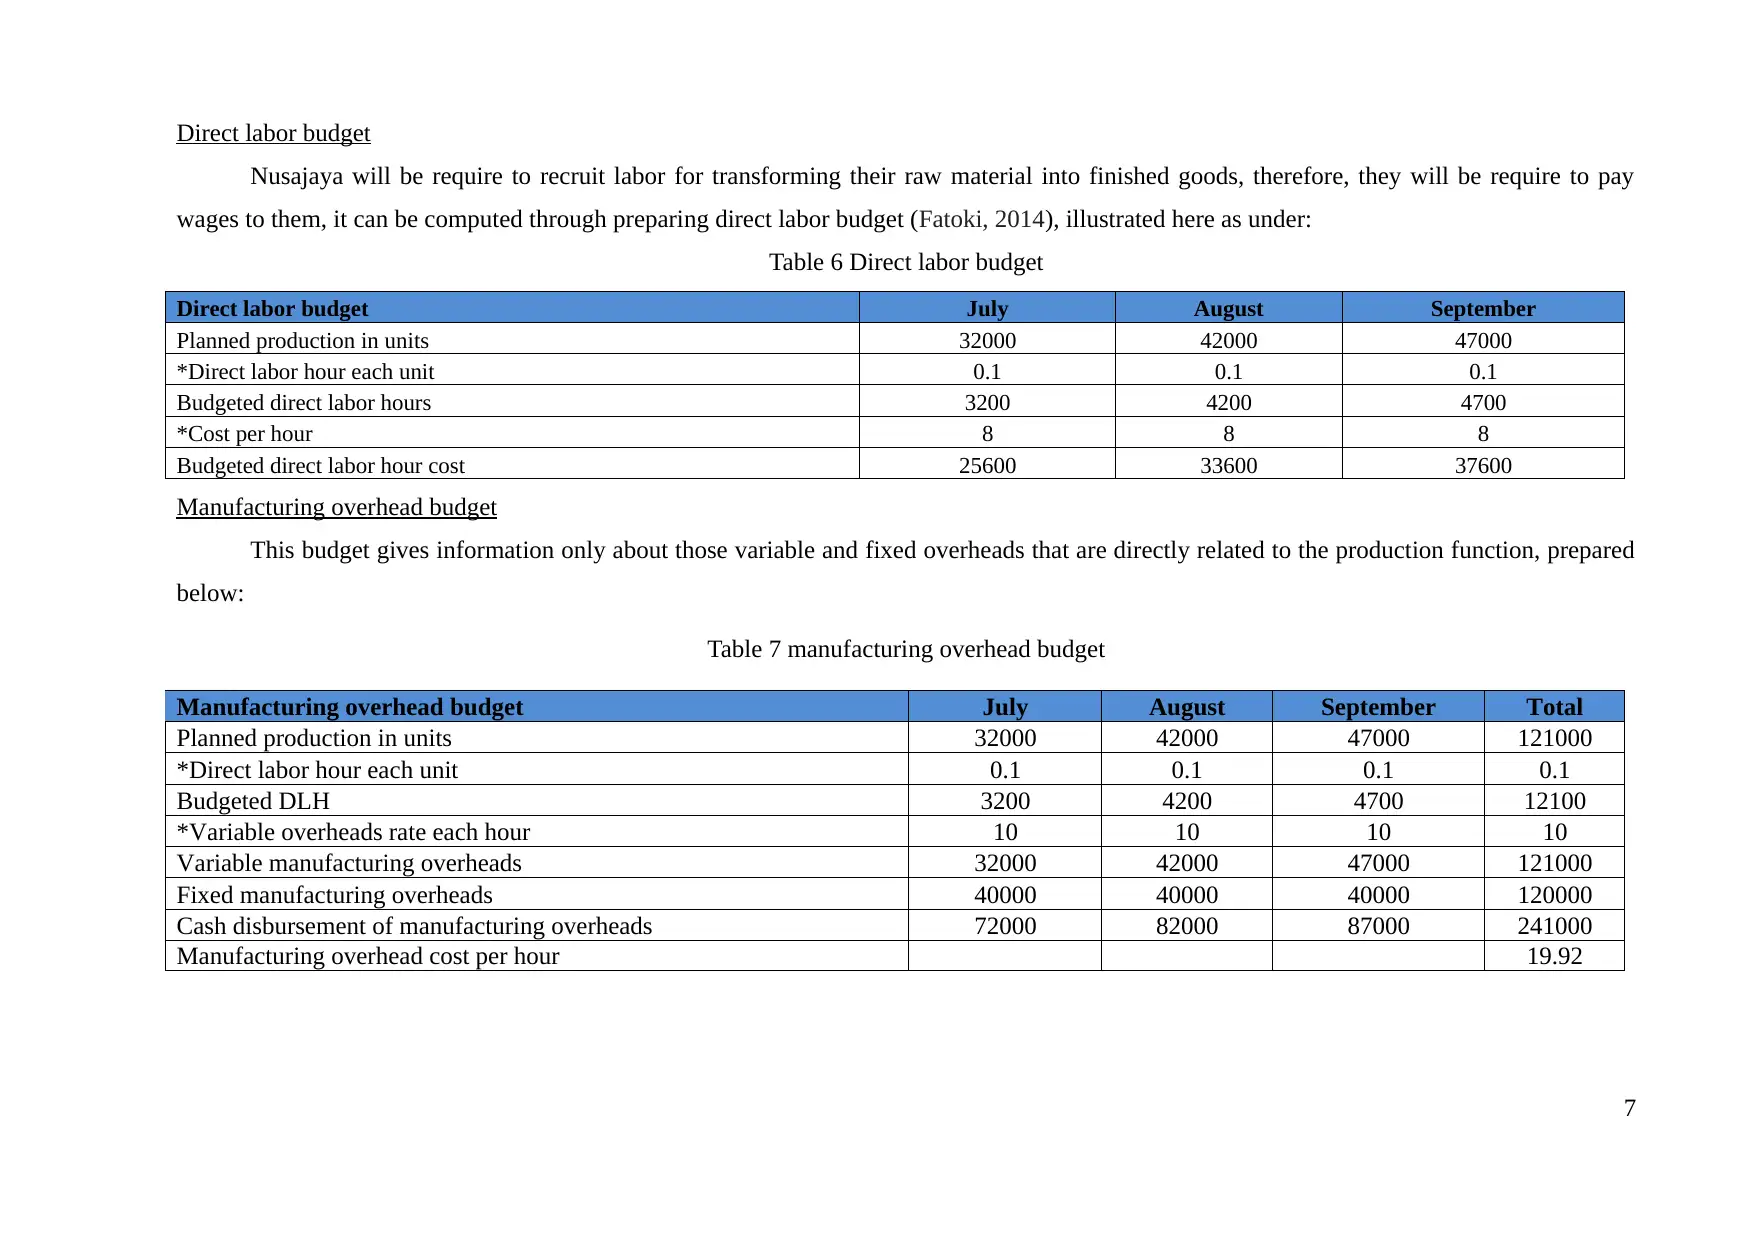
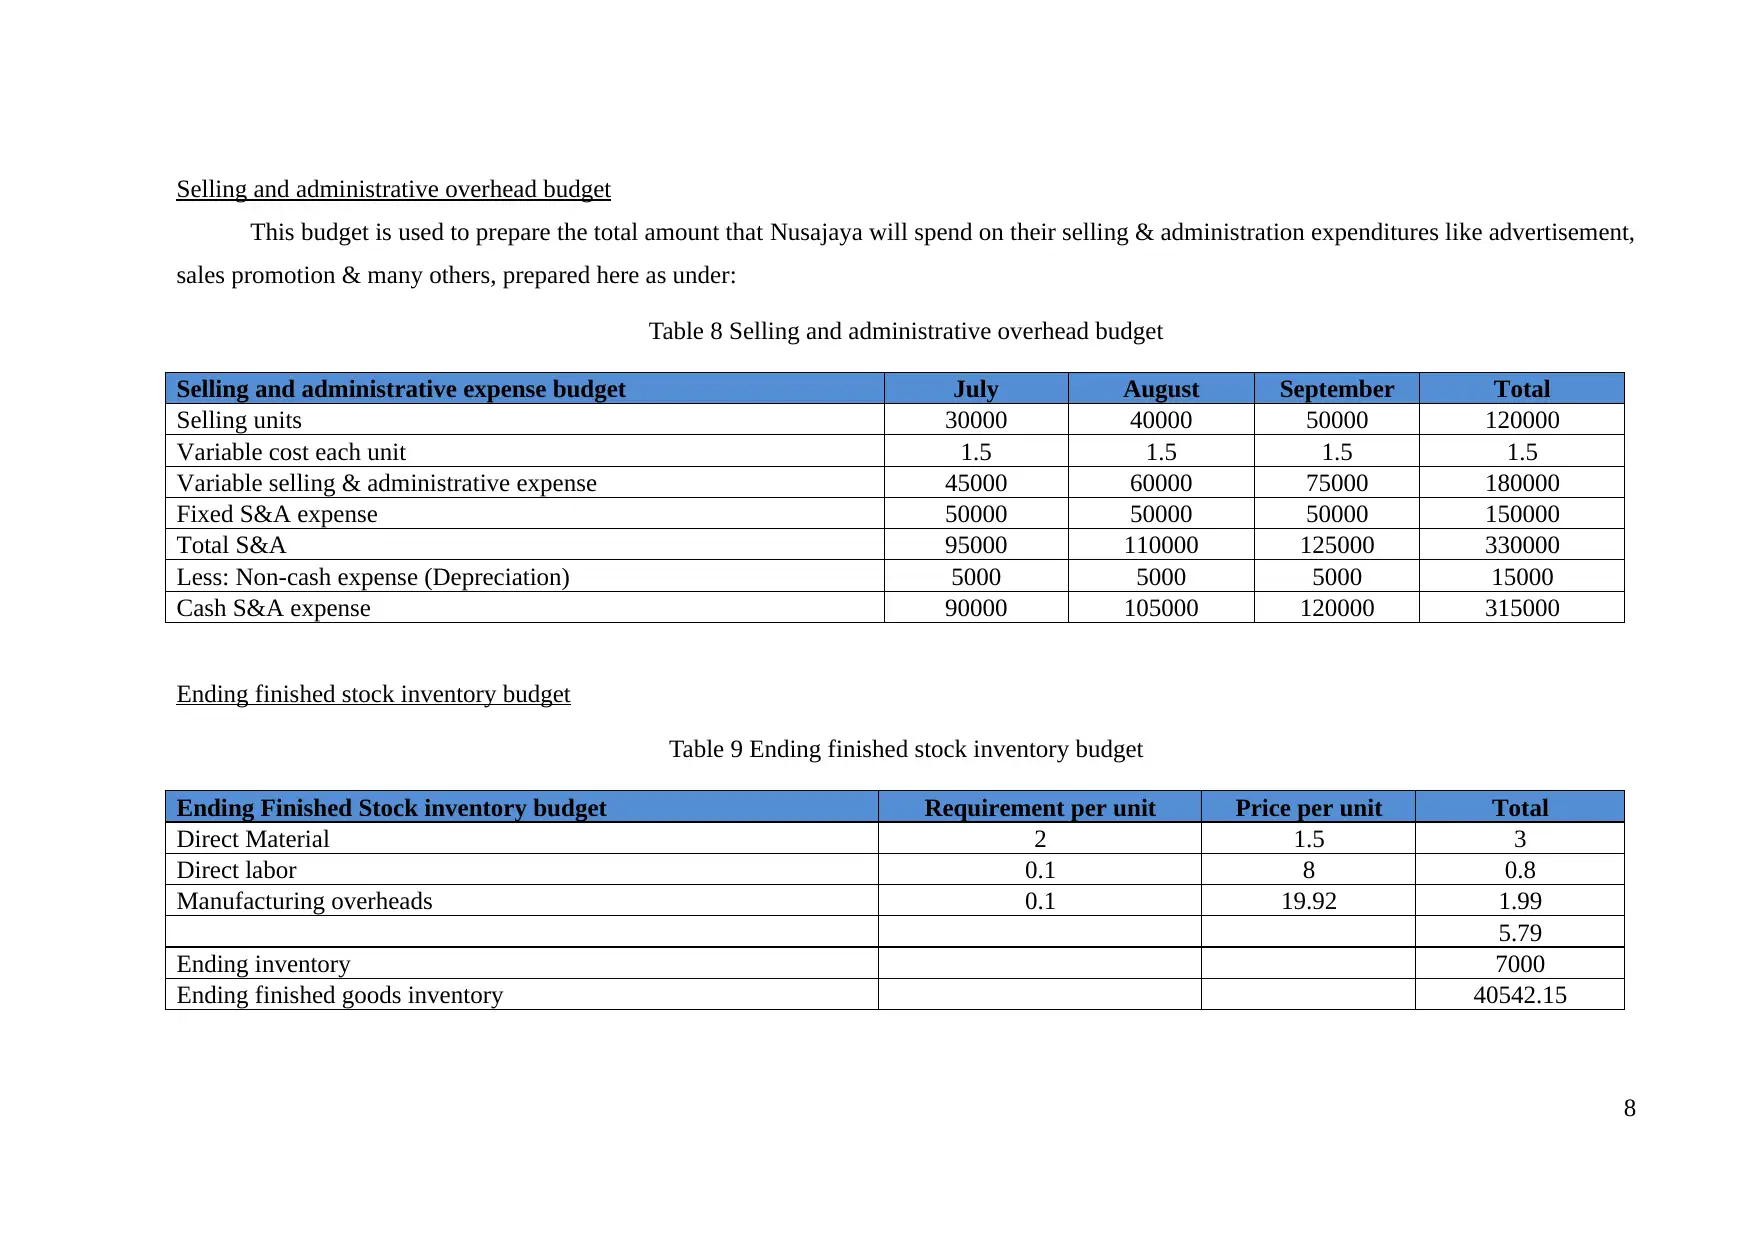
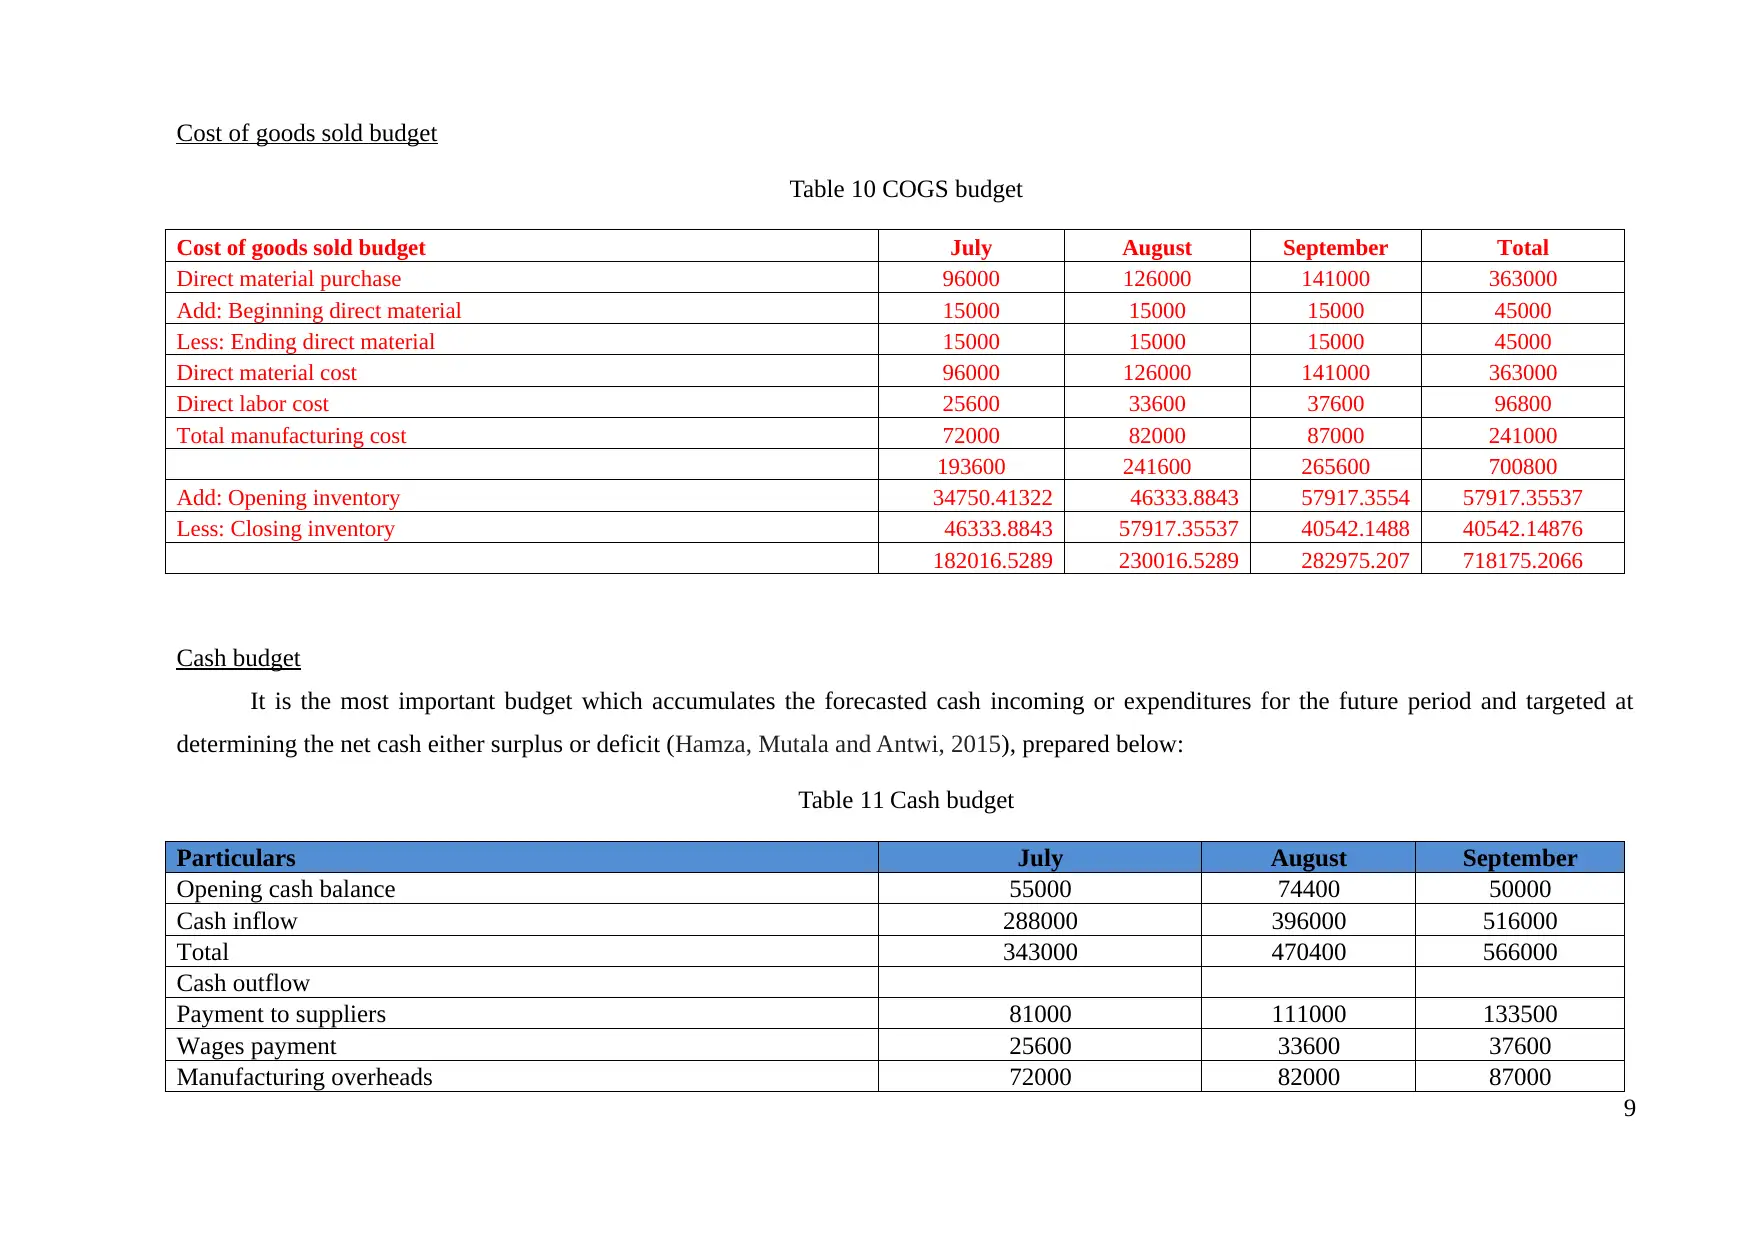
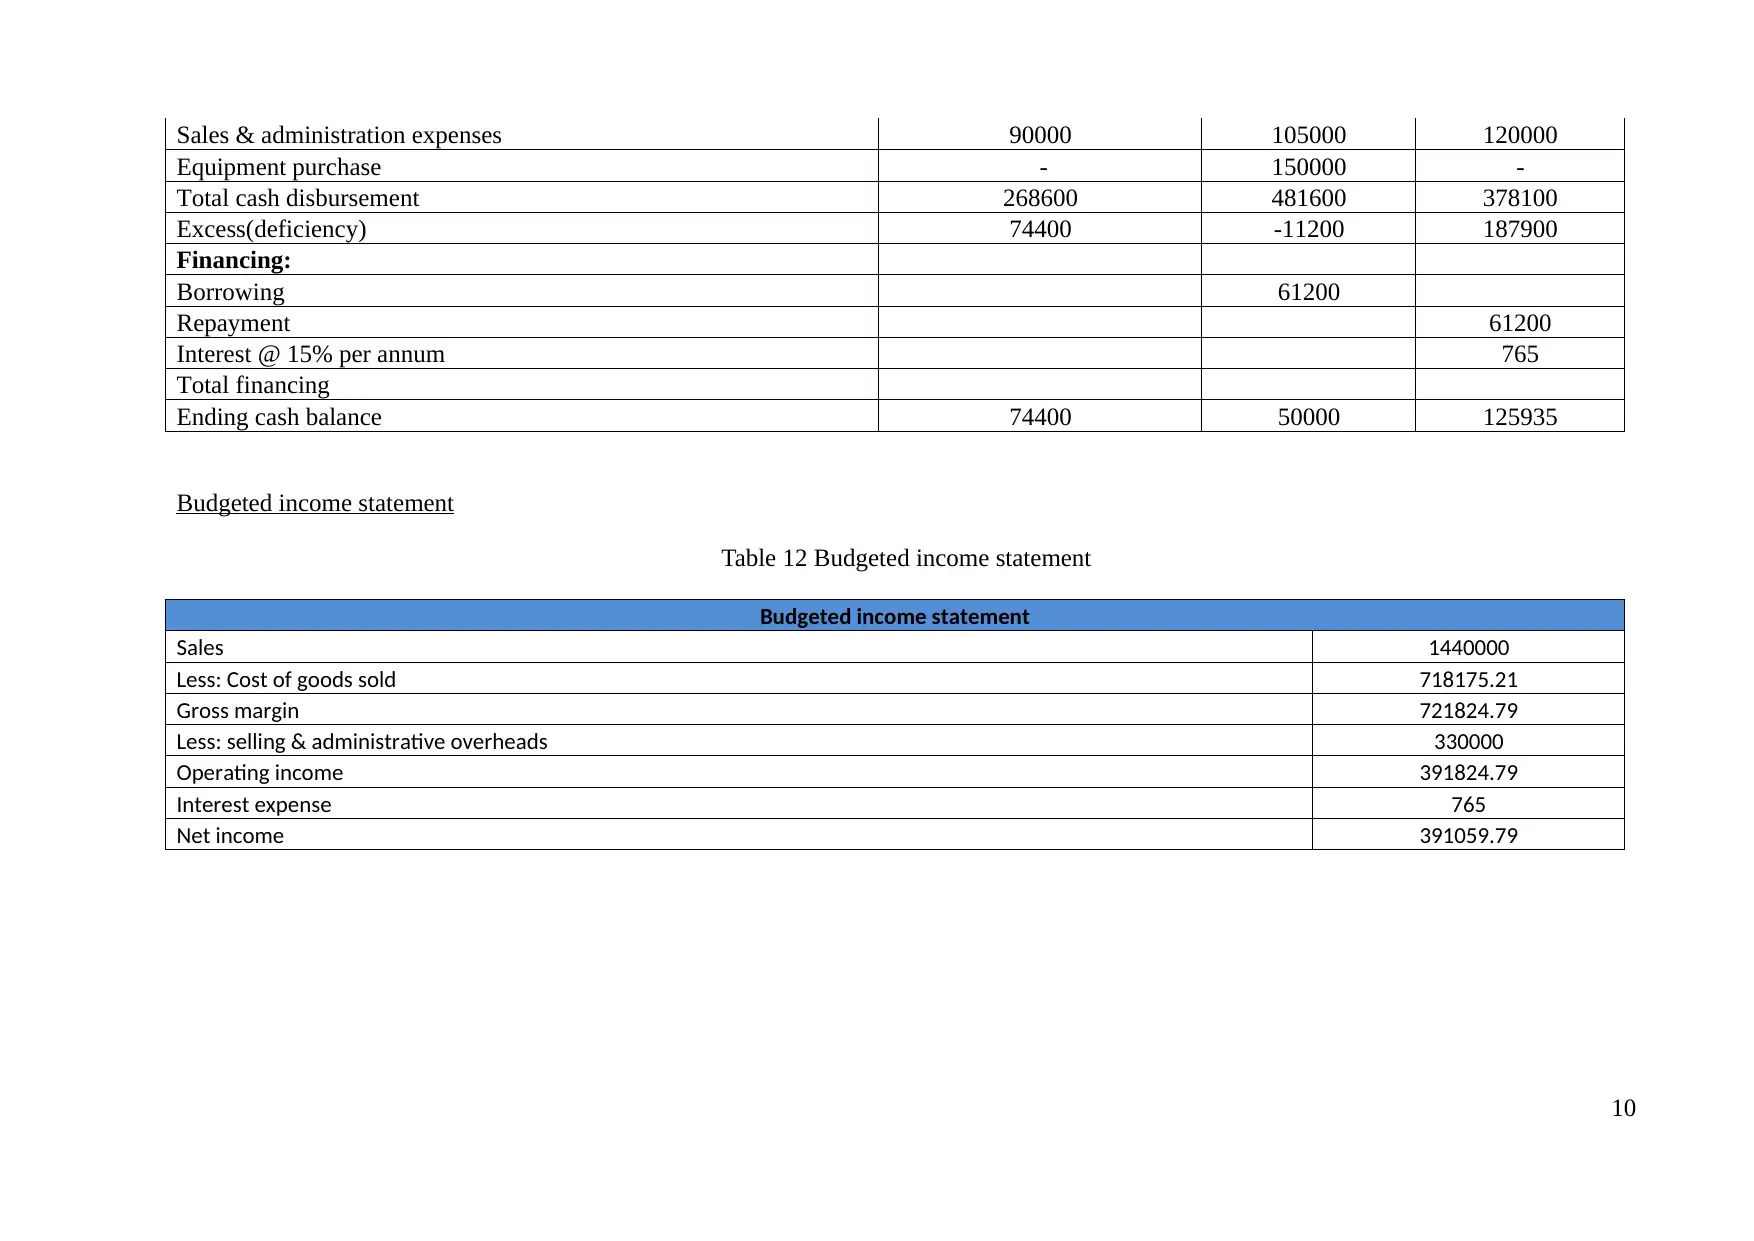
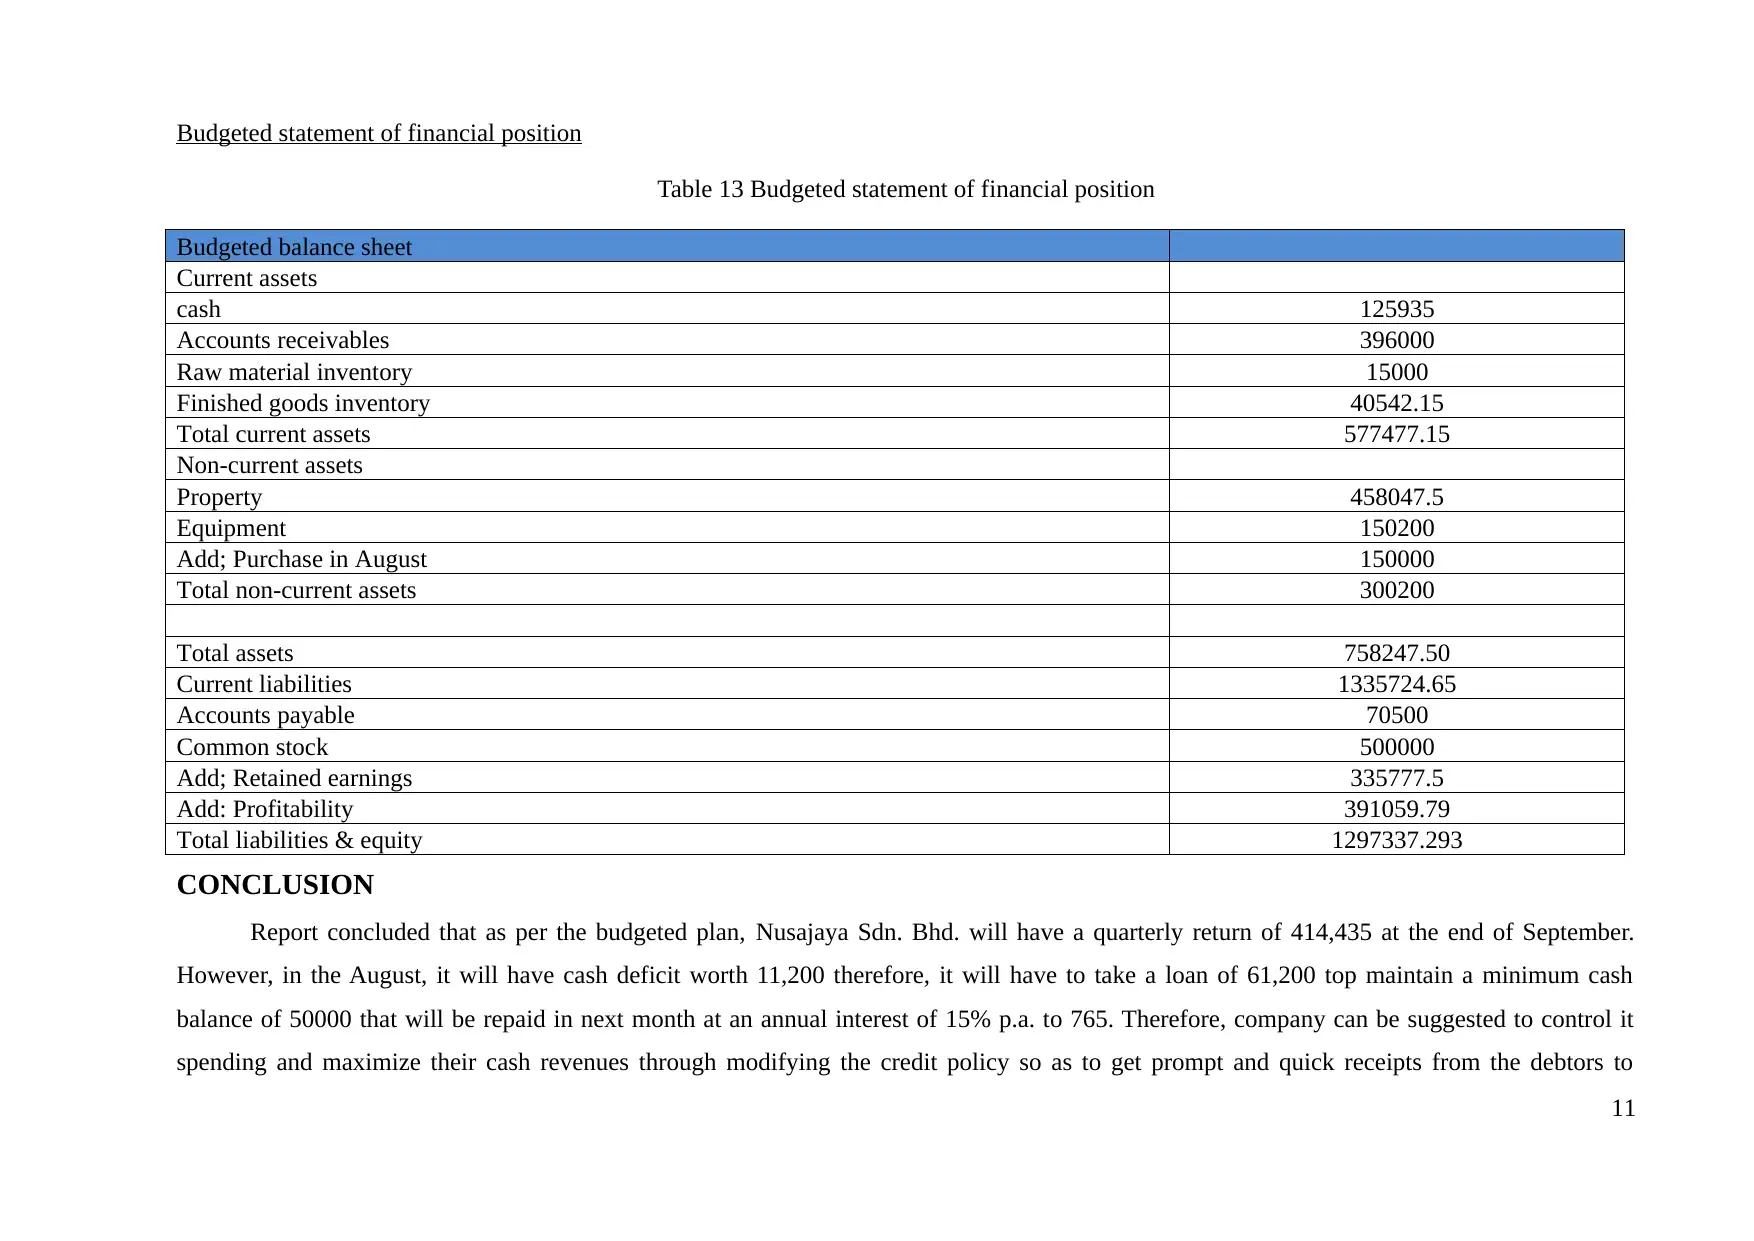
This report presents a comprehensive master budget for Nusajaya Sdn. Bhd., focusing on financial planning and decision-making. The report details the creation of various budgets, including sales, production, material purchase, cash inflow, direct labor, manufacturing overhead, and selling and administrative overhead budgets. It also includes an ending finished stock inventory budget, a cost of goods sold budget, a cash budget, a budgeted income statement, and a budgeted statement of financial position. The analysis provides a detailed financial forecast for the quarter ending September 30, highlighting key financial metrics, cash flow projections, and anticipated profitability. The report concludes with recommendations for financial management, emphasizing the importance of controlling spending and optimizing cash revenues through effective credit policies. The financial statements provide insights into the company's expected performance and financial position, aiding in strategic planning and resource allocation. The report also includes various tables that provide detailed data on the different components of the master budget.
Document Page
Accounting for Business decisions making
1
tabler-icon-diamond-filled.svg

Paraphrase This Document

Need a fresh take? Get an instant paraphrase of this document with our AI Paraphraser
Document Page
Table of Contents
INTRODUCTION................................................................................................................................4
MASTER BUDGET.............................................................................................................................4
Sales budget......................................................................................................................................4
Production budget.............................................................................................................................5
Material purchase budget..................................................................................................................5
Cash inflow from consumers............................................................................................................6
Expected cash payment to suppliers.................................................................................................6
Direct labor budget...........................................................................................................................7
Manufacturing overhead budget.......................................................................................................7
Selling and administrative overhead budget.....................................................................................8
Ending finished stock inventory budget...........................................................................................8
Cost of goods sold budget................................................................................................................9
Cash budget......................................................................................................................................9
Budgeted income statement............................................................................................................10
Budgeted statement of financial position........................................................................................11
CONCLUSION...................................................................................................................................11
REFERENCES...................................................................................................................................13
2
Document Page
TABLE OF INDEX
Table 1 Sales budget 4
Table 2 Production budget 5
Table 3 Material purchase budget 5
Table 4 Cash inflow from consumers 6
Table 5 Cash payment to suppliers 6
Table 6 Direct labor budget 7
Table 7 manufacturing overhead budget 7
Table 8 Selling and administrative overhead budget 8
Table 9 Ending finished stock inventory budget 8
Table 10 COGS budget 9
Table 11 Cash budget 9
Table 12 Budgeted income statement 10
Table 13 Budgeted statement of financial position 11
3
Document Page
INTRODUCTION
In the tough age of competition in corporate world, companies are require to prepare the best financial plans, policies and regulations so
as to manage their funds and meet monetary commitments timely. Now-a-days, corporations strive to reach their financial goals through
preparing a number of budgets and integrate it through preparing a master budget. It enable business to forecast or predict the result of future
course of action and operations so that, rational and smart decisions can be made on right time. Here, the report will emphasize on creation of a
master budget taking into account forecasting like sales budget, purchase budget, production budget, material & direct labor budget and many
others to make the best and viable financial plan for Nusajaya Sdn. Bhd.
MASTER BUDGET
Master budget comprises a set of budgets at various functional level, like, production, marketing, selling & administration, manufacturing
& many others and accumulates or aggregate these all to forecast the future performance (Horngren and et.al., 2013). As per the scenario,
Nusajaya Sdn. Bhd is planning to prepare budgets for the quarter ending on September 30 to anticipate or target their future year’s performance,
hence, various budgets are prepared here as under:
Sales budget
This budget is used to predict the quantity of sales & total turnover that will be generated from the delivery of goods & services by
Nusajaya Sdn. Bhd (DRURY, 2013).
Table 1 Sales budget
Sales budget May June July August September October November
Selling units 15000 20000 30000 40000 50000 35000 25000
Sales price 12 12 12 12 12 12 12
Total sales 180000 240000 360000 480000 600000 420000 300000
4
tabler-icon-diamond-filled.svg

Paraphrase This Document

Need a fresh take? Get an instant paraphrase of this document with our AI Paraphraser
Document Page
Production budget
The main aim of making production budget is to determine the number of units that Nusajaya Sdn. Bhd’s production department will be
require to manufacture to satisfy their market demand (Bebbington, Unerman and O'Dwyer, 2014).
Table 2 Production budget
Production budget July August September
Budgeted sales units 30000 40000 50000
Add: Closing inventory items (20%) 8000 10000 7000
Less: Beginning inventory items 6000 8000 10000
Planned production in units 32000 42000 47000
Material purchase budget
In manufacturing concern, companies require buying material for the production of good & services, therefore, they prepare material
purchase budget to determine the quantity of goods & its total funding requirement for the material purchase ( McGraw, Freeman and et.al.,
2014).
Table 3 Material purchase budget
Material purchase budget July August September
Budgeted production in units 32000 42000 47000
* Material requirement each unit (kilogram) 2 2 2
Direct material required for the production (Kilogram) 64000 84000 94000
Add: Closing inventory 10000 10000 10000
Less: Opening inventory 10000 10000 10000
Budgeted direct material required to be purchase (Kg) 64000 84000 94000
Cost per kg 1.5 1.5 1.5
5
Document Page
Budgeted DM purchase (In RM) 96000 126000 141000
Cash inflow from consumers
Here, Nusajaya Sdn. Bhd’s sales policy indicates that 50% of the sales will be receive in the same month, whereas 30% in the next month
& 20% in the next second following month. Therefore, the expected cash that Nusajaya will obtain from the sales of its offerings is computed
here as under:
Table 4 Cash inflow from consumers
Schedule of expected cash receipts from the
consumers May June July August September
Octobe
r
Novembe
r Total
50% collection in the same month
9000
0
12000
0 180000 240000 300000 210000 150000
129000
0
30% collection in the following month 54000 72000 108000 144000 180000 126000 684000
20% collection in the two month after sale 36000 48000 72000 96000 120000 372000
Total cash inflow
9000
0
17400
0 288000 396000 516000 486000 396000
234600
0
Expected cash payment to suppliers
Nusajaya Sdn. Bhd. decided to pay 50% in the same month in which material has been purchased and remaining 50% will be paid in the
next month.
Table 5 Cash payment to suppliers
Cash payment to suppliers July August September
50% payment in the month of purchase 48000 63000 70500
50% in the following month 33000 48000 63000
Total cash payment for material 81000 111000 133500
6
Document Page
Direct labor budget
Nusajaya will be require to recruit labor for transforming their raw material into finished goods, therefore, they will be require to pay
wages to them, it can be computed through preparing direct labor budget (Fatoki, 2014), illustrated here as under:
Table 6 Direct labor budget
Direct labor budget July August September
Planned production in units 32000 42000 47000
*Direct labor hour each unit 0.1 0.1 0.1
Budgeted direct labor hours 3200 4200 4700
*Cost per hour 8 8 8
Budgeted direct labor hour cost 25600 33600 37600
Manufacturing overhead budget
This budget gives information only about those variable and fixed overheads that are directly related to the production function, prepared
below:
Table 7 manufacturing overhead budget
Manufacturing overhead budget July August September Total
Planned production in units 32000 42000 47000 121000
*Direct labor hour each unit 0.1 0.1 0.1 0.1
Budgeted DLH 3200 4200 4700 12100
*Variable overheads rate each hour 10 10 10 10
Variable manufacturing overheads 32000 42000 47000 121000
Fixed manufacturing overheads 40000 40000 40000 120000
Cash disbursement of manufacturing overheads 72000 82000 87000 241000
Manufacturing overhead cost per hour 19.92
7
tabler-icon-diamond-filled.svg

Paraphrase This Document

Need a fresh take? Get an instant paraphrase of this document with our AI Paraphraser
Document Page
Selling and administrative overhead budget
This budget is used to prepare the total amount that Nusajaya will spend on their selling & administration expenditures like advertisement,
sales promotion & many others, prepared here as under:
Table 8 Selling and administrative overhead budget
Selling and administrative expense budget July August September Total
Selling units 30000 40000 50000 120000
Variable cost each unit 1.5 1.5 1.5 1.5
Variable selling & administrative expense 45000 60000 75000 180000
Fixed S&A expense 50000 50000 50000 150000
Total S&A 95000 110000 125000 330000
Less: Non-cash expense (Depreciation) 5000 5000 5000 15000
Cash S&A expense 90000 105000 120000 315000
Ending finished stock inventory budget
Table 9 Ending finished stock inventory budget
Ending Finished Stock inventory budget Requirement per unit Price per unit Total
Direct Material 2 1.5 3
Direct labor 0.1 8 0.8
Manufacturing overheads 0.1 19.92 1.99
5.79
Ending inventory 7000
Ending finished goods inventory 40542.15
8
Document Page
Cost of goods sold budget
Table 10 COGS budget
Cost of goods sold budget July August September Total
Direct material purchase 96000 126000 141000 363000
Add: Beginning direct material 15000 15000 15000 45000
Less: Ending direct material 15000 15000 15000 45000
Direct material cost 96000 126000 141000 363000
Direct labor cost 25600 33600 37600 96800
Total manufacturing cost 72000 82000 87000 241000
193600 241600 265600 700800
Add: Opening inventory 34750.41322 46333.8843 57917.3554 57917.35537
Less: Closing inventory 46333.8843 57917.35537 40542.1488 40542.14876
182016.5289 230016.5289 282975.207 718175.2066
Cash budget
It is the most important budget which accumulates the forecasted cash incoming or expenditures for the future period and targeted at
determining the net cash either surplus or deficit (Hamza, Mutala and Antwi, 2015), prepared below:
Table 11 Cash budget
Particulars July August September
Opening cash balance 55000 74400 50000
Cash inflow 288000 396000 516000
Total 343000 470400 566000
Cash outflow
Payment to suppliers 81000 111000 133500
Wages payment 25600 33600 37600
Manufacturing overheads 72000 82000 87000
9
Document Page
Sales & administration expenses 90000 105000 120000
Equipment purchase - 150000 -
Total cash disbursement 268600 481600 378100
Excess(deficiency) 74400 -11200 187900
Financing:
Borrowing 61200
Repayment 61200
Interest @ 15% per annum 765
Total financing
Ending cash balance 74400 50000 125935
Budgeted income statement
Table 12 Budgeted income statement
Budgeted income statement
Sales 1440000
Less: Cost of goods sold 718175.21
Gross margin 721824.79
Less: selling & administrative overheads 330000
Operating income 391824.79
Interest expense 765
Net income 391059.79
10
tabler-icon-diamond-filled.svg

Paraphrase This Document

Need a fresh take? Get an instant paraphrase of this document with our AI Paraphraser
Document Page
Budgeted statement of financial position
Table 13 Budgeted statement of financial position
Budgeted balance sheet
Current assets
cash 125935
Accounts receivables 396000
Raw material inventory 15000
Finished goods inventory 40542.15
Total current assets 577477.15
Non-current assets
Property 458047.5
Equipment 150200
Add; Purchase in August 150000
Total non-current assets 300200
Total assets 758247.50
Current liabilities 1335724.65
Accounts payable 70500
Common stock 500000
Add; Retained earnings 335777.5
Add: Profitability 391059.79
Total liabilities & equity 1297337.293
CONCLUSION
Report concluded that as per the budgeted plan, Nusajaya Sdn. Bhd. will have a quarterly return of 414,435 at the end of September.
However, in the August, it will have cash deficit worth 11,200 therefore, it will have to take a loan of 61,200 top maintain a minimum cash
balance of 50000 that will be repaid in next month at an annual interest of 15% p.a. to 765. Therefore, company can be suggested to control it
spending and maximize their cash revenues through modifying the credit policy so as to get prompt and quick receipts from the debtors to
11
Document Page
maintain enough cash.
12
chevron_up_icon
1 out of 13
circle_padding
hide_on_mobile
zoom_out_icon
[object Object]