University Student Nutrition and Physical Activity Assessment Report
VerifiedAdded on 2023/04/21
|24
|5959
|424
Report
AI Summary
This report presents an assessment of nutrition and physical activity among Australian university students. The study evaluated macronutrient and micronutrient intake, energy expenditure, body composition, and anthropometric measurements. Data was collected through three-day food records, food frequency questionnaires, physical activity diaries, and various assessment methods including bioelectrical impedance and skinfold measurements. The findings revealed insights into dietary habits, physical activity levels, and body composition, comparing these values with Australian guidelines and norms. Key findings included deficiencies in micronutrient intake, particularly calcium, and variations in energy expenditure. The report also included statistical analyses to determine the significance of the findings and compared the results obtained from different assessment methods. Limitations and comparisons to Australian recommendations and population trends are also discussed.
Running head: NUTRITION AND PHYSCIAL ACTIVITY ASSESSMENT
NUTRITION AND PHYSICAL ACTIVITY ASSESSMENT
Name of the Student:
Name of the University:
Author note:
NUTRITION AND PHYSICAL ACTIVITY ASSESSMENT
Name of the Student:
Name of the University:
Author note:
Paraphrase This Document
Need a fresh take? Get an instant paraphrase of this document with our AI Paraphraser
1NUTRITION AND PHYSICAL ACTIVITY ASSESSMENT
Abstract
Adequate nutrition and physical activity is essential for the maintenance of positive health
outcomes and hence, conductance of adequate nutritional and physical activity assessment
provides key insights into the existing level of fitness and metabolism among individuals.
Considering the possibilities of sedentary lifestyle and poor nutritional status among university
students due to their challenging social, emotional and academic demands, the following
research was conducted to evaluate the physical activity levels and nutritional status among
Australian university students, via assessment of macro and micro nutrient intake,
anthropometric measurements, body fat analysis and energy expenditure examination. The study
produced key findings which could be related as well as differentiated from Australian norms
and standards.
2NUTRITION AND PHYSICAL ACTIVITY ASSESSMENT
Table of Contents
Introduction..........................................................................................................................4
Research Background......................................................................................................4
Research Rationale..........................................................................................................5
Nutrition and Physical Assessment: Scientific Rationale............................................5
Research Objectives.........................................................................................................5
Research Aims.............................................................................................................6
Participant and Methods......................................................................................................7
Participant Selection........................................................................................................7
Methods and Procedures..................................................................................................7
Macronutrients and Micronutrients.............................................................................7
Physical Activity and Energy Balance........................................................................8
Anthropometrics..........................................................................................................8
Results..................................................................................................................................9
Macronutrients.................................................................................................................9
Table 1: Energy derived from Macronutrients using 3 day Food Record (Descriptive
Statistics)..................................................................................................................................9
Table 2: Proportion (%) of Nutrient Consumption as against Recommended Values
...............................................................................................................................................10
Micronutrients................................................................................................................10
⊘ This is a preview!⊘
Do you want full access?
Subscribe today to unlock all pages.
Trusted by 1+ million students worldwide
3NUTRITION AND PHYSICAL ACTIVITY ASSESSMENT
Table 3: Group Micronutrient Intake (Descriptive Statistics)...................................11
Table 4: Proportion (%) at risk of Inadequate Micronutrient Intake (3 Day Food
Record)..................................................................................................................................11
Physical Activity and Energy Balance..........................................................................11
Table 5: Group Results (Descriptive Statistics) for Energy Expenditure and Energy
Intake.....................................................................................................................................12
Anthropometrics............................................................................................................12
Table 6: Group Results (Descriptive Statistics) of Anthropometric Measurement...12
Table 7: Participant Proportion (%) in each Waist Circumference (WC) Category. 13
Table 8: Participant Proportion (%) in each Body Mass Index (BMI) Category......13
Discussion..........................................................................................................................13
Major Findings...............................................................................................................13
Limitations.................................................................................................................14
Comparison with Australian Recommendations and Australian Population Trends....14
Similarities and Differences..........................................................................................16
Estimation of Calcium Intake....................................................................................16
Estimation of Energy Expenditure.............................................................................17
Estimation of Body Fat Percentage...........................................................................17
Conclusion.........................................................................................................................17
References..........................................................................................................................19
Paraphrase This Document
Need a fresh take? Get an instant paraphrase of this document with our AI Paraphraser
4NUTRITION AND PHYSICAL ACTIVITY ASSESSMENT
Introduction
The challenging stage of late adolescence and young adulthood, coupledwith academic,
emotional and social pressures often result in detrimental health conditions in university
students, such as micronutrient deficiencies, poor stamina and fitness levels, excessive or
inadequate energy expenditure and increased adiposity (1). Prior to enhancing existing
nutritional and physical activity awareness among university students, the conductance of
nutritional, physical activity and anthropometric assessments is of utmost importance (2).
Research Background
In accordance to the data presented by the Australian Health Survey in the years 2011 to
2012, nearly 12 million or 70% of adults were found to adhere to negligible levels of physical
activity or sedentary lifestyles. Additionally, the survey also recorded a merely 53% of young
adults, within 18 to 24 years, participating in adequate levels of physical activity (3).As per the
most recent findings by the Australian Institute of Health and Welfare, nearly all Australians
over the age of 19, and almost 4 out of 5 Australians in the age group of 19 to 50 years, engaged
in insufficient consumption of fruits and vegetables, with deficiencies of iron and calcium noted
among women and girls (4).Adherence to adequate nutritional and physically activity levels is
essential for basic functioning. Individuals must engage in assessments of the same to obtain key
insights of their existing nutritional status and possible susceptibilities to detrimental metabolic
disorders (5).
5NUTRITION AND PHYSICAL ACTIVITY ASSESSMENT
Research Rationale
Young adults and individuals studying in universities, are often overcome with poor
dietary and physical activity habits, majorly due to relocation beyond their homes or possession
of insufficient knowledge pertaining to adequate nutrition and exercise (6). The overwhelming
social and emotional challenges, peer and academic pressures and the demanding educational
time schedules often compel university students to engage in increased consumption of
processed or fast foods and increased adherence to deteriorating lifestyle habits such as alcohol,
smoking and negligible exercise ultimately resulting in poor nutritional status and abnormal
energy expenditures (7).
Nutrition and Physical Assessment: Scientific Rationale
Nutrition assessment and education is essential for the purpose of conducting
improvements in dietary habits and food consumption. Adequate nutritional assessments
saliently highlight the key nutrients which an individual may be lacking or consuming
excessively, and hence, provide strategies to reverse the harmful effects of poor nutritional status
such as deficiency disorders and metabolic malfunctioning (8). Inadequate levels of physical
activity results in increased adiposity, inadequate muscle mass, detrimental bone strength, poor
levels of stamina and compromised immune functioning. The rationale of physical assessment
conductance lies in the provision of key insights regarding an individual’s existing fitness status.
Achievement of positive health outcomes forms the overall rationale for conductance of
assessments of nutritional status and physical activity levels (9).
Research Objectives
The objective of the following research is to evaluate the Nutritional Status, Physical
Activity Level and Anthropometric Assessments of Australian university students through
⊘ This is a preview!⊘
Do you want full access?
Subscribe today to unlock all pages.
Trusted by 1+ million students worldwide
6NUTRITION AND PHYSICAL ACTIVITY ASSESSMENT
conductance of assessments of Dietary Micro and Macronutrient Intake, Energy Expenditure and
Body Composition.
Research Aims
The aims of the research are as follows:
To evaluate the dietary intake of calcium in the participants using a three day food record
as well as a short food frequency questionnaire.
To examine the validity of calcium intake measured by a three day food record in
comparison to a short food frequency questionnaire.
To evaluate the energy expenditure among participants using the Active Australia Survey
and a three day physical activity diary, along with a comparative analysis of the results
produced by both.
To evaluate the percentage of body fat among participants using impedance and skin
folds methods, along with a comparative analysis of the results produced by both.
To determine the intake of essential macro and micronutrients among participants using a
three day food record method.
To obtain anthropometric measurements, physical activity levels and energy expenditure
values from participants using bioelectrical and skinfold methods, three day physical
activity and food record methods, along with obtaining group values from the Active
Australia Survey.
To compare the nutritional and physical activity values so obtained with standardized
Australian guidelines, norms and requirements.
Paraphrase This Document
Need a fresh take? Get an instant paraphrase of this document with our AI Paraphraser
7NUTRITION AND PHYSICAL ACTIVITY ASSESSMENT
Participant and Methods
Participant Selection
The participants of the research comprised of students belonging to a renowned
university in Victoria, Australia. A total of 212 participants were invited to enter relevant data
into an online database. The participants comprised of females, of which, 3 were excluded from
the research due to incomplete data in the Food-works database. A total of 35 male students were
excluded, to obtain a sample size of 173 female students. The age of the participants ranged
between 19 to 56 years, with an average age of 23.7 years.
Methods and Procedures
Macronutrients and Micronutrients
The intake of essential macro and micro nutrients such as energy, protein, fat,
carbohydrate, iron, folate and zinc was obtained using a three day food record (10). The intake of
calcium was also assessed with the aid of a food frequency questionnaire (11).
Statistical Analysis
Data was statistically analyzed using STATA SE 14 Software, with statistical
significance of p < 0.05. The mean and standard deviation values were estimated, followed by a
comparative analysis determining the adequacy of nutrient intake via a probability and cut-point
method, along with estimated average requirement (EAR) values as against Nutrient Reference
Value Tables for Australians in the age group of 19 to 30 years. Paired t test and Pearson’s
Correlation methods were utilized to compare and correlate the intake of dietary calcium
assessed between a three day food record and a food frequency questionnaire (12).
8NUTRITION AND PHYSICAL ACTIVITY ASSESSMENT
Physical Activity and Energy Balance
The levels of physical activity and energy expenditure among participants were obtained
using a three day physical activity diary. For each activity so performed, Metabolic Equivalent of
Task (MET) was utilized (13).Schofield equation aided in calculation of Basal Metabolic Rate
(BMR) (14). Group values of energy expenditure was obtained via the Active Australia Survey
(15).
Statistical Analysis
The data was statistically analyzed using STATA SE 14 Software, with statistical significance of
p < 0.05. The mean and standard deviation of energy expenditure values obtained from both
methods of three day physical activity record and Active Australia Survey was obtained. Paired t
test and Pearson’s Correlation Coefficient were used correlate and compare the results of
physical activity and energy expenditure levels between the three day physical activity record
and Active Australia Survey (12).
Anthropometrics
The anthropometric measurements of participants were collected. The percentage of body
fat was calculated with the help of skinfold measurements using calipers (16). Bioelectrical
impedance methods via Tanita BC-418 Body Composition Analyserwas also used to estimate the
percentage of body fat among participants (17).
⊘ This is a preview!⊘
Do you want full access?
Subscribe today to unlock all pages.
Trusted by 1+ million students worldwide
9NUTRITION AND PHYSICAL ACTIVITY ASSESSMENT
Statistical Analysis
The data was analyzed statistically using STATA SE 14 Software, with significance of p < 0.05.
The mean and standard deviations of participants; height, weight and body mass index were
calculated. Paired t test and Pearson’s Correlated Coefficient were used to correlate and compare
the body fat percentage obtained between methods of skinfold measurements and bioelectrical
impedance methods (12).
Results
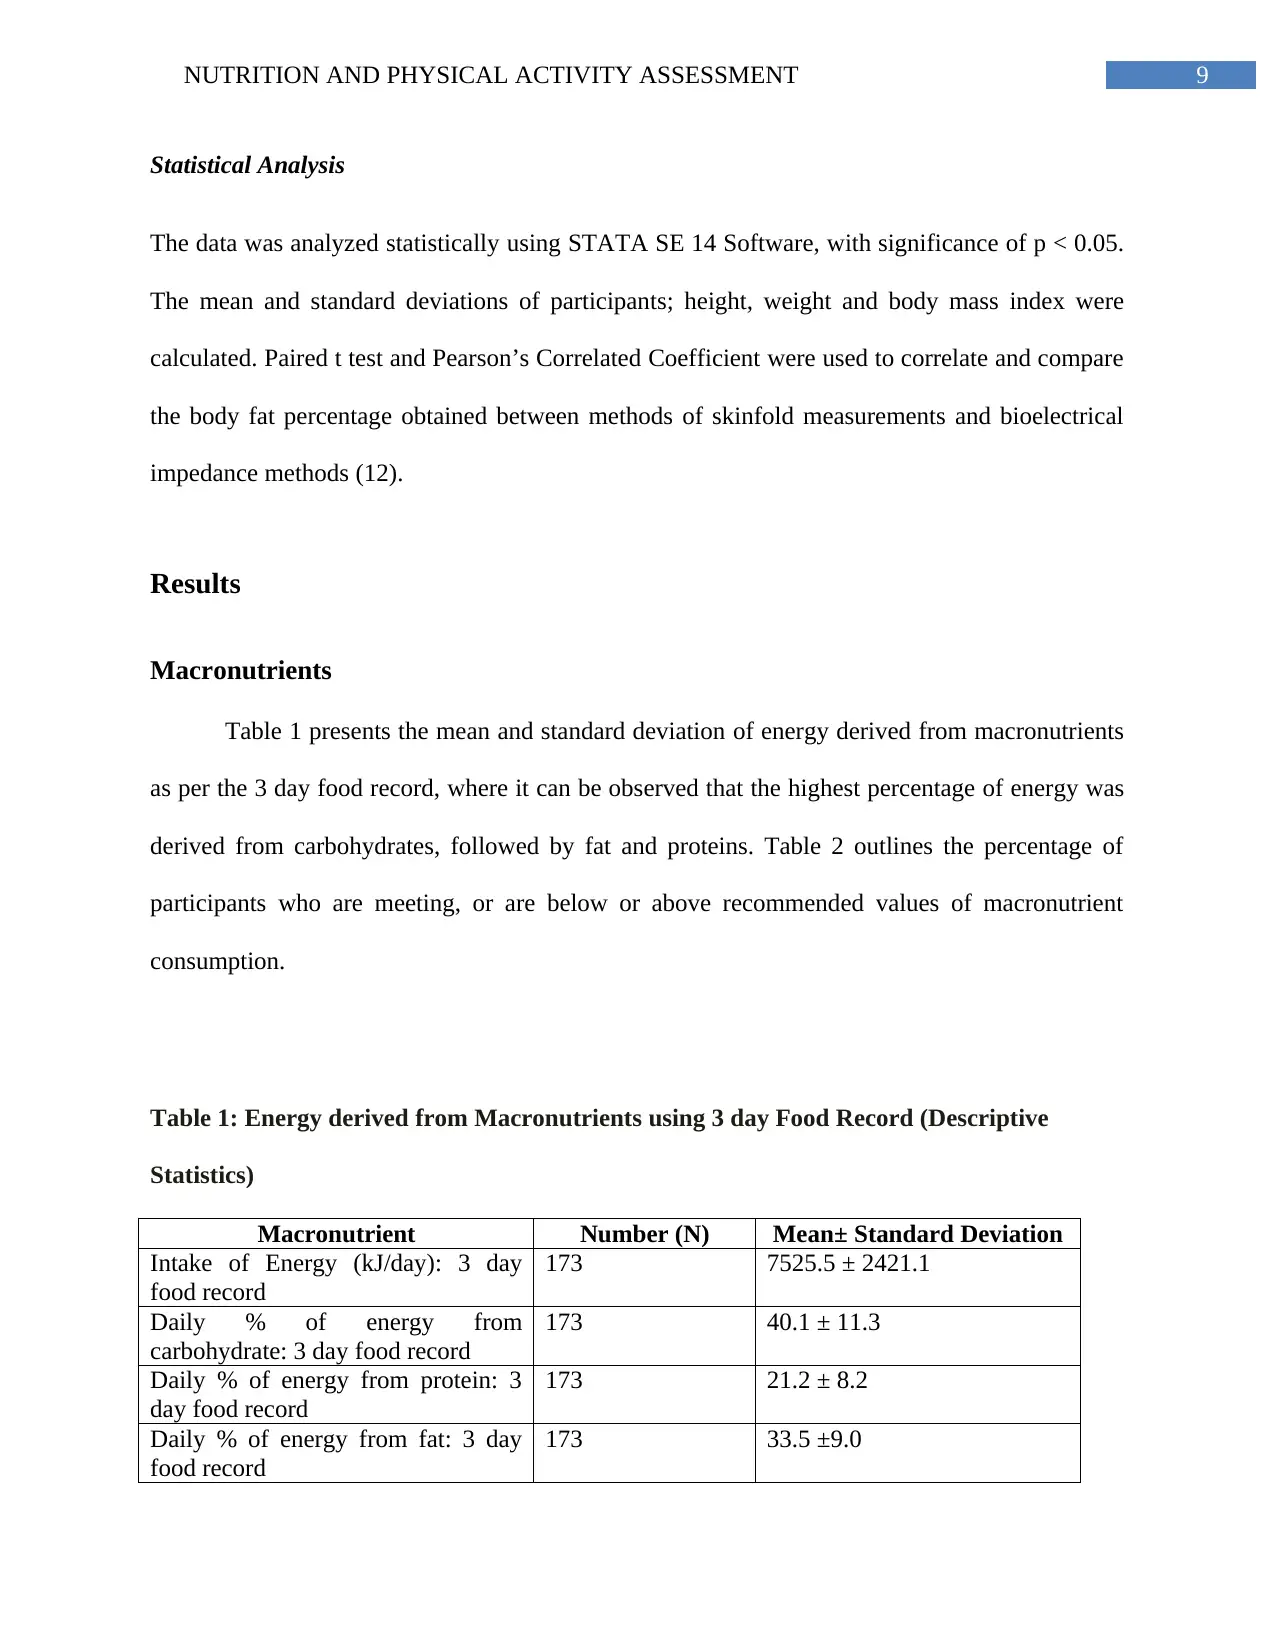
Macronutrients
Table 1 presents the mean and standard deviation of energy derived from macronutrients
as per the 3 day food record, where it can be observed that the highest percentage of energy was
derived from carbohydrates, followed by fat and proteins. Table 2 outlines the percentage of
participants who are meeting, or are below or above recommended values of macronutrient
consumption.
Table 1: Energy derived from Macronutrients using 3 day Food Record (Descriptive
Statistics)
Macronutrient Number (N) Mean± Standard Deviation
Intake of Energy (kJ/day): 3 day
food record
173 7525.5 ± 2421.1
Daily % of energy from
carbohydrate: 3 day food record
173 40.1 ± 11.3
Daily % of energy from protein: 3
day food record
173 21.2 ± 8.2
Daily % of energy from fat: 3 day
food record
173 33.5 ±9.0
Statistical Analysis
The data was analyzed statistically using STATA SE 14 Software, with significance of p < 0.05.
The mean and standard deviations of participants; height, weight and body mass index were
calculated. Paired t test and Pearson’s Correlated Coefficient were used to correlate and compare
the body fat percentage obtained between methods of skinfold measurements and bioelectrical
impedance methods (12).
Results
Macronutrients
Table 1 presents the mean and standard deviation of energy derived from macronutrients
as per the 3 day food record, where it can be observed that the highest percentage of energy was
derived from carbohydrates, followed by fat and proteins. Table 2 outlines the percentage of
participants who are meeting, or are below or above recommended values of macronutrient
consumption.
Table 1: Energy derived from Macronutrients using 3 day Food Record (Descriptive
Statistics)
Macronutrient Number (N) Mean± Standard Deviation
Intake of Energy (kJ/day): 3 day
food record
173 7525.5 ± 2421.1
Daily % of energy from
carbohydrate: 3 day food record
173 40.1 ± 11.3
Daily % of energy from protein: 3
day food record
173 21.2 ± 8.2
Daily % of energy from fat: 3 day
food record
173 33.5 ±9.0
Paraphrase This Document
Need a fresh take? Get an instant paraphrase of this document with our AI Paraphraser
10NUTRITION AND PHYSICAL ACTIVITY ASSESSMENT
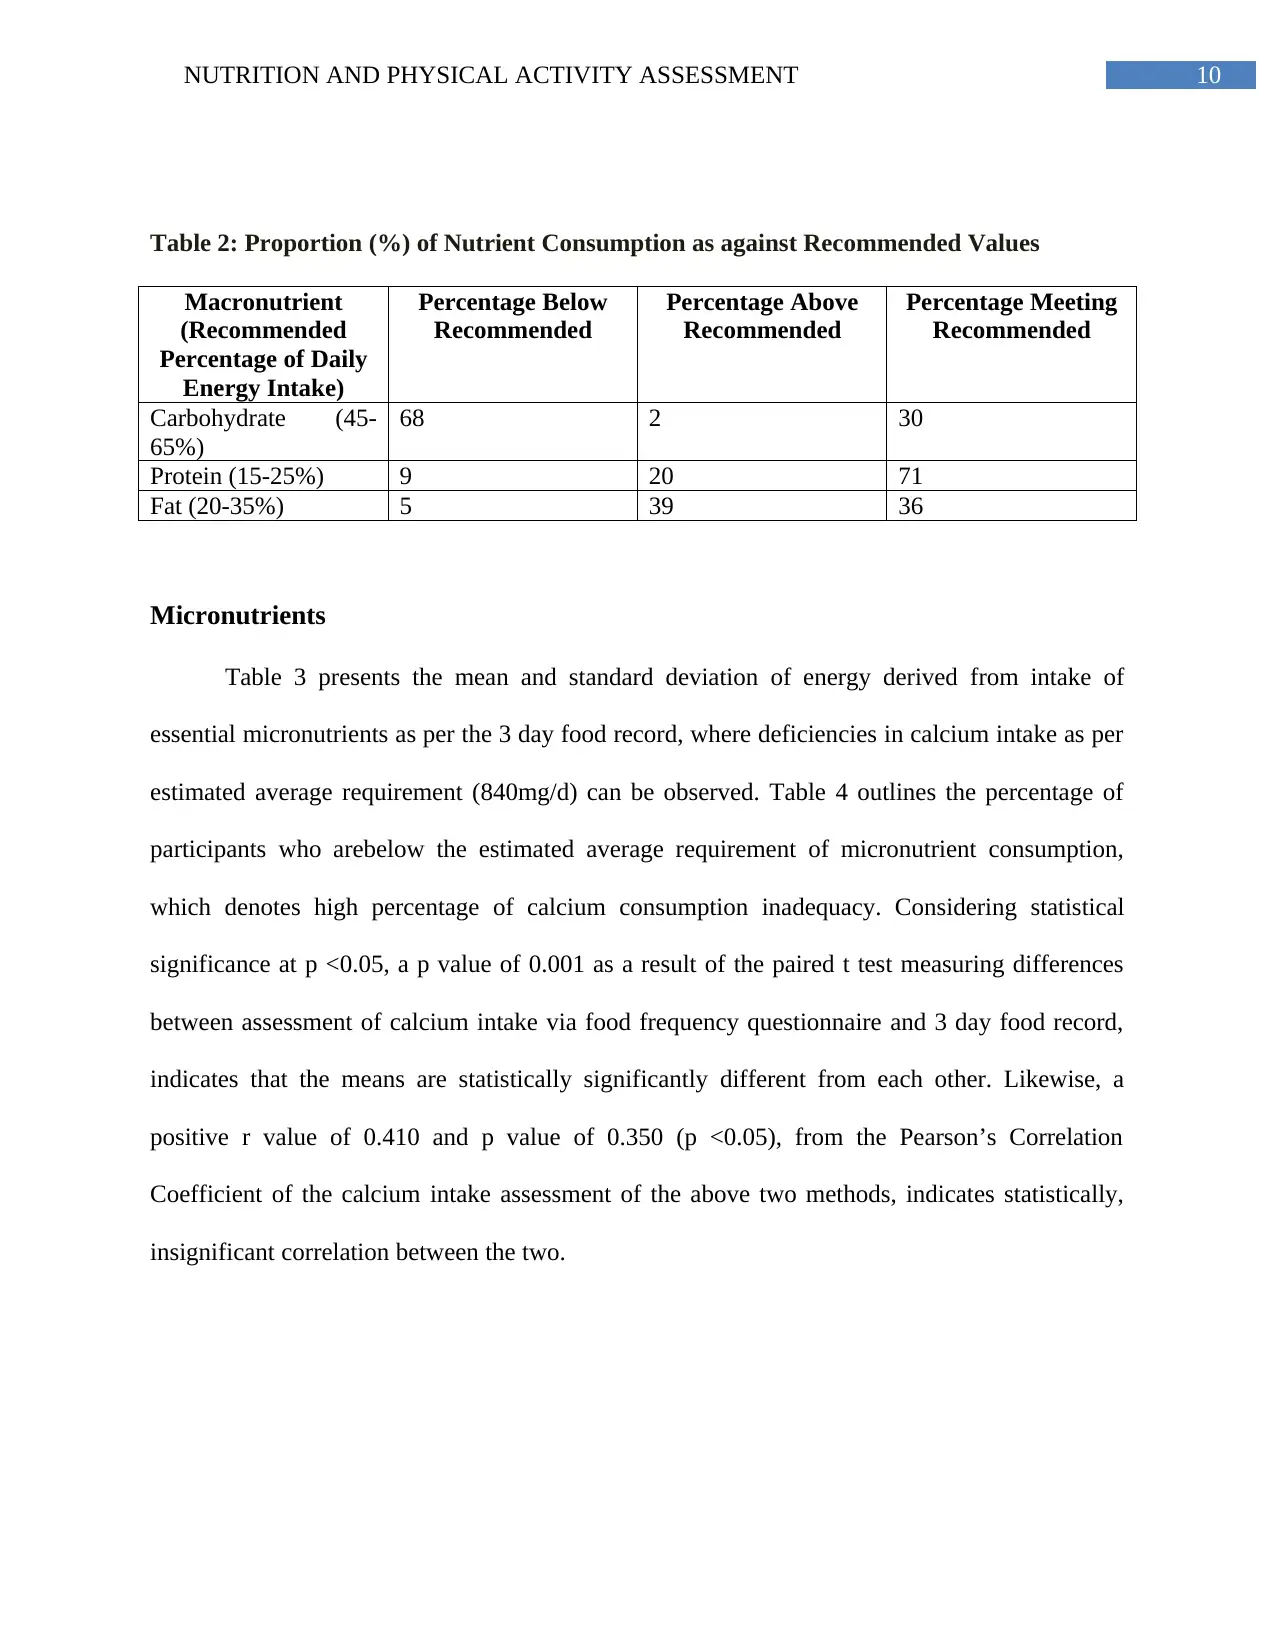
Table 2: Proportion (%) of Nutrient Consumption as against Recommended Values
Macronutrient
(Recommended
Percentage of Daily
Energy Intake)
Percentage Below
Recommended
Percentage Above
Recommended
Percentage Meeting
Recommended
Carbohydrate (45-
65%)
68 2 30
Protein (15-25%) 9 20 71
Fat (20-35%) 5 39 36
Micronutrients
Table 3 presents the mean and standard deviation of energy derived from intake of
essential micronutrients as per the 3 day food record, where deficiencies in calcium intake as per
estimated average requirement (840mg/d) can be observed. Table 4 outlines the percentage of
participants who arebelow the estimated average requirement of micronutrient consumption,
which denotes high percentage of calcium consumption inadequacy. Considering statistical
significance at p <0.05, a p value of 0.001 as a result of the paired t test measuring differences
between assessment of calcium intake via food frequency questionnaire and 3 day food record,
indicates that the means are statistically significantly different from each other. Likewise, a
positive r value of 0.410 and p value of 0.350 (p <0.05), from the Pearson’s Correlation
Coefficient of the calcium intake assessment of the above two methods, indicates statistically,
insignificant correlation between the two.
11NUTRITION AND PHYSICAL ACTIVITY ASSESSMENT
Table 3: Group Micronutrient Intake (Descriptive Statistics)
Micronutrient Number (N) Mean ± Standard Deviation
Calcium Intake (mg/d) – 3 day
food record
173 726.9 ± 344.3
Calcium Intake (mg/d) – Food
Frequency Questionnaire
173 630.7 ± 447.6
Iron Intake (mg/d) – 3 day
food record
173 11.7 ± 5.8
Folate Intake (ug/d) – 3 day
food record
173 391.2 ± 180.1
Zinc Intake (mg/d) – 3 day
food record
173 10.9 ± 7.7
Vitamin C (mg/d) – 3 day
food record
173 105.1 ± 72.1
Table 4: Proportion (%) at risk of Inadequate Micronutrient Intake (3 Day Food Record)
Micronutrient Number Below Estimated
Average Requirement
(EAR)
% Below EAR
Calcium 118 68.21%
Folate 61 35.26%
Vitamin C 17 9.83%
Zinc (Women) 34 19.65%
Iron (Women) 87 50.33%
Physical Activity and Energy Balance
Table 5 outlines the mean and standard deviation of the energy intake and energy
expenditure from 3 day diary as well as the group results of the Active Australia Survey.
Considering a statistical significance of p <0.05, a p value of <0.001 from the paired t test
conducted between the means of energy expenditure obtained from the 3 day diary and the
Active Australia Survey, indicate that the means of both methods are statistically, significantly
different from each other. Likewise, a positive r value of 0.040 and p value of 0.640 (p <0.05),
indicates statistically insignificant correlation between the two methods.
⊘ This is a preview!⊘
Do you want full access?
Subscribe today to unlock all pages.
Trusted by 1+ million students worldwide
1 out of 24
Related Documents


Your All-in-One AI-Powered Toolkit for Academic Success.
+13062052269
info@desklib.com
Available 24*7 on WhatsApp / Email
![[object Object]](/_next/static/media/star-bottom.7253800d.svg)
Unlock your academic potential
Copyright © 2020–2026 A2Z Services. All Rights Reserved. Developed and managed by ZUCOL.