Deakin University HSN305: Female Nutritional Assessment Report

Verified

Added on  2022/10/01

|13
|2276
|11
Report
AI Summary
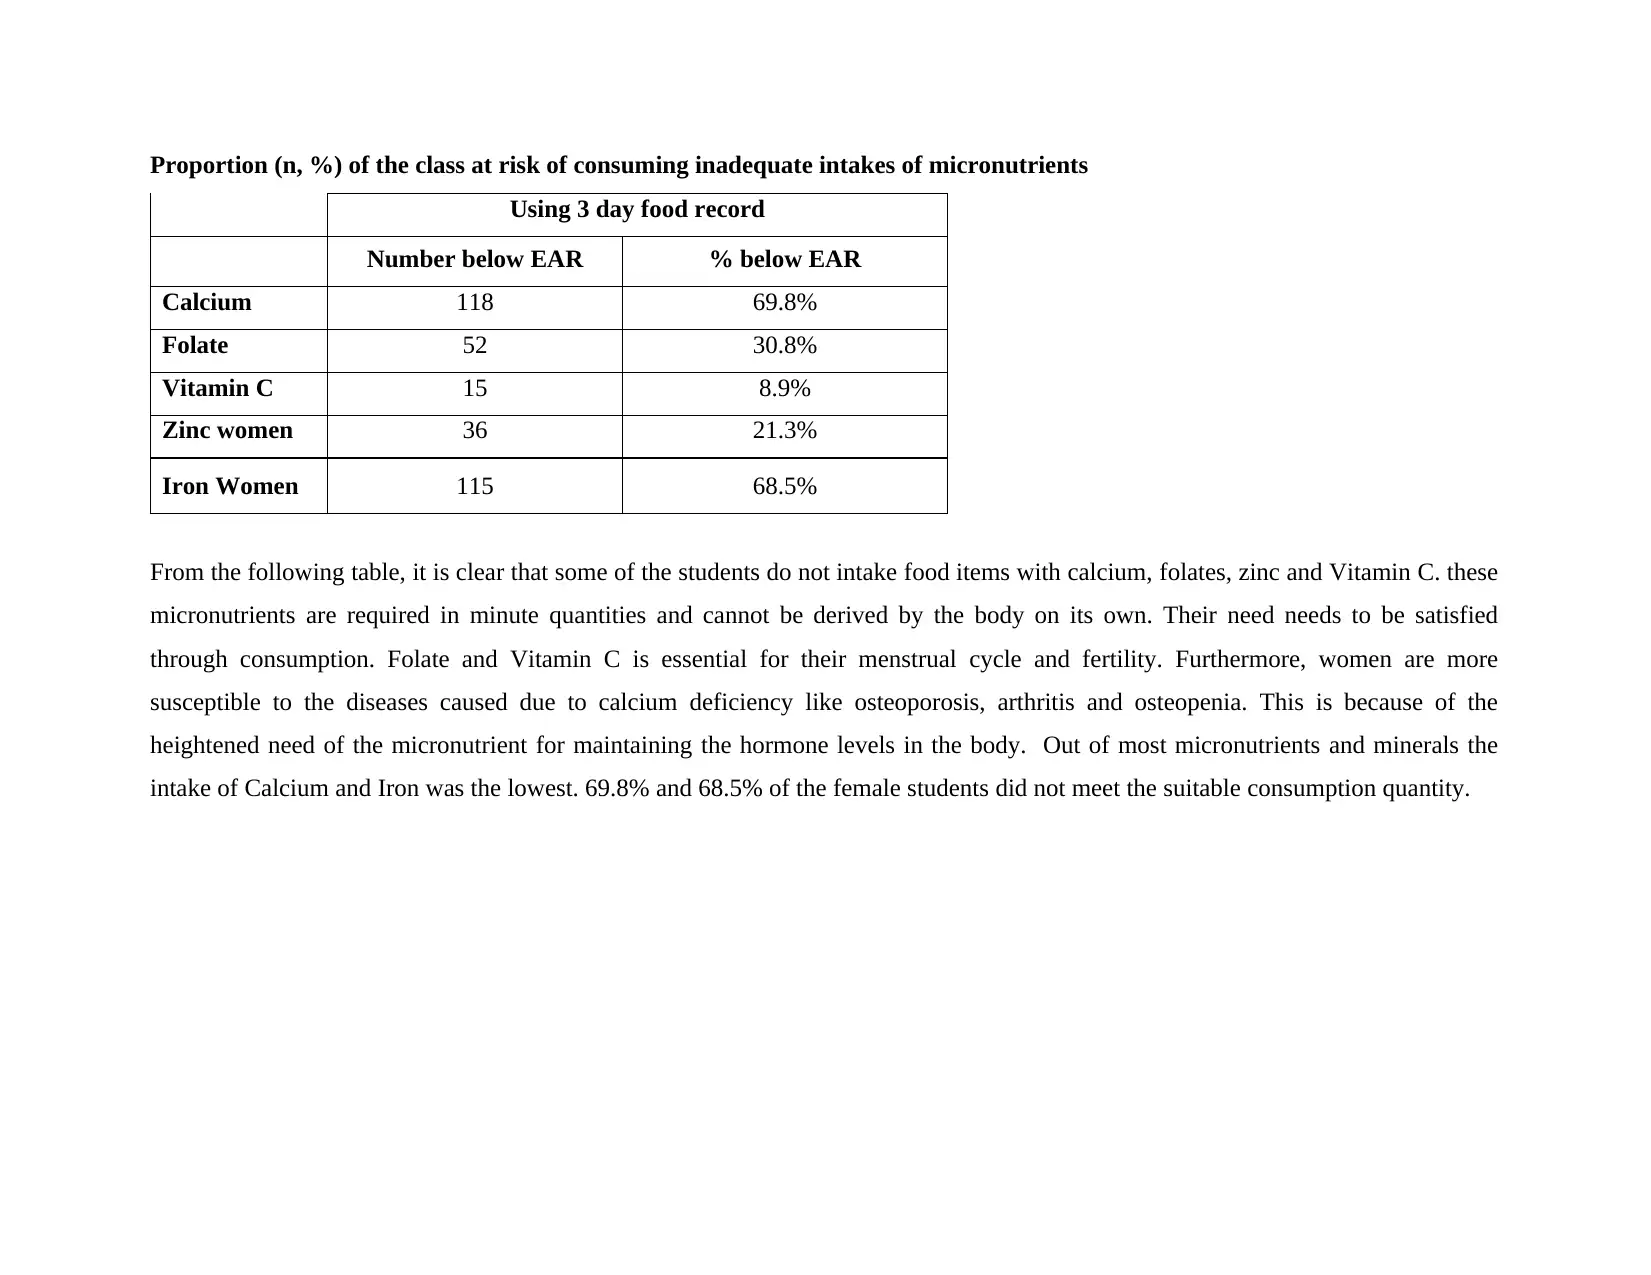
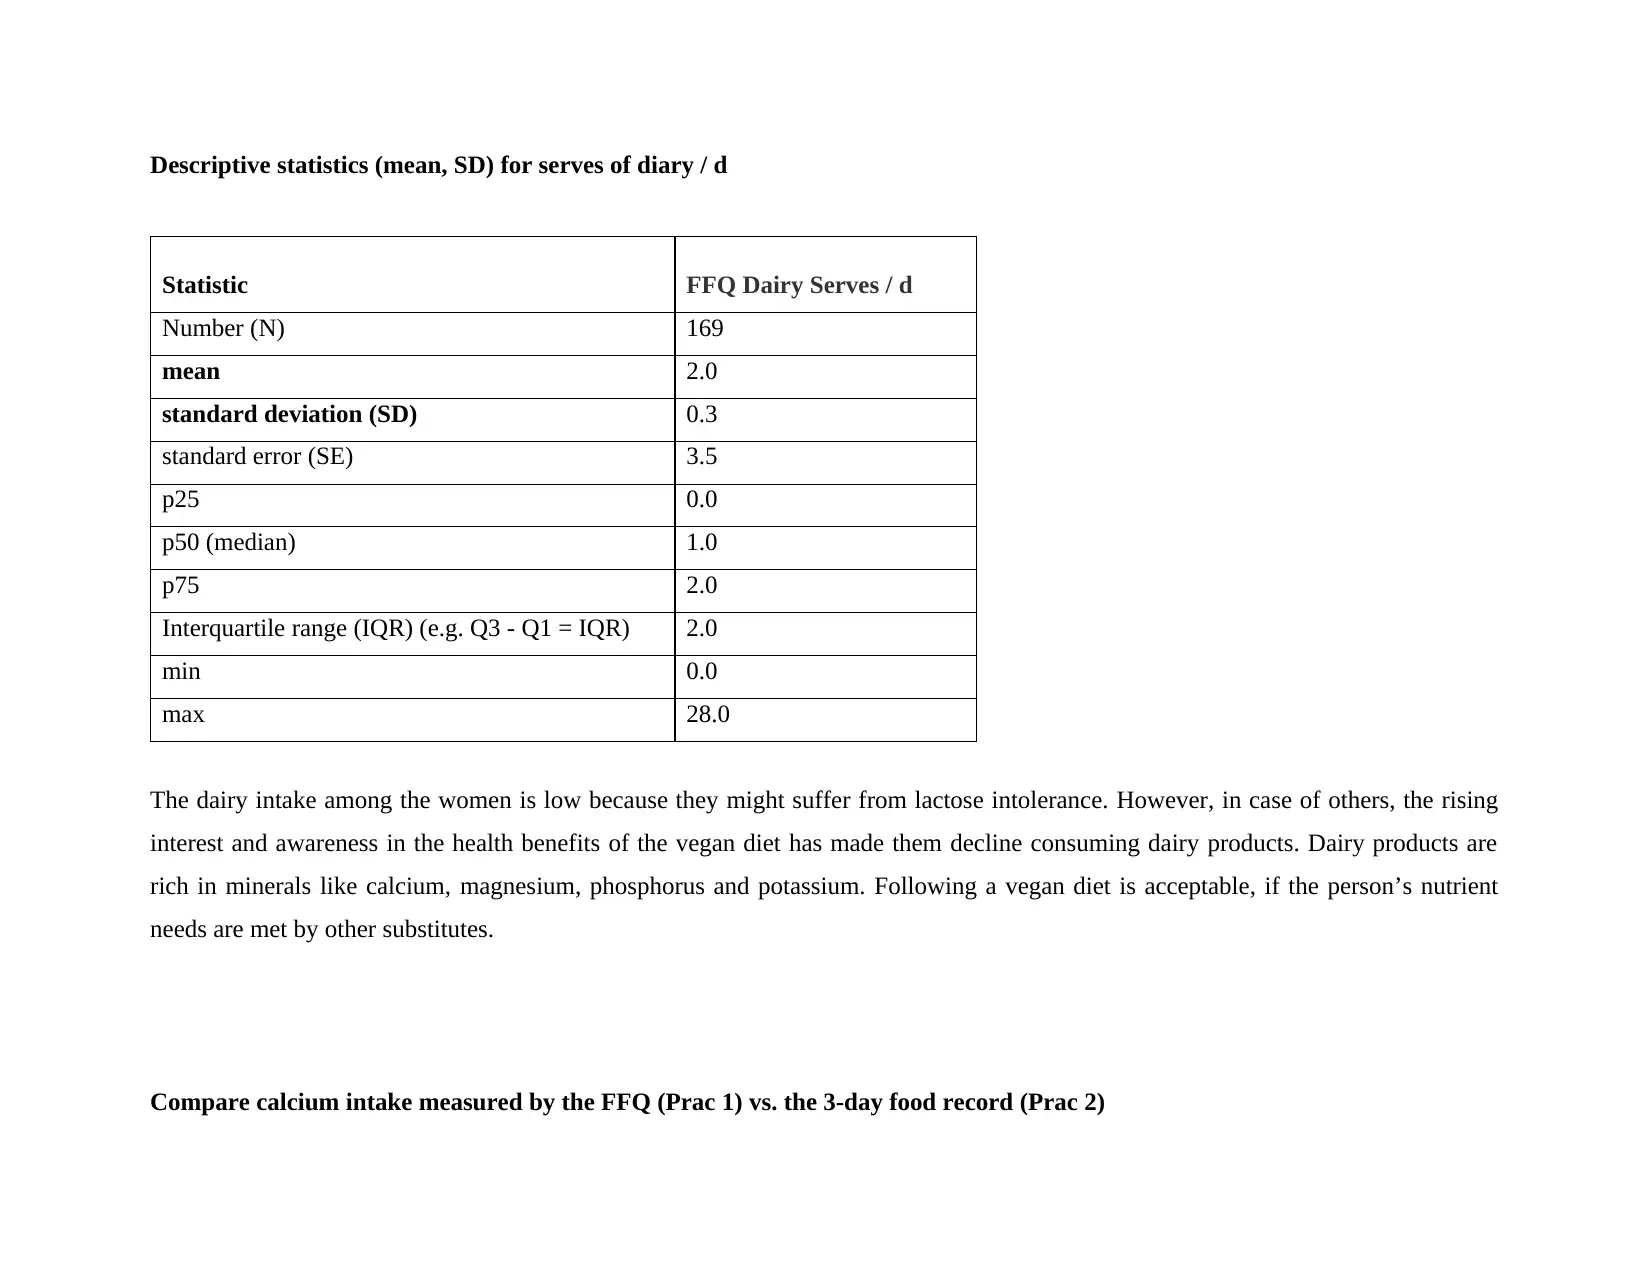
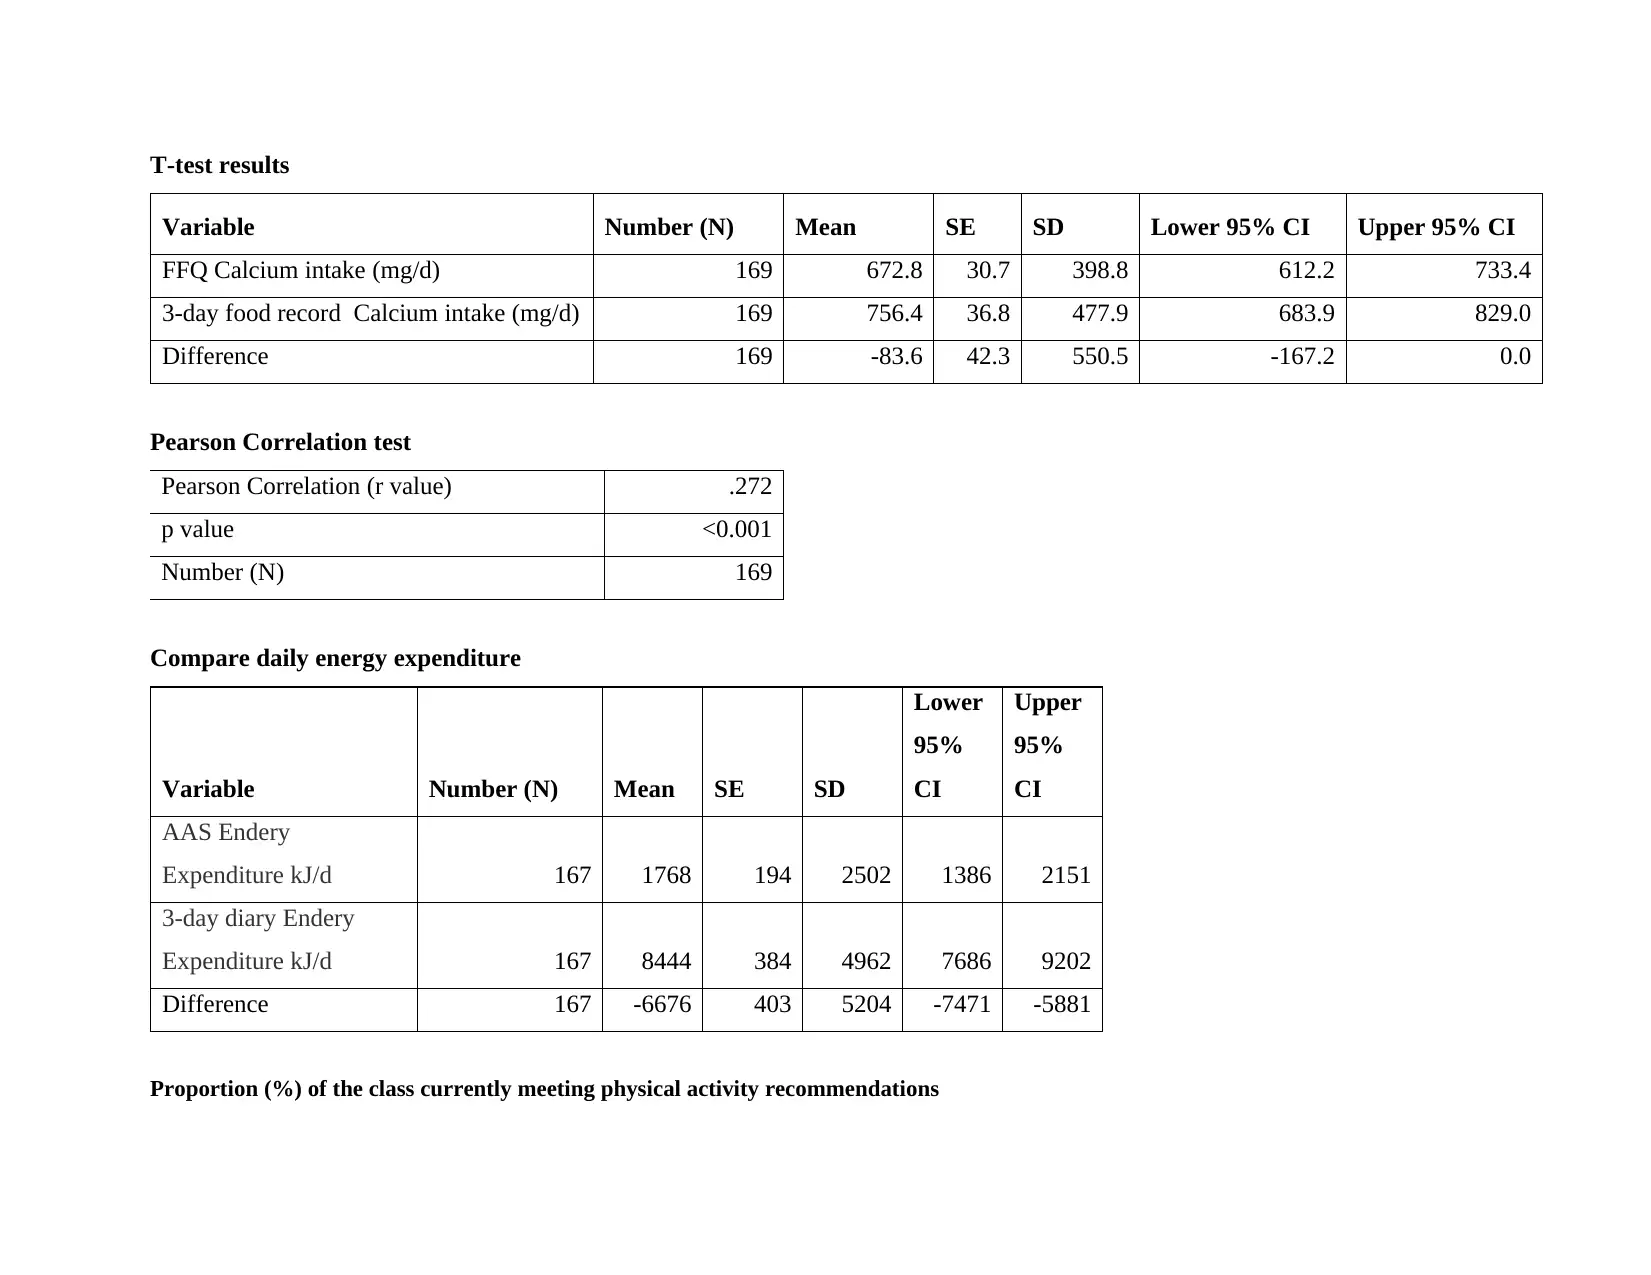
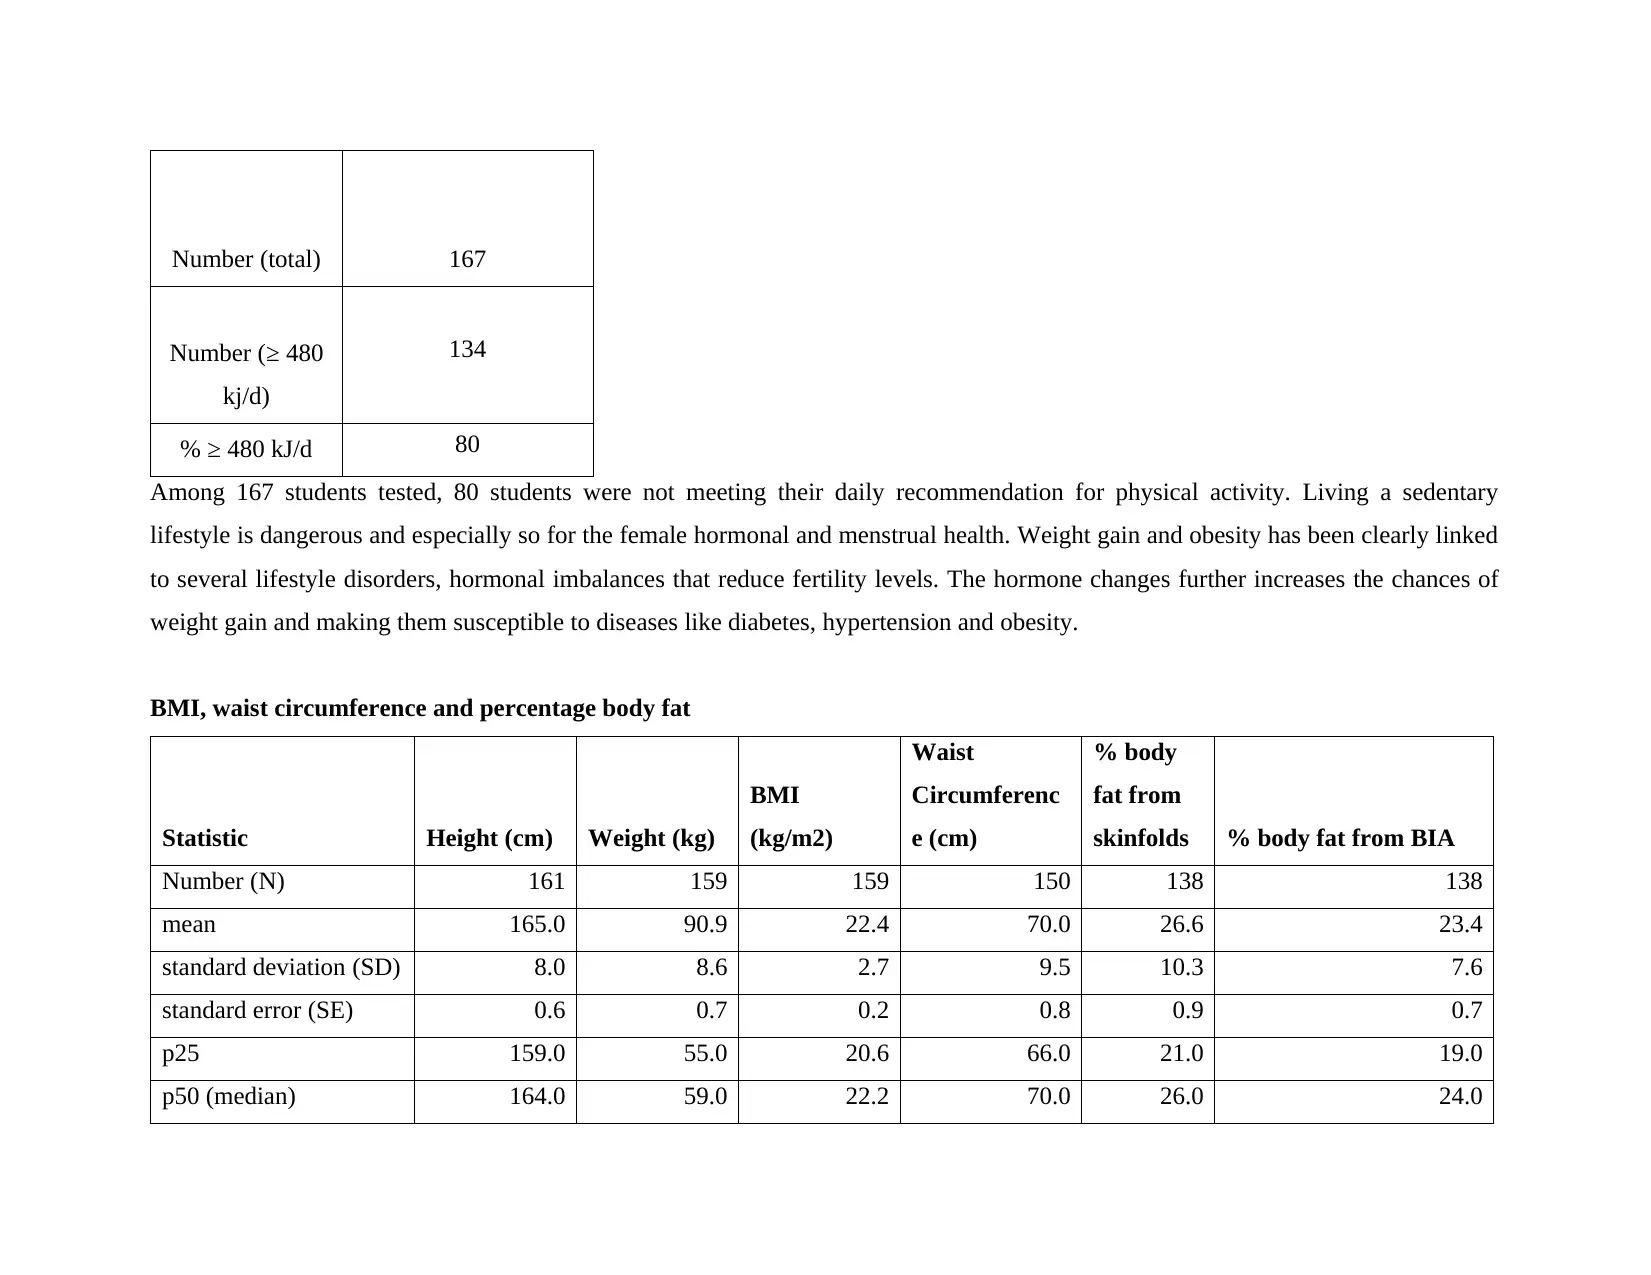
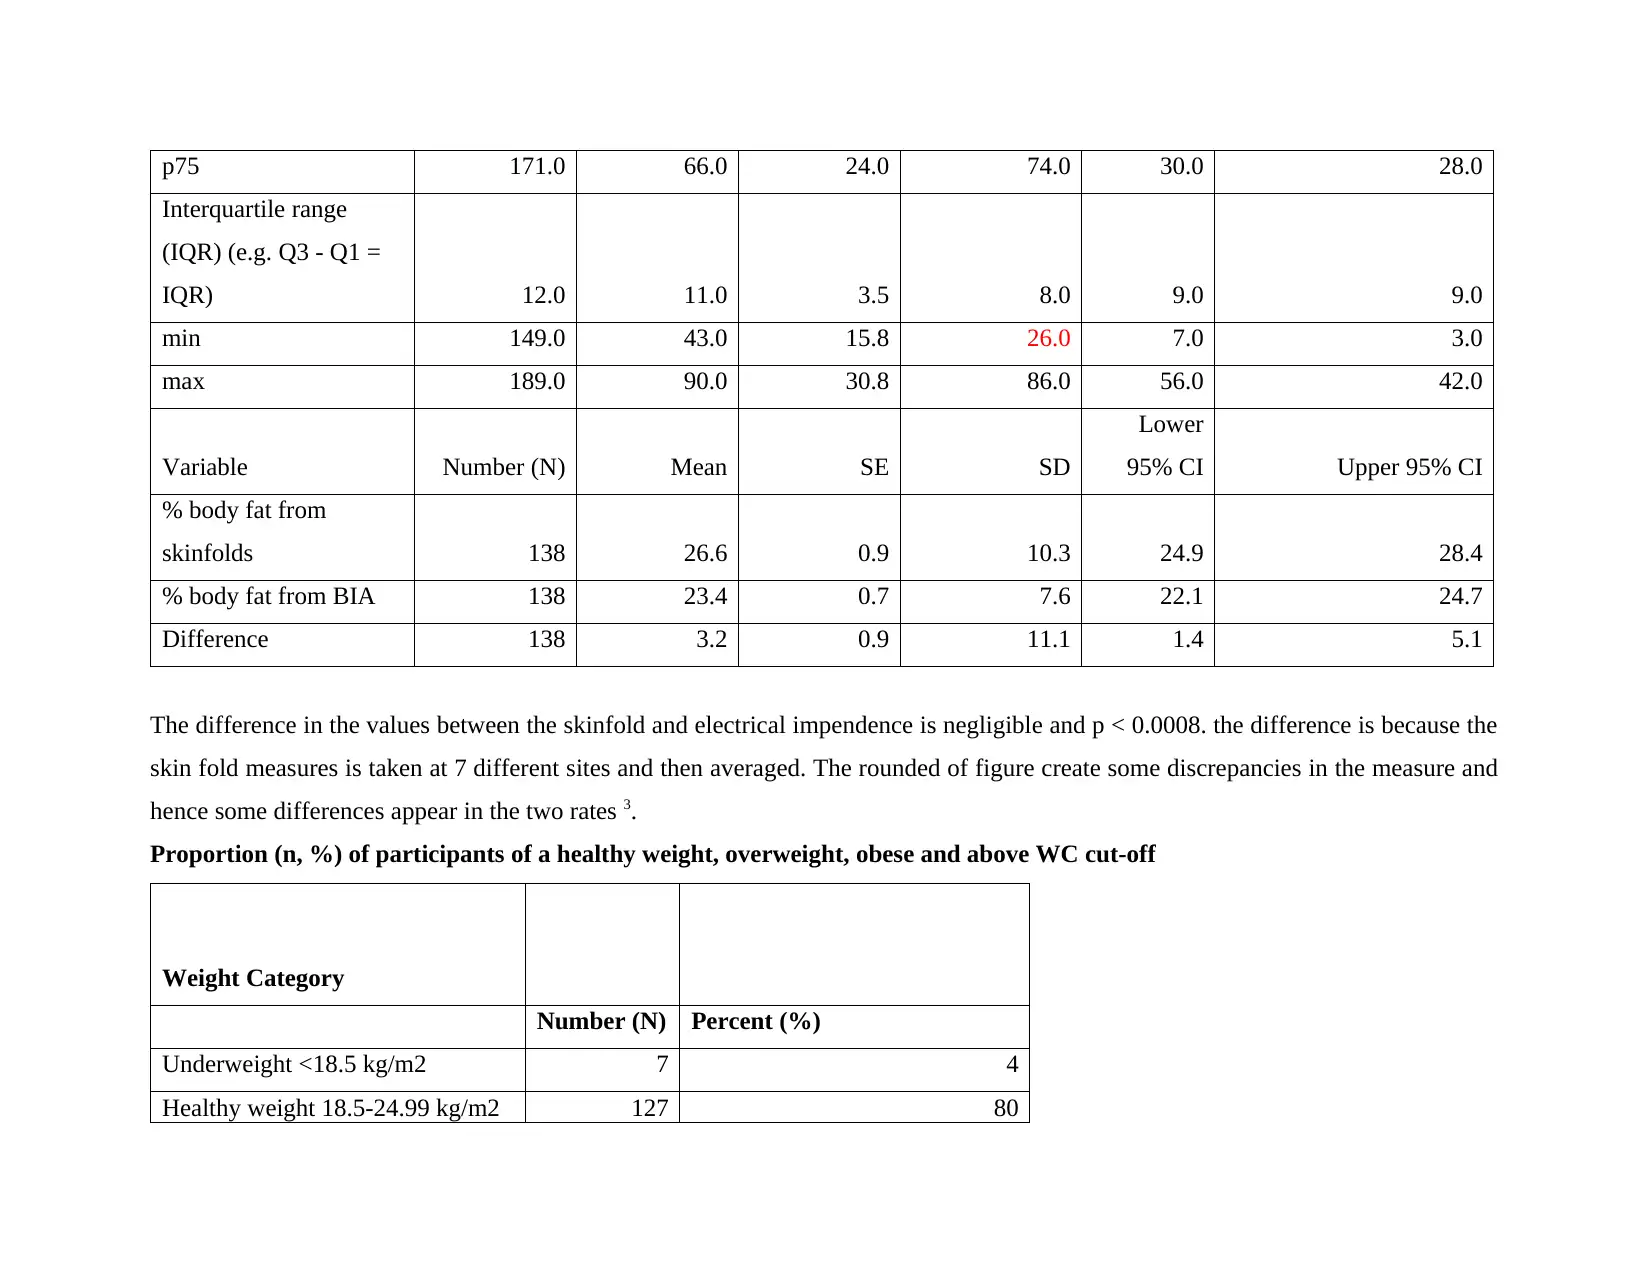
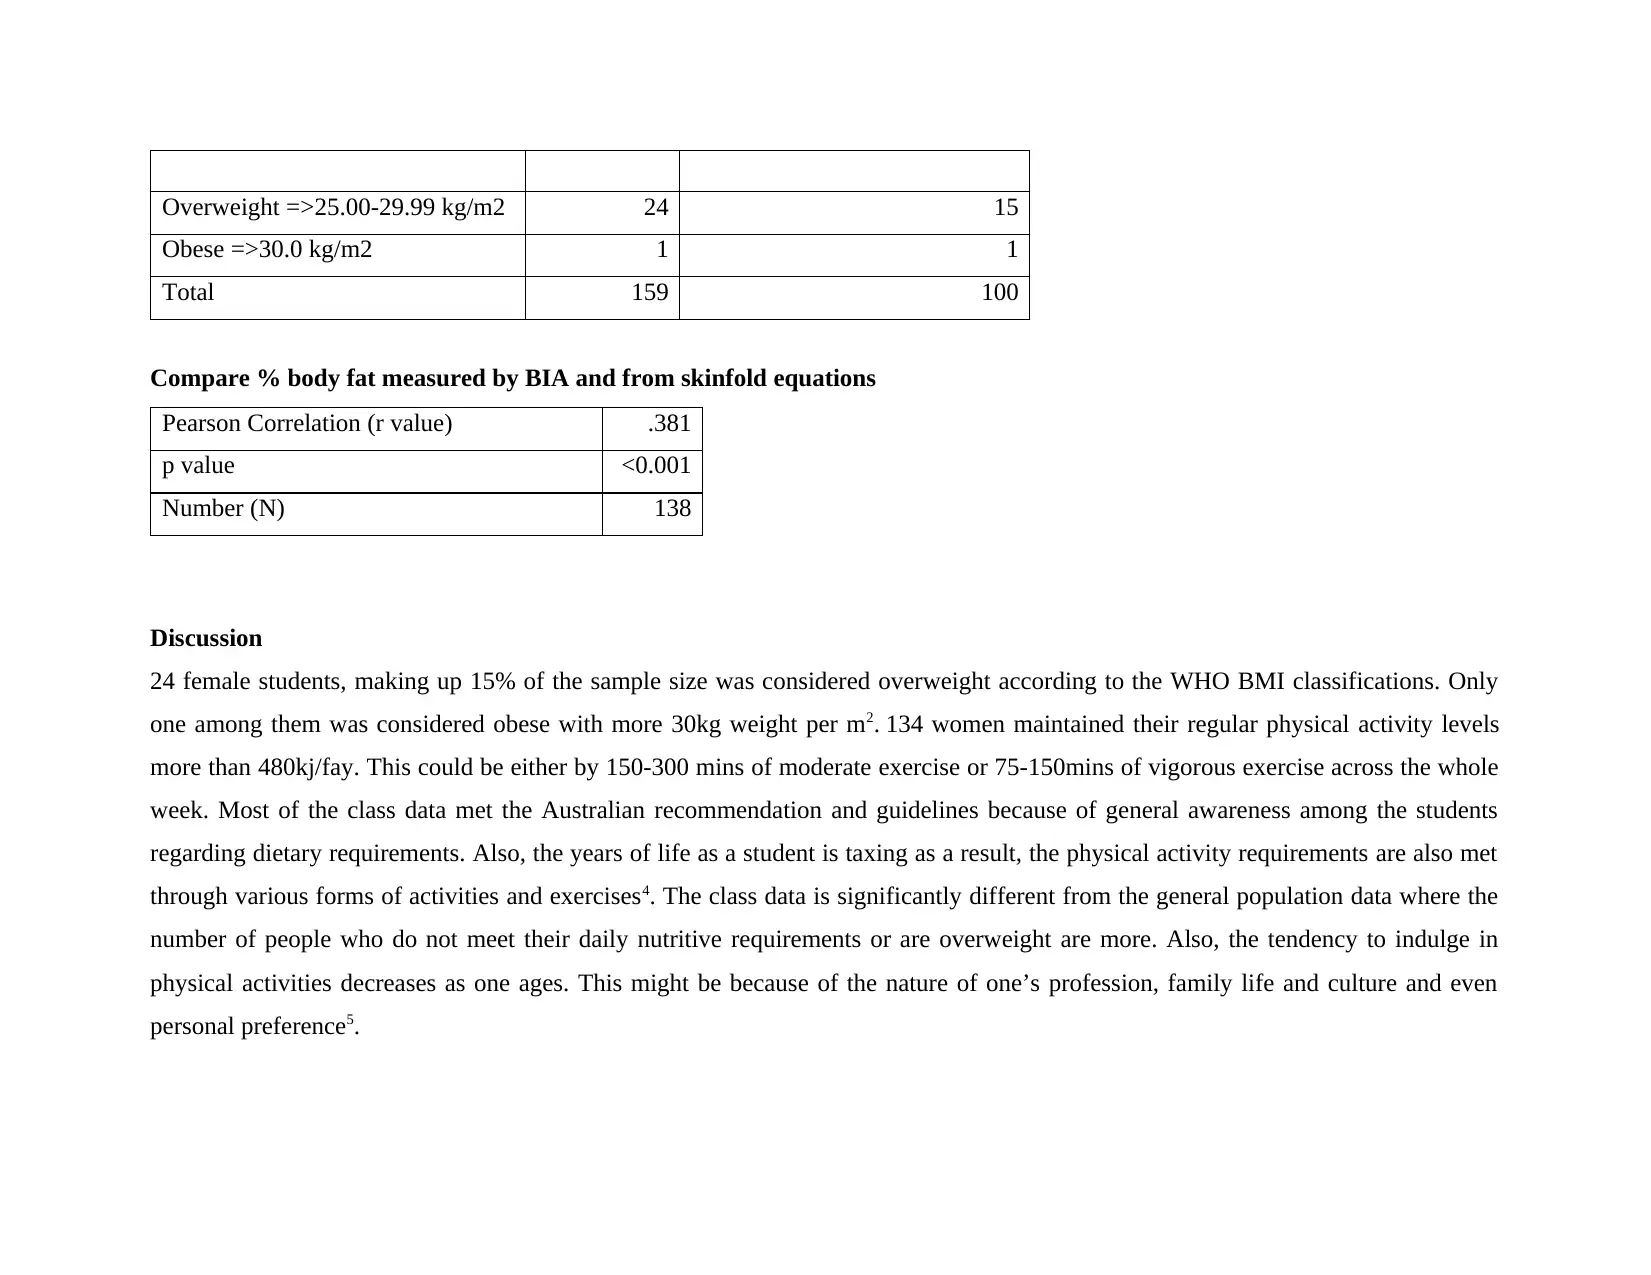
This report presents an analysis of data collected from 178 female students as part of the HSN305 course, focusing on their nutritional intake, physical activity levels, and anthropometric measurements. The study assessed food intake using 3-day food records and questionnaires, revealing significant deficiencies in micronutrients like calcium, folate, vitamin C, and zinc, with a large percentage of students not meeting recommended intake levels. Physical activity was also evaluated, with a substantial proportion of students failing to meet daily recommendations. Anthropometric data, including BMI, waist circumference, and body fat percentage, were analyzed, showing that a significant portion of the students were overweight. The report compares the data with established guidelines and population norms, highlighting the potential health implications of these findings and discussing the strengths and limitations of the assessment methods used. The study concludes by emphasizing the importance of addressing the nutritional and activity needs of female students to promote their overall health and well-being, and provides valuable insights into the health and nutrition of female students.
Document Page
Assessment of food intake and activity
Introduction
Issues related to food intake values like malnutrition has been well researched in the past decades. It is a common issue in the
developing or the under-developed countries. The following study is an analysis of the data to find out about the health condition
among women. Women have different nutritional needs due to their menstrual health, pregnancy, breastfeeding and menopause.
Micronutrients and mineral are essential to maintain hormone flow in the body. As a result, women may need higher quantities of
nutrients than men. Moreover, the prevalence of dieting and weight-related food intake variation is also more popular among women.
The interplay of hormones may result in cravings of certain food items that also impact the health and nutrition among them 1. It
becomes even more difficult to manage their normal diet in such cases. Due to their menstrual flow, women have an increased
requirement of iron. Calcium is another mineral that is essential for regulating the thyroid hormone which is again associated with
reproductive health2.
Methods
The sample size of 221 students was chosen but 43 of them were males and were excluded since this analysis focuses only on the
nutritional demands among women. The rest data collected from 178 females have been included in the analysis. The average age of
the students was 24 (SD 6.0). Age of the respondents was within 19 to 51 years. The consent of the students was gained and they were
also asked to present their acknowledgement through a written form. They were briefed about the process and were asked to maintain
to close watch on the food items and its quantity they were having for the three days. They were asked to eat according to their normal
preference and habit rather than maintaining a healthier diet only for the 3 days. A form was provided to the students, that allowed
them to record the food they ate in a systematic manner. They were also asked to fill a set of questionnaires that recorded their
demographics, height, weight and any health issues.
In order to analyse the statistical data, STATA SE 15 was used. The statistical significance was p < 0.05. In order to assess the
differences between the means obtained through various assessments, t-test was used. Pearson’s Correlation Coefficient was used for
tabler-icon-diamond-filled.svg

Secure Best Marks with AI Grader

Need help grading? Try our AI Grader for instant feedback on your assignments.
Document Page
the correlation process and the inadequacy of micronutrients like calcium, folate, vitamin C and zinc was measured through the EAR
cut-point method.
Document Page
Results
Statistic
Energy intake
(kJ/d) - 3 day
food record
Number (N) 169
mean 7546.2
standard deviation (SD) 187.1
standard error (SE) 2432.5
p25 6112.0
p50 (median) 7300.0
p75 8672.0
Interquartile range (IQR) (e.g. Q3 - Q1 =
IQR) 2560.0
min 1400.0
max 19748.0
Document Page
Percentage energy derived from fat, carbohydrate, protein and micronutrient intakes
Statistic
Daily
%
energy
from
fat - 3
day
food
record
Daily %
energy from
carbohydrate
- 3 day food
record
Daily %
energy
from
protein -
3 day
food
record
Calcium
intake
(mg/d) -
3 day
food
record
Iron
intake
(mg/d)
- 3 day
food
record
Folate
intake
(ug/d) -
3 day
food
record
Vitamin
C intake
(mg/d) -
3 day
food
record
Zinc
intake
(mg/d) -
3 day
food
record
Number (N) 169 169 169 169 169 169 169 169
mean 32.6 41.5 21.0 756.4 12.1 406.6 111.9 10.6
standard deviation (SD) 0.7 1.0 0.8 36.8 0.5 14.4 7.5 0.7
standard error (SE) 8.6 12.7 10.0 477.9 7.0 187.5 97.5 9.3
p25 27.0 35.0 16.0 506.0 8.0 300.0 54.0 7.0
p50 (median) 33.0 42.0 19.0 715.0 11.0 384.0 90.0 9.0
p75 38.0 48.0 23.0 910.0 14.0 500.0 134.0 11.0
Interquartile range (IQR) (e.g. Q3 -
Q1 = IQR) 11.0 13.0 7.0 404.0 6.0 200.0 80.0 4.0
min 3.0 2.0 1.0 0.0 0.0 0.0 0.0 0.0
max 60.0 90.0 89.0 4973.0 52.0 1000.0 842.0 91.0
tabler-icon-diamond-filled.svg

Secure Best Marks with AI Grader

Need help grading? Try our AI Grader for instant feedback on your assignments.
Document Page
Proportion (n, %) of the class at risk of consuming inadequate intakes of micronutrients
Using 3 day food record
Number below EAR % below EAR
Calcium 118 69.8%
Folate 52 30.8%
Vitamin C 15 8.9%
Zinc women 36 21.3%
Iron Women 115 68.5%
From the following table, it is clear that some of the students do not intake food items with calcium, folates, zinc and Vitamin C. these
micronutrients are required in minute quantities and cannot be derived by the body on its own. Their need needs to be satisfied
through consumption. Folate and Vitamin C is essential for their menstrual cycle and fertility. Furthermore, women are more
susceptible to the diseases caused due to calcium deficiency like osteoporosis, arthritis and osteopenia. This is because of the
heightened need of the micronutrient for maintaining the hormone levels in the body. Out of most micronutrients and minerals the
intake of Calcium and Iron was the lowest. 69.8% and 68.5% of the female students did not meet the suitable consumption quantity.
Document Page
Descriptive statistics (mean, SD) for serves of diary / d
Statistic FFQ Dairy Serves / d
Number (N) 169
mean 2.0
standard deviation (SD) 0.3
standard error (SE) 3.5
p25 0.0
p50 (median) 1.0
p75 2.0
Interquartile range (IQR) (e.g. Q3 - Q1 = IQR) 2.0
min 0.0
max 28.0
The dairy intake among the women is low because they might suffer from lactose intolerance. However, in case of others, the rising
interest and awareness in the health benefits of the vegan diet has made them decline consuming dairy products. Dairy products are
rich in minerals like calcium, magnesium, phosphorus and potassium. Following a vegan diet is acceptable, if the person’s nutrient
needs are met by other substitutes.
Compare calcium intake measured by the FFQ (Prac 1) vs. the 3-day food record (Prac 2)
Document Page
T-test results
Variable Number (N) Mean SE SD Lower 95% CI Upper 95% CI
FFQ Calcium intake (mg/d) 169 672.8 30.7 398.8 612.2 733.4
3-day food record Calcium intake (mg/d) 169 756.4 36.8 477.9 683.9 829.0
Difference 169 -83.6 42.3 550.5 -167.2 0.0
Pearson Correlation test
Pearson Correlation (r value) .272
p value <0.001
Number (N) 169
Compare daily energy expenditure
Variable Number (N) Mean SE SD
Lower
95%
CI
Upper
95%
CI
AAS Endery
Expenditure kJ/d 167 1768 194 2502 1386 2151
3-day diary Endery
Expenditure kJ/d 167 8444 384 4962 7686 9202
Difference 167 -6676 403 5204 -7471 -5881
Proportion (%) of the class currently meeting physical activity recommendations
tabler-icon-diamond-filled.svg

Paraphrase This Document

Need a fresh take? Get an instant paraphrase of this document with our AI Paraphraser
Document Page
Number (total) 167
Number (≥ 480
kj/d)
134
% ≥ 480 kJ/d 80
Among 167 students tested, 80 students were not meeting their daily recommendation for physical activity. Living a sedentary
lifestyle is dangerous and especially so for the female hormonal and menstrual health. Weight gain and obesity has been clearly linked
to several lifestyle disorders, hormonal imbalances that reduce fertility levels. The hormone changes further increases the chances of
weight gain and making them susceptible to diseases like diabetes, hypertension and obesity.
BMI, waist circumference and percentage body fat
Statistic Height (cm) Weight (kg)
BMI
(kg/m2)
Waist
Circumferenc
e (cm)
% body
fat from
skinfolds % body fat from BIA
Number (N) 161 159 159 150 138 138
mean 165.0 90.9 22.4 70.0 26.6 23.4
standard deviation (SD) 8.0 8.6 2.7 9.5 10.3 7.6
standard error (SE) 0.6 0.7 0.2 0.8 0.9 0.7
p25 159.0 55.0 20.6 66.0 21.0 19.0
p50 (median) 164.0 59.0 22.2 70.0 26.0 24.0
Document Page
p75 171.0 66.0 24.0 74.0 30.0 28.0
Interquartile range
(IQR) (e.g. Q3 - Q1 =
IQR) 12.0 11.0 3.5 8.0 9.0 9.0
min 149.0 43.0 15.8 26.0 7.0 3.0
max 189.0 90.0 30.8 86.0 56.0 42.0
Variable Number (N) Mean SE SD
Lower
95% CI Upper 95% CI
% body fat from
skinfolds 138 26.6 0.9 10.3 24.9 28.4
% body fat from BIA 138 23.4 0.7 7.6 22.1 24.7
Difference 138 3.2 0.9 11.1 1.4 5.1
The difference in the values between the skinfold and electrical impendence is negligible and p < 0.0008. the difference is because the
skin fold measures is taken at 7 different sites and then averaged. The rounded of figure create some discrepancies in the measure and
hence some differences appear in the two rates 3.
Proportion (n, %) of participants of a healthy weight, overweight, obese and above WC cut-off
Weight Category
Number (N) Percent (%)
Underweight <18.5 kg/m2 7 4
Healthy weight 18.5-24.99 kg/m2 127 80
Document Page
Overweight =>25.00-29.99 kg/m2 24 15
Obese =>30.0 kg/m2 1 1
Total 159 100
Compare % body fat measured by BIA and from skinfold equations
Pearson Correlation (r value) .381
p value <0.001
Number (N) 138
Discussion
24 female students, making up 15% of the sample size was considered overweight according to the WHO BMI classifications. Only
one among them was considered obese with more 30kg weight per m2. 134 women maintained their regular physical activity levels
more than 480kj/fay. This could be either by 150-300 mins of moderate exercise or 75-150mins of vigorous exercise across the whole
week. Most of the class data met the Australian recommendation and guidelines because of general awareness among the students
regarding dietary requirements. Also, the years of life as a student is taxing as a result, the physical activity requirements are also met
through various forms of activities and exercises4. The class data is significantly different from the general population data where the
number of people who do not meet their daily nutritive requirements or are overweight are more. Also, the tendency to indulge in
physical activities decreases as one ages. This might be because of the nature of one’s profession, family life and culture and even
personal preference5.
tabler-icon-diamond-filled.svg

Secure Best Marks with AI Grader

Need help grading? Try our AI Grader for instant feedback on your assignments.
Document Page
The intake level of micronutrients depends on the age of the person. The age group of the students who were included in the data
collection process ranged from 18 to 51. This incorporates two separate age groups of 19-30 and 31-50. Calcium level for the two age
groups are 840mg per day6. Almost all the students did not take enough calcium intake. The highest value recorded was 843mg/ day
which is also below the sufficient requirement. However, unlike other micronutrients, all the students had some source of calcium in
their diet. The zinc requirement consists of 12mg a day and the average intake was 10.6mg 7.
The Australian dietary guidelines focused on the intake of five food groups that need to be incorporated in daily diet like vegetable,
fruit, dairy products or suitable alternatives, meat or other animal proteins and cereal based foods8. According to the survey, adult
Australian required at least 3 serving of vegetables per day which consisted of both cooked and uncooked vegetables. On an average
any individual above the age of 2 years requires 1.5 serves of milk, yogurt and other dairy products. After passing the teenage years,
the tendency to consume such products have lowered drastically. One 1 in 10 people meet their dairy requirements in Australia.
The physical activity guideline for Australians between the age of 18 to 64 encourages them to live an active lifestyle and incorporate
some form of exercise in all days of the week as opposed to heavy exertion on individual days. 2 ½ to 5 hours of moderate and 1 ½ to
2 ½ hours of intense physical activity is required every week. Muscle strengthening training is also required irrespective of sex for at
least 2 days a week9. Other guidelines provided defer that long periods of sitting should be avoided and broken by taking breaks of
moderate exercise.
Conclusion
The developed countries and well to do communities have problems of their own. One that has been common is obesity and the
phenomenon of being overweight. Another issue, referred to as overnutrition is also becoming a menace. As is clear from the term, it
is a form of malnutrition where the intake of nutrients exceeds what is required for normal growth and metabolism. Obesity is a part of
overnutrition, it also includes other issues like iron poisoning, high sodium diet and vitamin poisoning10. Even though some people in
the class survey had normal weight, they still did not meet their daily nutrient requirement. This was because the diet consumed was
not balanced as it did not include some fruits, vegetables and dairy products.
Document Page
Document Page
1References
Australian Bureau of Statistics. 2013, National Nutrition and Physical Activity Survey 2011-2012.
Canberra, Australia.
2 Kwok A, Palermo C, Boltong A. Dietary experiences and support needs of women who gain
weight following chemotherapy for breast cancer. Supportive care in cancer. 2015 Jun
1;23(6):1561-8.
3 Durnin JV, Womersley JV. Body fat assessed from total body density and its estimation from
skinfold thickness: measurements on 481 men and women aged from 16 to 72 years. British journal
of nutrition. 1974 Jul;32(1):77-97.
4 Worsley A, Crawford D. Awareness and compliance with the Australian dietary guidelines: a
descriptive study of Melbourne residents. Nutrition Research. 1985 Dec 1;5(12):1291-308.
5 Truswell AS. Evolution of dietary recommendations, goals, and guidelines. The American journal
of clinical nutrition. 1987 May 1;45(5):1060-72.
6 Mok A, Ahmad R, Rangan A, Louie JC. Intake of free sugars and micronutrient dilution in
Australian adults. The American journal of clinical nutrition. 2018 Jan 1;107(1):94-104.
7 Ball K, Mishra GD, Thane CW, Hodge A. How well do Australian women comply with dietary
guidelines?. Public health nutrition. 2004 May;7(3):443-52.
8 Roy R, Hebden L, Rangan A, Allman-Farinelli M. The development, application, and validation of
a healthy eating index for Australian adults (HEIFA—2013). Nutrition. 2016 Apr 1;32(4):432-40.
9 Australian Government Department of Health. Australia's physical activity and sedentary
behaviour guidelines. Dep Heal Website. 2014 Jun.
10 World Health Organization 2000, Obesity: preventing and managing the global epidemic: report
of a WHO consultation on obesity, WHO, Geneva.
chevron_up_icon
1 out of 13
circle_padding
hide_on_mobile
zoom_out_icon
logo.png

Your All-in-One AI-Powered Toolkit for Academic Success.

Available 24*7 on WhatsApp / Email

[object Object]