Financial Management Report: Analysis of Stocks on NYSE and NASDAQ

Verified

Added on  2022/11/17

|7
|862
|424
Report
AI Summary
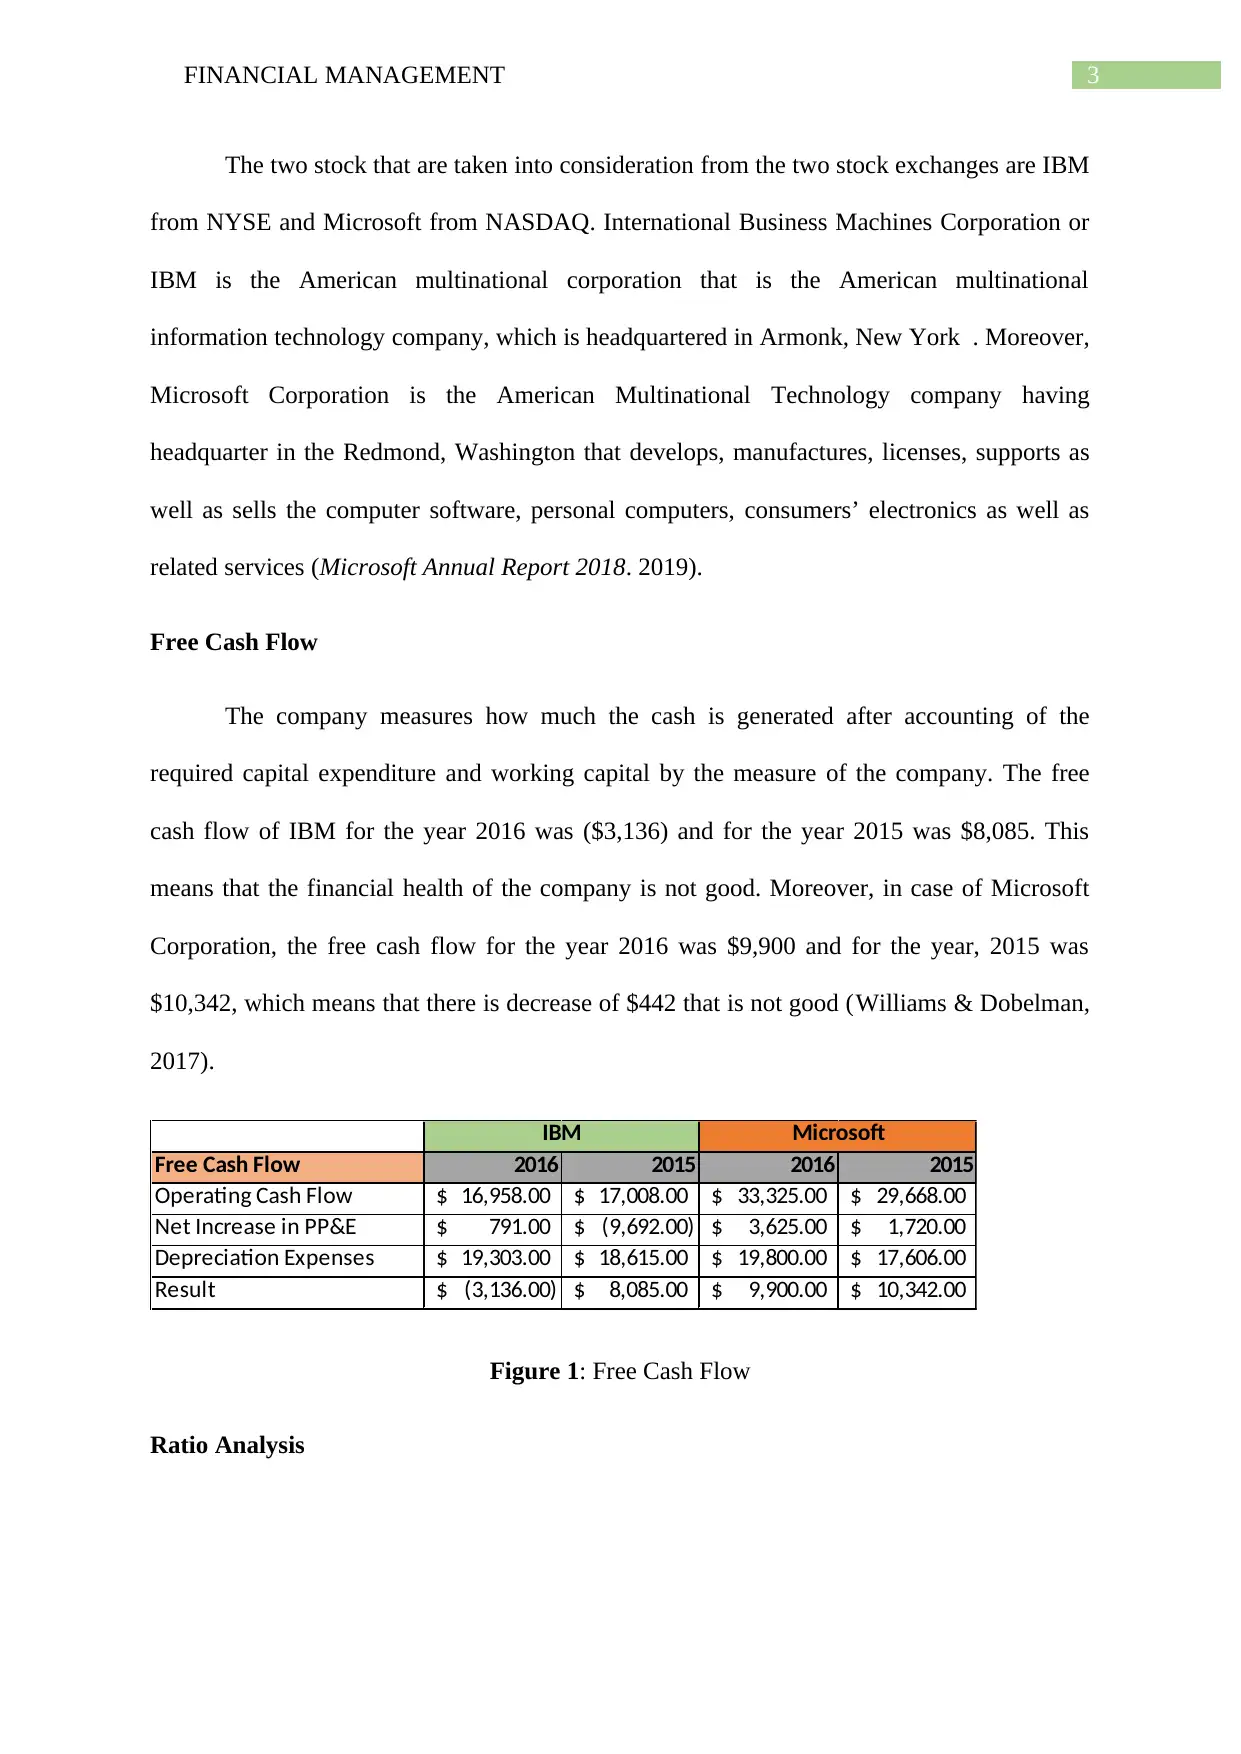
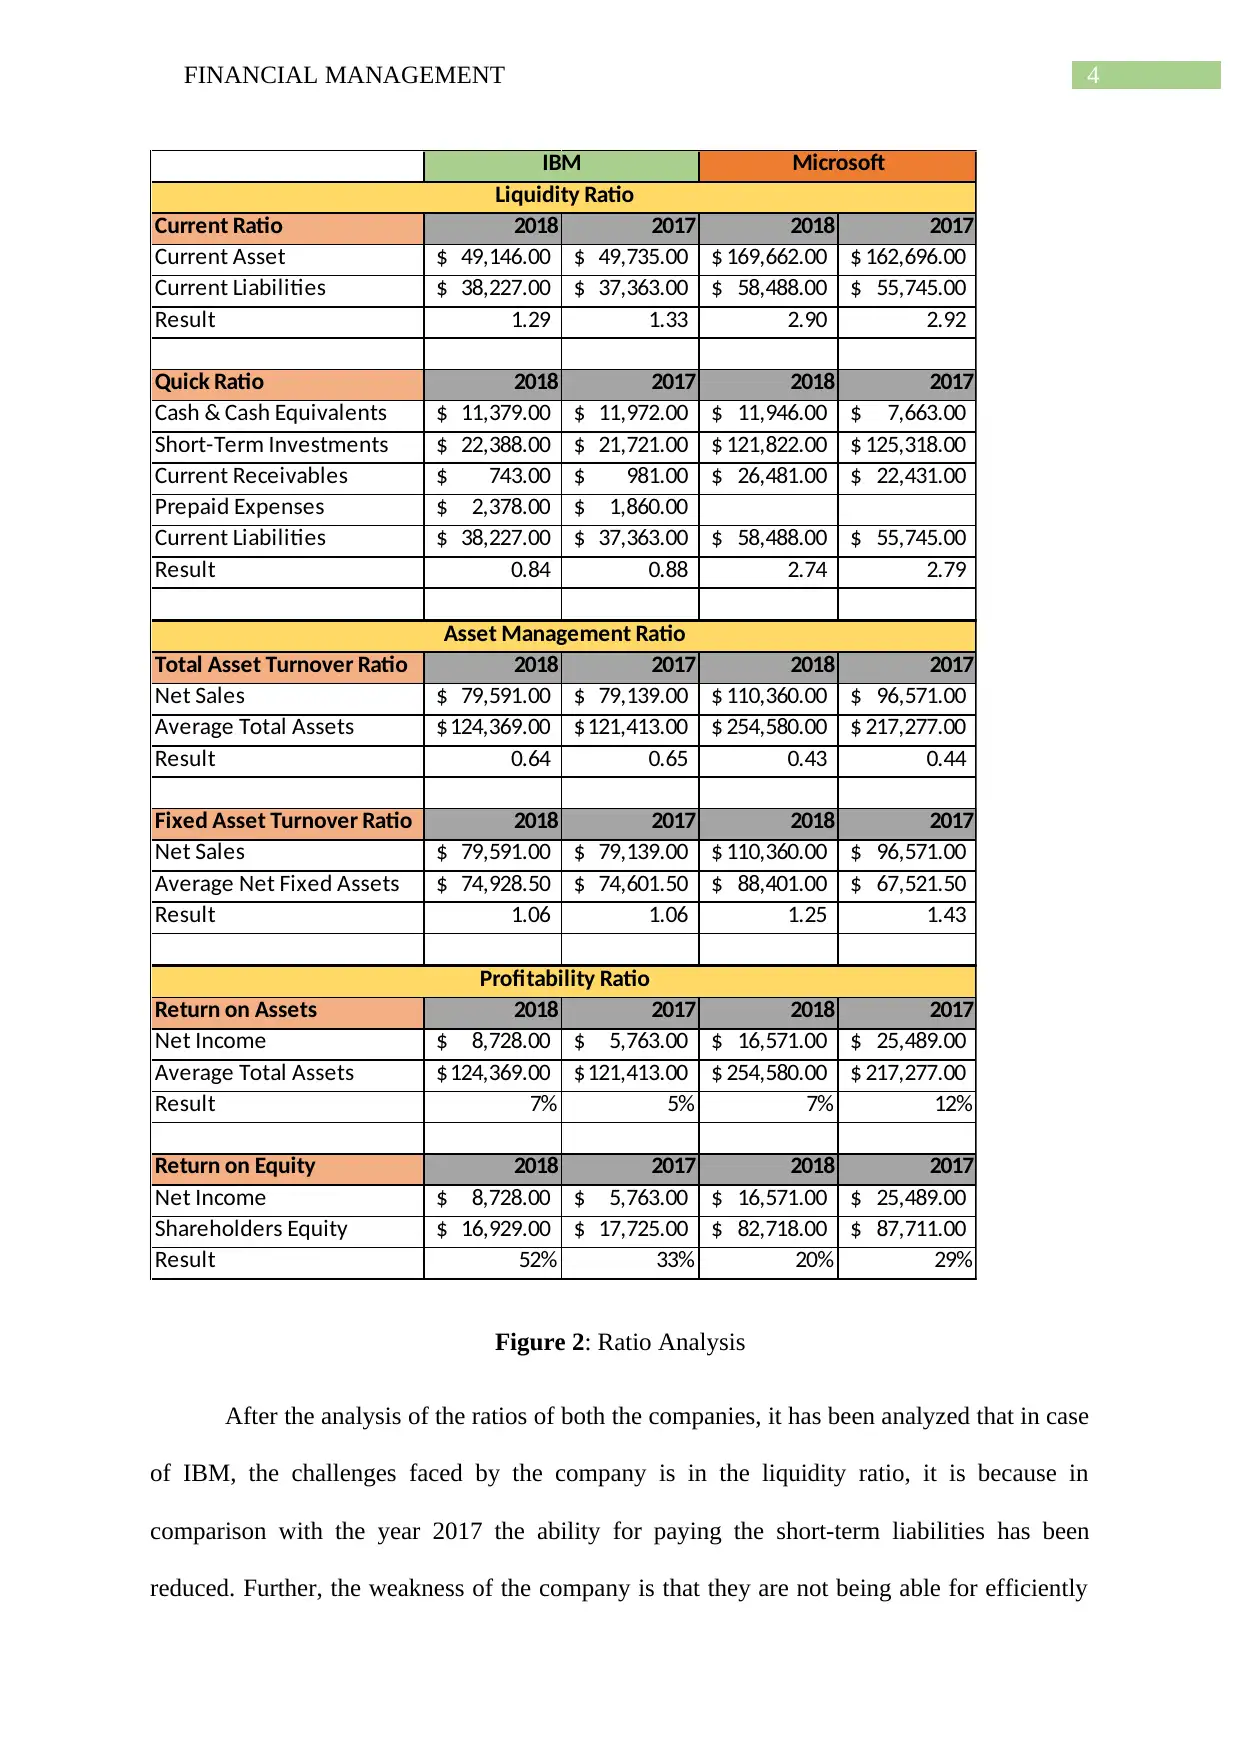
This report provides an analysis of stocks from two major U.S. stock exchanges, the NYSE and NASDAQ. It focuses on comparing and contrasting the performance of IBM (NYSE) and Microsoft (NASDAQ), two prominent companies. The report examines key financial metrics, including free cash flow for both companies, and conducts a ratio analysis to assess their financial health. The analysis covers liquidity, asset management, and profitability ratios, highlighting strengths and weaknesses of each company. The findings reveal challenges in liquidity for IBM and profitability for Microsoft, while also identifying strengths in Microsoft's liquidity and IBM's profitability. The report utilizes financial statements and annual reports to support its analysis, offering insights into the operational and market differences between the two stock exchanges. The report concludes by summarizing the financial performance and key ratios to offer a comparative perspective.
Document Page
Running Head: FINANCIAL MANAGEMENT
FINANCIAL MANAGEMENT
Name of the Student
Name of the University
Author Note
tabler-icon-diamond-filled.svg

Paraphrase This Document

Need a fresh take? Get an instant paraphrase of this document with our AI Paraphraser
Document Page
1FINANCIAL MANAGEMENT
Table of Contents
Analysis of Stocks of Two Different Stock Exchanges.............................................................2
Reference....................................................................................................................................6
Document Page
2FINANCIAL MANAGEMENT
Analysis of Stocks of Two Different Stock Exchanges
Two Stock Exchanges in United States
The two stock exchanges that are taken into consideration for the analysis are NYSE
and NASDAQ. The full form of NYSE is New York Stock Exchange, which is the American
stock exchange situated in New York. It is among the largest stock exchange of the world by
the market capitalization of the listed companies. Moreover, NASDAQ is known as National
Association for Securities Dealers Automated Quotations, which is the American Stock
Exchange. In terms of market capitalization, it is among the second largest stock exchange
around the world.
Similarities and Differences between NYSE and NASDAQ
The similarities between NYSE and NASDAQ are that both of them are public
entities. Another similarity is the utilization of traffic controllers for troubleshoots the
particular traffic problems and ensuring of the smooth as well as orderly markets for their
clients. Lastly, both of them trade on themselves in case they cannot found out the buyers or
the sellers and they are required for following the regulations set out by the Securities and
Exchange Commission (Ibm.com. 2019).
The major differences between NYSE and NASDAQ are on their markets. NYSE is
the auction market that enables the individuals for transacting between each other based on
auction whereas NASDAQ is the market of dealer with the participants trading through the
dealer in comparison with trading directly with each other. Moreover, the most obvious
differences in their sizes as well as types of the listings. Both of the stock exchanges have
significant operational differences (Microsoft Annual Report 2018. 2019).
Stocks of the Stock Exchanges
Document Page
3FINANCIAL MANAGEMENT
The two stock that are taken into consideration from the two stock exchanges are IBM
from NYSE and Microsoft from NASDAQ. International Business Machines Corporation or
IBM is the American multinational corporation that is the American multinational
information technology company, which is headquartered in Armonk, New York . Moreover,
Microsoft Corporation is the American Multinational Technology company having
headquarter in the Redmond, Washington that develops, manufactures, licenses, supports as
well as sells the computer software, personal computers, consumers’ electronics as well as
related services (Microsoft Annual Report 2018. 2019).
Free Cash Flow
The company measures how much the cash is generated after accounting of the
required capital expenditure and working capital by the measure of the company. The free
cash flow of IBM for the year 2016 was ($3,136) and for the year 2015 was $8,085. This
means that the financial health of the company is not good. Moreover, in case of Microsoft
Corporation, the free cash flow for the year 2016 was $9,900 and for the year, 2015 was
$10,342, which means that there is decrease of $442 that is not good (Williams & Dobelman,
2017).
Free Cash Flow 2016 2015 2016 2015
Operating Cash Flow 16,958.00$ 17,008.00$ 33,325.00$ 29,668.00$
Net Increase in PP&E 791.00$ (9,692.00)$ 3,625.00$ 1,720.00$
Depreciation Expenses 19,303.00$ 18,615.00$ 19,800.00$ 17,606.00$
Result (3,136.00)$ 8,085.00$ 9,900.00$ 10,342.00$
IBM Microsoft
Figure 1: Free Cash Flow
Ratio Analysis
tabler-icon-diamond-filled.svg

Paraphrase This Document

Need a fresh take? Get an instant paraphrase of this document with our AI Paraphraser
Document Page
4FINANCIAL MANAGEMENT
Current Ratio 2018 2017 2018 2017
Current Asset 49,146.00$ 49,735.00$ 169,662.00$ 162,696.00$
Current Liabilities 38,227.00$ 37,363.00$ 58,488.00$ 55,745.00$
Result 1.29 1.33 2.90 2.92
Quick Ratio 2018 2017 2018 2017
Cash & Cash Equivalents 11,379.00$ 11,972.00$ 11,946.00$ 7,663.00$
Short-Term Investments 22,388.00$ 21,721.00$ 121,822.00$ 125,318.00$
Current Receivables 743.00$ 981.00$ 26,481.00$ 22,431.00$
Prepaid Expenses 2,378.00$ 1,860.00$
Current Liabilities 38,227.00$ 37,363.00$ 58,488.00$ 55,745.00$
Result 0.84 0.88 2.74 2.79
Total Asset Turnover Ratio 2018 2017 2018 2017
Net Sales 79,591.00$ 79,139.00$ 110,360.00$ 96,571.00$
Average Total Assets 124,369.00$ 121,413.00$ 254,580.00$ 217,277.00$
Result 0.64 0.65 0.43 0.44
Fixed Asset Turnover Ratio 2018 2017 2018 2017
Net Sales 79,591.00$ 79,139.00$ 110,360.00$ 96,571.00$
Average Net Fixed Assets 74,928.50$ 74,601.50$ 88,401.00$ 67,521.50$
Result 1.06 1.06 1.25 1.43
Return on Assets 2018 2017 2018 2017
Net Income 8,728.00$ 5,763.00$ 16,571.00$ 25,489.00$
Average Total Assets 124,369.00$ 121,413.00$ 254,580.00$ 217,277.00$
Result 7% 5% 7% 12%
Return on Equity 2018 2017 2018 2017
Net Income 8,728.00$ 5,763.00$ 16,571.00$ 25,489.00$
Shareholders Equity 16,929.00$ 17,725.00$ 82,718.00$ 87,711.00$
Result 52% 33% 20% 29%
Asset Management Ratio
Profitability Ratio
Liquidity Ratio
IBM Microsoft
Figure 2: Ratio Analysis
After the analysis of the ratios of both the companies, it has been analyzed that in case
of IBM, the challenges faced by the company is in the liquidity ratio, it is because in
comparison with the year 2017 the ability for paying the short-term liabilities has been
reduced. Further, the weakness of the company is that they are not being able for efficiently
Document Page
5FINANCIAL MANAGEMENT
utilize their assets for generating enough turnover. Lastly, the strength is the profitability of
the company as the company is being able to generate income by utilizing their total assets
and equity. Moreover, in case of Microsoft Corporation, the challenge that is faced by the
company is in their profitability, it is because the reduction of profitability ratio from the year
2017-2018 that has to be improved. Further, the company has the strength of their liquidity
position, which is in very good position for paying their short-term liabilities. Lastly, the
weakness is the position of asset management ratio, which means the non-ability of the
company for generating turnover from assets (Chen, Sun & Xu, 2016).
Document Page
6FINANCIAL MANAGEMENT
Reference
Chen, X., Sun, Y., & Xu, X. (2016). Free cash flow, over-investment and corporate
governance in China. Pacific-Basin Finance Journal, 37, 81-103.
Ibm.com. (2019). Retrieved 14 July 2019, from
https://www.ibm.com/annualreport/assets/downloads/IBM_Annual_Report_2018.pdf
Microsoft Annual Report 2018. (2019). Microsoft.com. Retrieved 14 July 2019, from
https://www.microsoft.com/en-us/annualreports/ar2018/annualreport
Williams, E. E., & Dobelman, J. A. (2017). Financial statement analysis. World Scientific
Book Chapters, 109-169.
chevron_up_icon
1 out of 7
circle_padding
hide_on_mobile
zoom_out_icon
[object Object]