STT100 Statistics Report: Obesity Rates and BMI Analysis of Countries
VerifiedAdded on 2022/08/30
|10
|1868
|18
Report
AI Summary
This report examines the global obesity problem by analyzing Body Mass Index (BMI) data from various countries. The study begins with descriptive statistics, calculating the mean, standard deviation, and mode of BMI values across 190 countries. Following this, hypothesis testing is conducted to determine if the USA's average BMI differs significantly from the global average. The statistical conclusion rejects the null hypothesis, indicating that the USA's BMI is higher than the average. The report delves into the consequences and effects of obesity in the USA, including its links to various chronic diseases and the associated economic costs. The analysis highlights the government and community policies needed to correct obesity, such as promoting healthy food choices and encouraging physical activity. The report also offers additional recommendations, like breastfeeding, to prevent obesity. It concludes by emphasizing the urgent need for intervention to address the rising obesity rates and their detrimental impact on public health and the economy.
Running header: Obesity 1
The Obesity Rate of People in Different Countries, using list of countries by Body Mass
Index
Name:
Institution:
The Obesity Rate of People in Different Countries, using list of countries by Body Mass
Index
Name:
Institution:
Paraphrase This Document
Need a fresh take? Get an instant paraphrase of this document with our AI Paraphraser
Obesity 2
Table of Contents
Introduction..........................................................................................................................3
STEP 1: Descriptive Statistics.............................................................................................3
STEP 2: Hypothesis Testing................................................................................................4
STEP 3: Statistical Conclusion............................................................................................4
STEP 4: Analytical Conclusion...........................................................................................5
WHY USA.......................................................................................................................5
Consequences and Effects of Obesity to USA................................................................6
Government and Community Policies to Correct Obesity in US....................................7
Other Recommendations.................................................................................................9
References..........................................................................................................................10
Obesity 3
Introduction
There are no doubts one of the challenges facing the healthcare sector is obesity, which is
the abnormal accumulation of fats which present a risk to an individual’s health. Notably, the
body mass index (BMI) is the essential crude population measure of obesity that utilizes an
individual’s weight and height. There are four ranges of BMI, which include below 18.5
(underweight), 18.5 – 24.9 (healthy weight), 25 – 29.9 (overweight), and 30 – 39.9 (obese)
(Hales, Carroll, Fryar, & Ogden, 2017). Therefore, the following study seeks to exhibit the
average BMI of the 190 countries. Consequently, the study will evaluate if USA is within the
limits of world BMI.
STEP 1: Descriptive Statistics
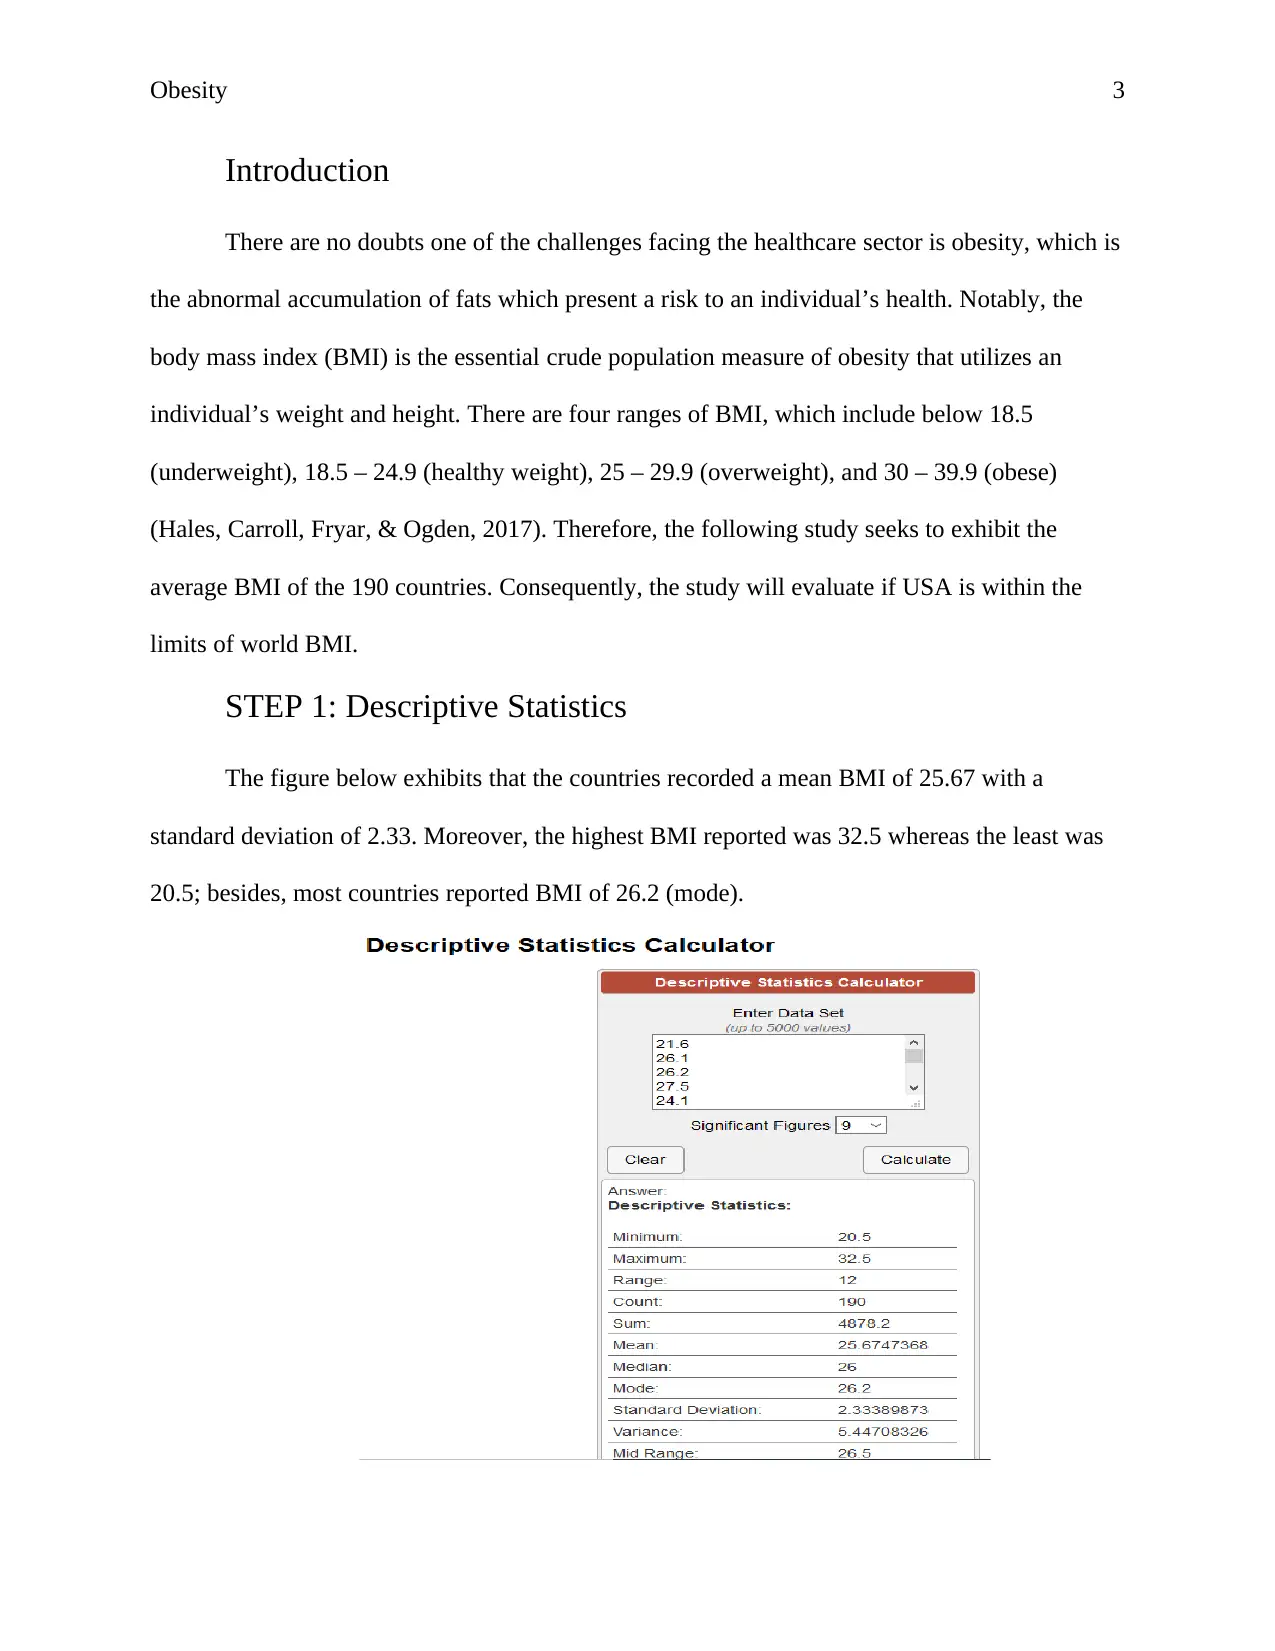
The figure below exhibits that the countries recorded a mean BMI of 25.67 with a
standard deviation of 2.33. Moreover, the highest BMI reported was 32.5 whereas the least was
20.5; besides, most countries reported BMI of 26.2 (mode).
Introduction
There are no doubts one of the challenges facing the healthcare sector is obesity, which is
the abnormal accumulation of fats which present a risk to an individual’s health. Notably, the
body mass index (BMI) is the essential crude population measure of obesity that utilizes an
individual’s weight and height. There are four ranges of BMI, which include below 18.5
(underweight), 18.5 – 24.9 (healthy weight), 25 – 29.9 (overweight), and 30 – 39.9 (obese)
(Hales, Carroll, Fryar, & Ogden, 2017). Therefore, the following study seeks to exhibit the
average BMI of the 190 countries. Consequently, the study will evaluate if USA is within the
limits of world BMI.
STEP 1: Descriptive Statistics
The figure below exhibits that the countries recorded a mean BMI of 25.67 with a
standard deviation of 2.33. Moreover, the highest BMI reported was 32.5 whereas the least was
20.5; besides, most countries reported BMI of 26.2 (mode).
⊘ This is a preview!⊘
Do you want full access?
Subscribe today to unlock all pages.
Trusted by 1+ million students worldwide
Obesity 4
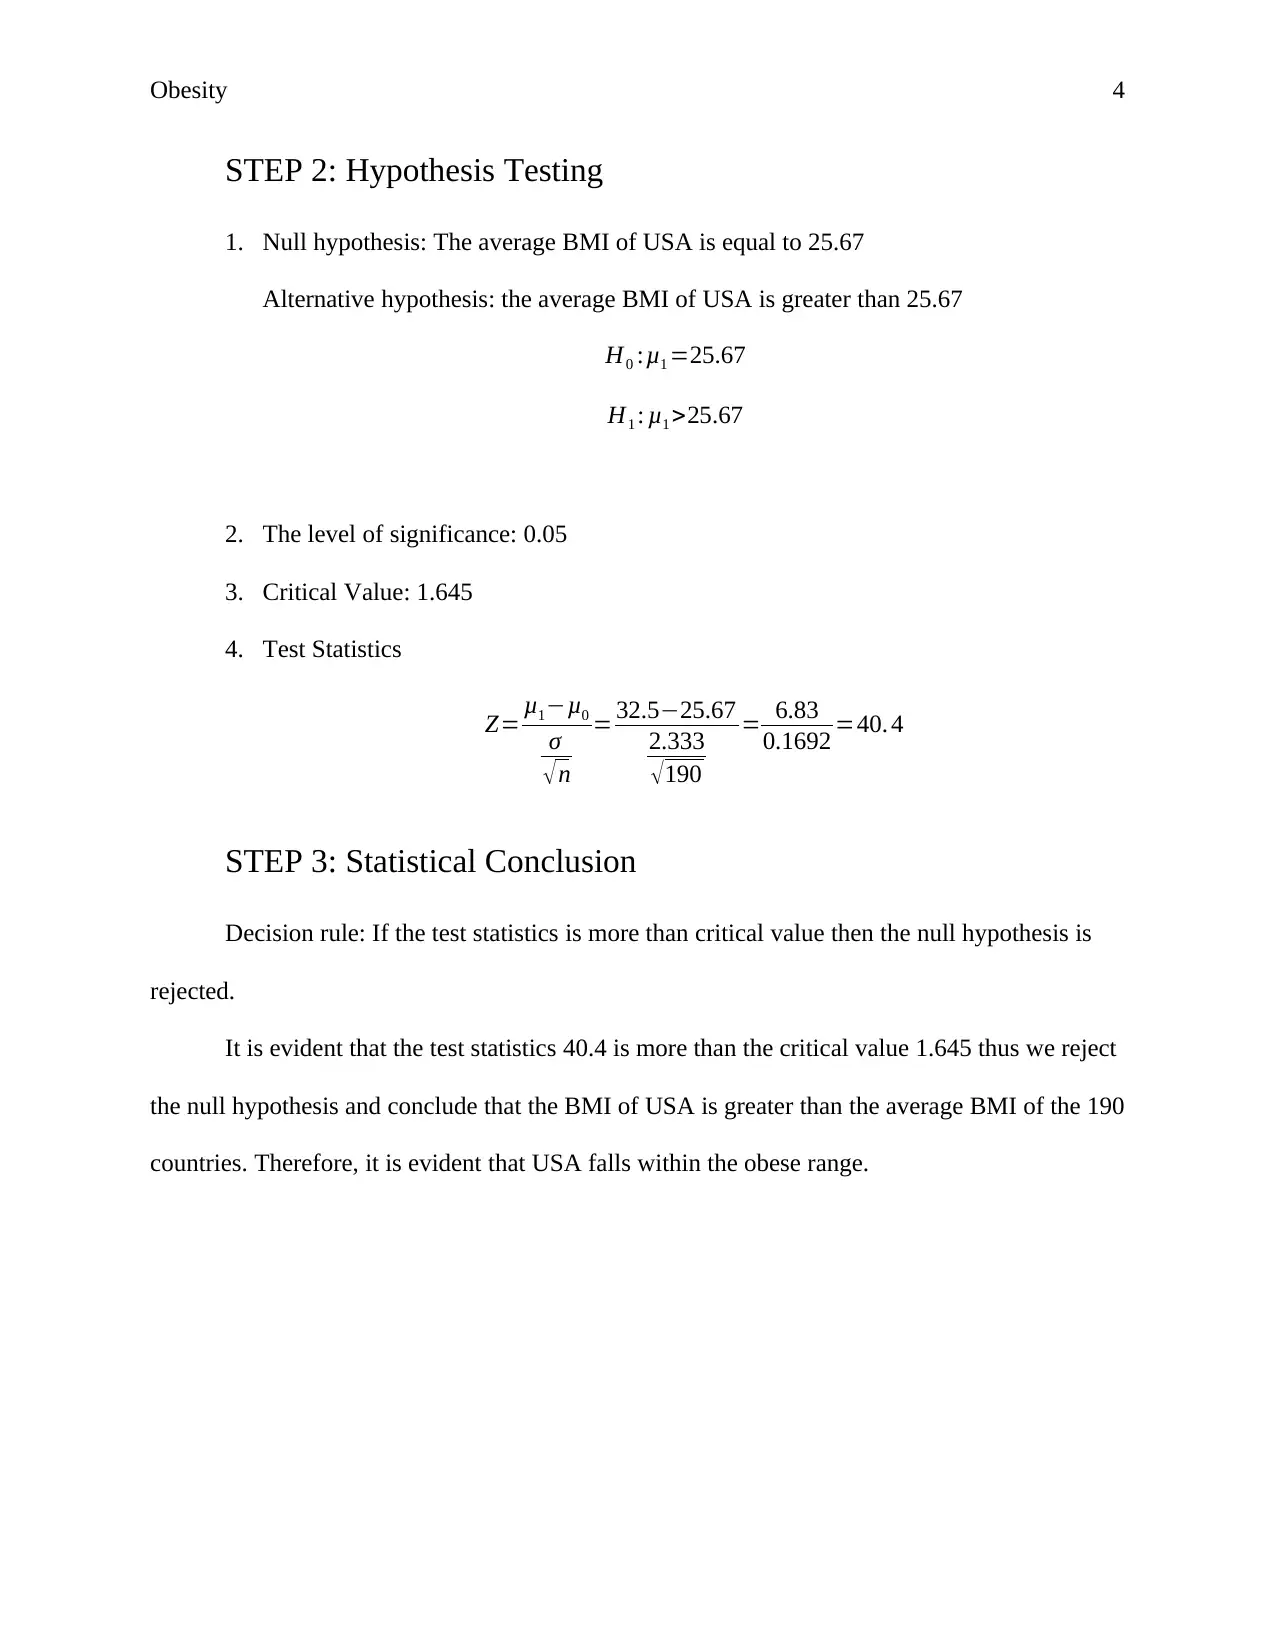
STEP 2: Hypothesis Testing
1. Null hypothesis: The average BMI of USA is equal to 25.67
Alternative hypothesis: the average BMI of USA is greater than 25.67
H0 :μ1 =25.67
H1 : μ1 >25.67
2. The level of significance: 0.05
3. Critical Value: 1.645
4. Test Statistics
Z= μ1−μ0
σ
√n
= 32.5−25.67
2.333
√190
= 6.83
0.1692 =40. 4
STEP 3: Statistical Conclusion
Decision rule: If the test statistics is more than critical value then the null hypothesis is
rejected.
It is evident that the test statistics 40.4 is more than the critical value 1.645 thus we reject
the null hypothesis and conclude that the BMI of USA is greater than the average BMI of the 190
countries. Therefore, it is evident that USA falls within the obese range.
Paraphrase This Document
Need a fresh take? Get an instant paraphrase of this document with our AI Paraphraser
Obesity 5
STEP 4: Analytical Conclusion
WHY USA
Obesity has continued to be a serious health challenge in the USA thus contributing to
various diseases, which include diabetes, heart disease, joint disorders, and some form of cancers
(Park, 2019). A report by Devitt, (2018) exhibits that nationally 18.5% and 39.6% of children
and adults respectively in the US were considered obese between 2015 and 2016. However, the
adult obesity tends to differ varied from one geographical region to another, whereby states in
the north east and west recorded lower overall obesity rates compared to those in the South and
the Midwest. Consequently, the report shows that in a span of 2 years (2016 – 2017) the adult
obesity prevalence significantly increased in six states, which include Rhode Island, South
Carolina, Ohio, Massachusetts, Oklahoma, and Iowa. Besides, seven states (Mississippi,
Oklahoma, West Virginia, Alabama, Iowa, Louisiana, and Arkansas) recorded an adult obesity
rates of 35% or higher, with West Virginia recording the highest rate at 38.1%. Moreover, more
than a quarter of the US states self-recorded adult obesity rate of more than 35%.
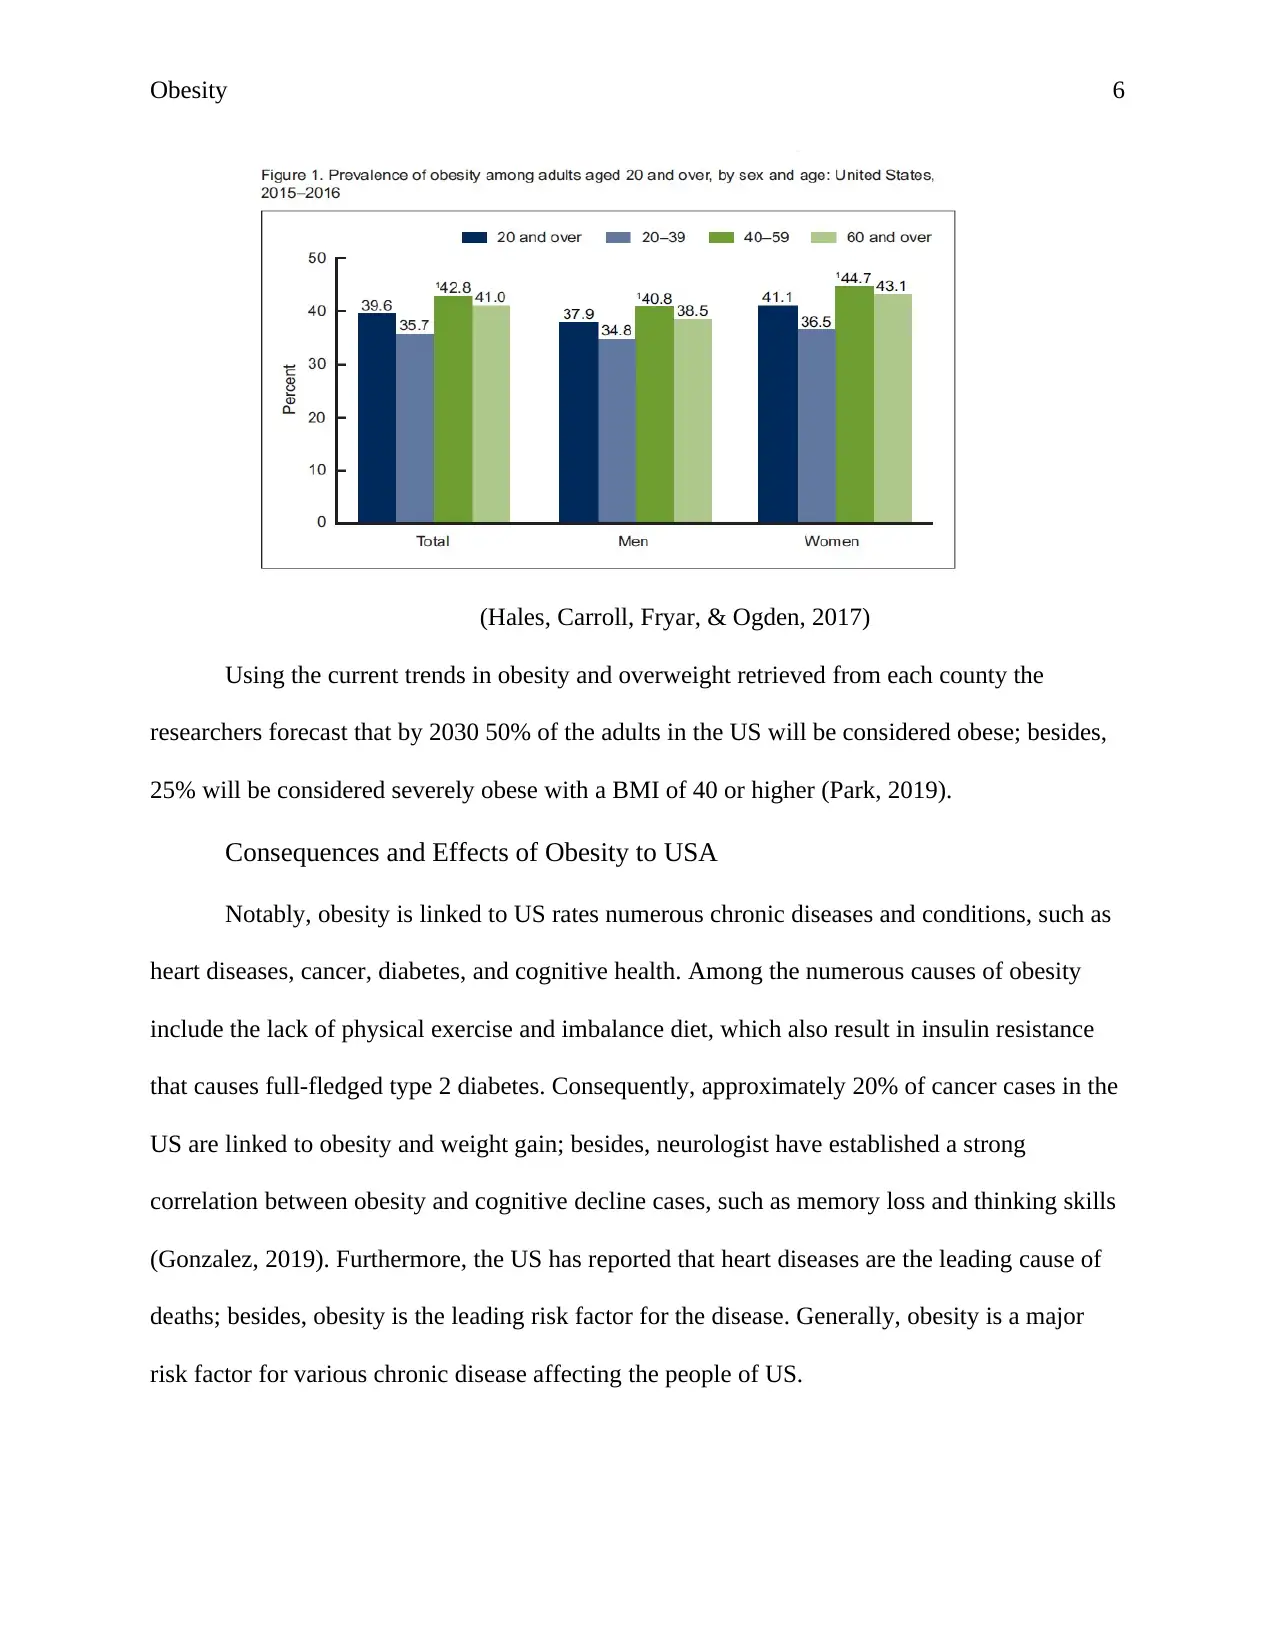
The chart below shows that in the year 2015 the US adults reported a total prevalence of
39.8%, whereby adults aged 40-59 years reported total prevalence of 42.8% whereas adults aged
20-39 recorded a prevalence of 35.7%. Consequently, the graph shows that women recorded a
higher prevalence in all age groups, with women aged 40-59 recording the highest prevalence at
44.7% (Hales, Carroll, Fryar, & Ogden, 2017).
STEP 4: Analytical Conclusion
WHY USA
Obesity has continued to be a serious health challenge in the USA thus contributing to
various diseases, which include diabetes, heart disease, joint disorders, and some form of cancers
(Park, 2019). A report by Devitt, (2018) exhibits that nationally 18.5% and 39.6% of children
and adults respectively in the US were considered obese between 2015 and 2016. However, the
adult obesity tends to differ varied from one geographical region to another, whereby states in
the north east and west recorded lower overall obesity rates compared to those in the South and
the Midwest. Consequently, the report shows that in a span of 2 years (2016 – 2017) the adult
obesity prevalence significantly increased in six states, which include Rhode Island, South
Carolina, Ohio, Massachusetts, Oklahoma, and Iowa. Besides, seven states (Mississippi,
Oklahoma, West Virginia, Alabama, Iowa, Louisiana, and Arkansas) recorded an adult obesity
rates of 35% or higher, with West Virginia recording the highest rate at 38.1%. Moreover, more
than a quarter of the US states self-recorded adult obesity rate of more than 35%.
The chart below shows that in the year 2015 the US adults reported a total prevalence of
39.8%, whereby adults aged 40-59 years reported total prevalence of 42.8% whereas adults aged
20-39 recorded a prevalence of 35.7%. Consequently, the graph shows that women recorded a
higher prevalence in all age groups, with women aged 40-59 recording the highest prevalence at
44.7% (Hales, Carroll, Fryar, & Ogden, 2017).
Obesity 6
(Hales, Carroll, Fryar, & Ogden, 2017)
Using the current trends in obesity and overweight retrieved from each county the
researchers forecast that by 2030 50% of the adults in the US will be considered obese; besides,
25% will be considered severely obese with a BMI of 40 or higher (Park, 2019).
Consequences and Effects of Obesity to USA
Notably, obesity is linked to US rates numerous chronic diseases and conditions, such as
heart diseases, cancer, diabetes, and cognitive health. Among the numerous causes of obesity
include the lack of physical exercise and imbalance diet, which also result in insulin resistance
that causes full-fledged type 2 diabetes. Consequently, approximately 20% of cancer cases in the
US are linked to obesity and weight gain; besides, neurologist have established a strong
correlation between obesity and cognitive decline cases, such as memory loss and thinking skills
(Gonzalez, 2019). Furthermore, the US has reported that heart diseases are the leading cause of
deaths; besides, obesity is the leading risk factor for the disease. Generally, obesity is a major
risk factor for various chronic disease affecting the people of US.
⊘ This is a preview!⊘
Do you want full access?
Subscribe today to unlock all pages.
Trusted by 1+ million students worldwide
Obesity 7
As exhibited, obesity is linked to various health issues, which tend to have an adverse
economic effect on the US health care sector. There are two types of health costs, which include
the direct and indirect costs. The direct costs incorporate the services offered by healthcare
system, such as diagnostic, treatment, and preventive services whereas the indirect costs
incorporate morbidity and mortality costs, such as productivity linked to obesity (Gonzalez,
2019). Productivity incorporate both ‘absenteeism’ (costs incurred when workers fail to report to
their work station due to obesity-related issues) and ‘presenteeism’ (workers fail to perform their
duties due to reduced productivity). In 2008 the medical care cost linked to obesity in US were
approximated to be $147 billion, which increased to $210 billion by 2010. Notably, the medical
cost for people with obesity were calculated to be $1429 higher than for those of normal weight;
besides, the lifetime healthcare costs for 10-year-old child with obesity are approximately
$19,000 higher than that of a child of healthy weight. Moreover, Gonzalez, (2019) exhibits that if
the cases of obesity continue to increase the combined health care costs associated with treating
obesity-related disease could rise by $48 billion to $66 billion per year by 2030.
Consequently, obesity has negative impact on the workplace, whereby the US has
experienced decreased productivity and absenteeism, which has a huge economic burden to the
country. Absenteeism linked to obesity cost approximately $4.3 billion per annum, whereas
lower productivity costs $506 per worker each year (Gonzalez, 2019). Generally, the higher an
individual’s BMI the higher the number of sick-offs and medical claims; besides, workers with
obesity haver higher workers’ compensation claims.
Government and Community Policies to Correct Obesity in US
It is evident that US is above healthy weight range thus it essential for the government
and communities to adopt strategies to curb or correct the current status. There are numerous
Paraphrase This Document
Need a fresh take? Get an instant paraphrase of this document with our AI Paraphraser
Obesity 8
strategies the government adopt, which include promoting the availability of affordable healthy
food and beverages and support healthy food and beverage choice. Moreover, the government
should encourage physical activity among children and youth, and create safe communities that
support physical exercise. Notably, inadequate healthier food options are a challenge to healthy
eating; besides, healthier foods are generally more expensive thus posing the same challenge
(Khan, Sobush, Keener, & Goodman, 2009). Thus, to achieve affordable healthy food it is
recommendable for the government to adopt various mechanisms, such as improving the
geographical availability of grocery stores and supermarkets in underserved regions. Moreover,
the government should offer incentives to food retails, producers, and distributors of healthier
food choices in underserved regions.
Consequently, despite the availability of healthy food options people often to consume
unhealthy food promoted by print media and other forms of advertisement hence the government
should support healthy food choices through various mechanisms (Khan, Sobush, Keener, &
Goodman, 2009). For instance, the government should limit advertisement and access of the
unhealthy food to the general public. Furthermore, the government can adopt various strategies
to promote physical activity among the children and youth. For instance, the government should
ensure physical education programs are taught is schools and increase opportunities for sporting
activities. Consequently, the government should create create safe communities that embrace
physical exercise through increasing the access to outdoor recreational facilities and provide
infrastructure that promote physical activities, such as cycling and walking.
Obesity 9
Other Recommendations
Breastfeeding has a significant relationship to decreased risk of pediatric overweight.
However, many mothers fail to initiate or discontinue breastfeeding earlier than expected.
Notably, it is recommendable to mothers to breastfeed continuously of the first 6 months since it
provides a limited degree of protection against childhood obesity; besides, it promotes infant’s
ability to self-regulate energy intake thus enabling the infant to efficiently respond to internal
hunger and satiety cues (Khan, Sobush, Keener, & Goodman, 2009). Moreover, children should
be encouraged to build early relationships with healthy foods, such as fruits and vegetables.
Therefore, it is recommendable for government to encourage mothers to breastfeed children
exclusively thus aid in preventing obesity.
⊘ This is a preview!⊘
Do you want full access?
Subscribe today to unlock all pages.
Trusted by 1+ million students worldwide
Obesity 10
References
Devitt, M. (2018). U.S. Obesity Epidemic Continues to Worsen. American Academy of Family
Physicians. Retrieved from
https://www.aafp.org/news/health-of-the-public/20181015obesityrpt.html
Gonzalez, J. M. (2019, February 14). Obesity in America: A Growing Concern. Retrieved from
Endocrine Website: https://www.endocrineweb.com/conditions/obesity/obesity-america-
growing-concern
Hales, C., Carroll, M., Fryar, C., & Ogden, C. (2017). Prevalence of Obesity Among Adults and
Youth: United States, 2015–2016. NCHS.
Khan, L. K., Sobush, K., Keener, D., & Goodman, K. (2009). Recommended Community
Strategies and Measurements to Prevent Obesity in the United States. Atlanta: Centers
for Disease Control and Prevention.
Park, A. (2019, December 18). Half of the U.S. Population Will Be Obese by 2030. Retrieved
from TIME: https://time.com/5751551/us-obesity-by-state/
1 out of 10

Your All-in-One AI-Powered Toolkit for Academic Success.
+13062052269
info@desklib.com
Available 24*7 on WhatsApp / Email
![[object Object]](/_next/static/media/star-bottom.7253800d.svg)
Unlock your academic potential
Copyright © 2020–2026 A2Z Services. All Rights Reserved. Developed and managed by ZUCOL.