Object and Data Modelling Report: Storyboards and Drill-Down Analysis
VerifiedAdded on 2022/11/17
|11
|1655
|105
Report
AI Summary
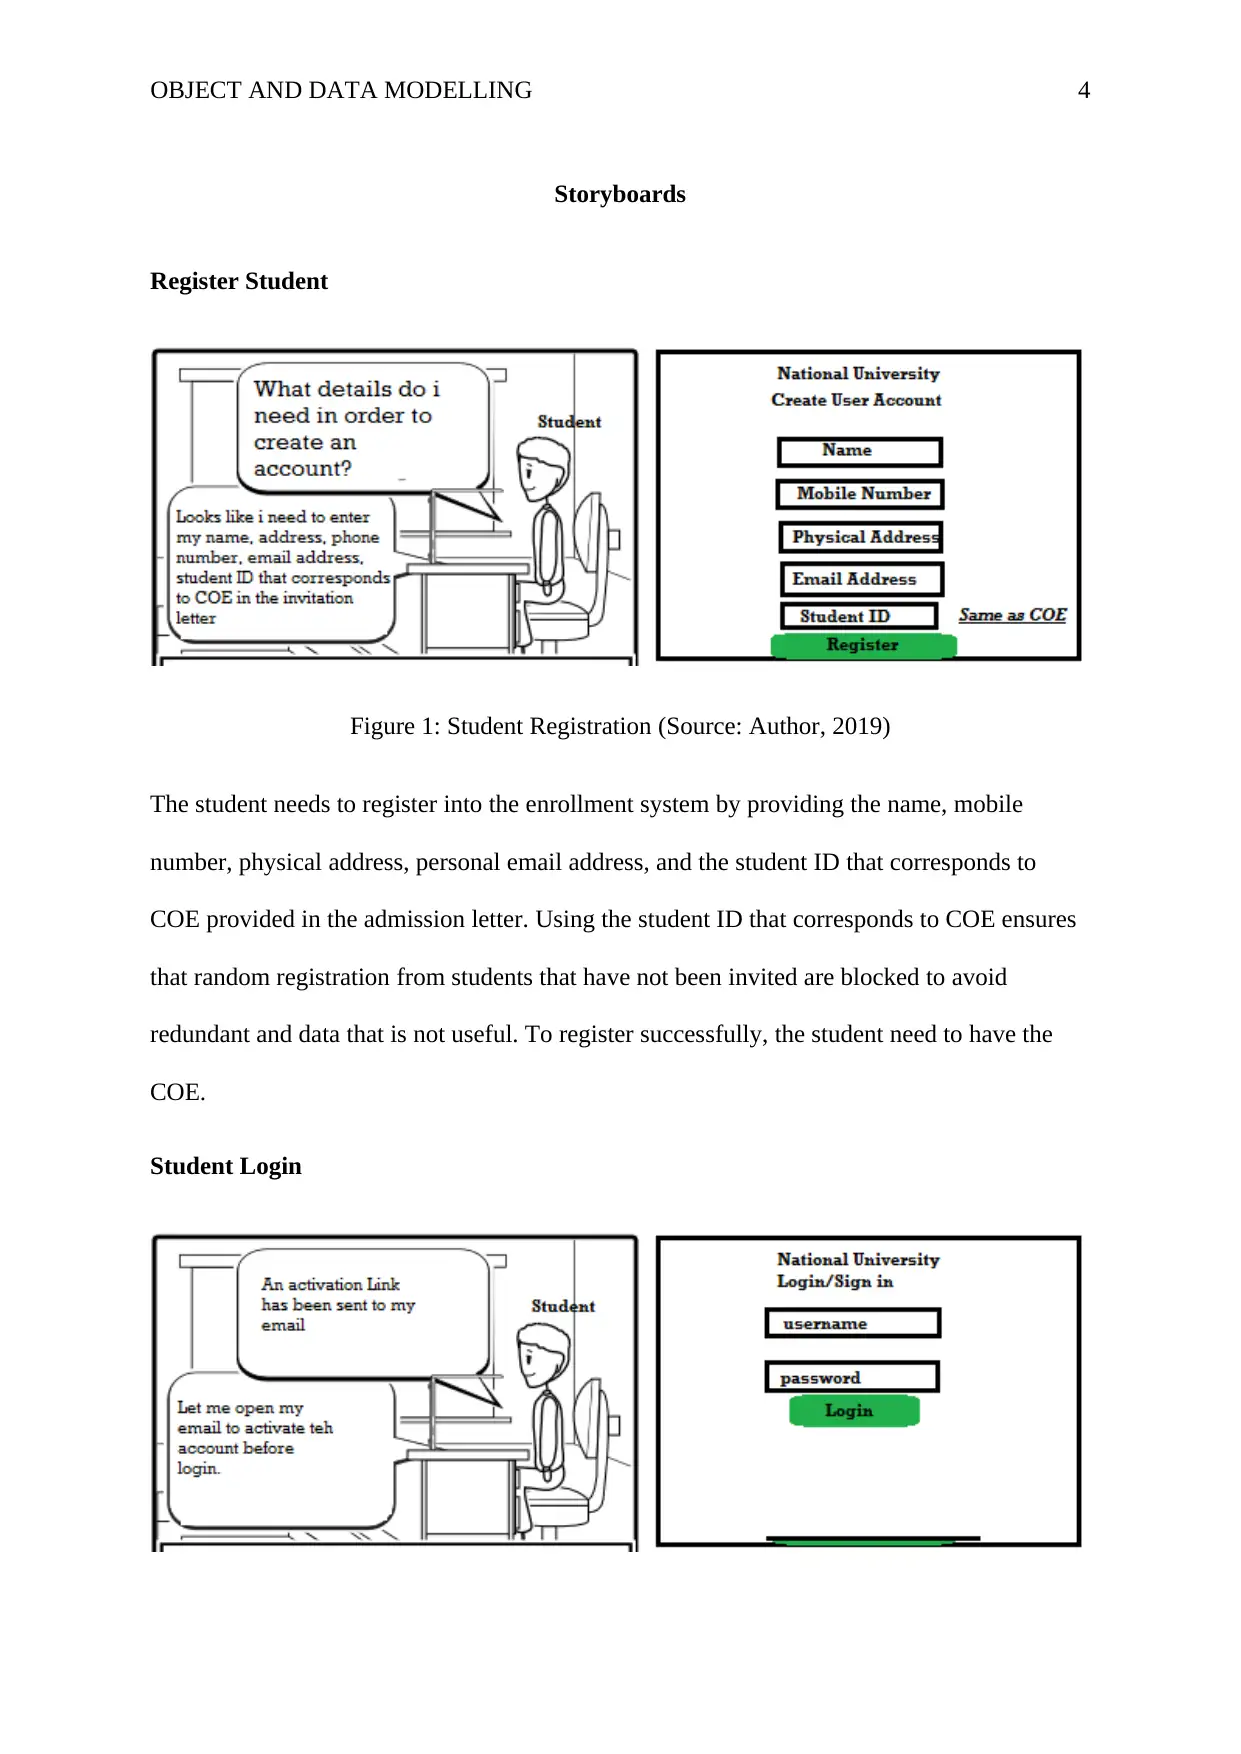
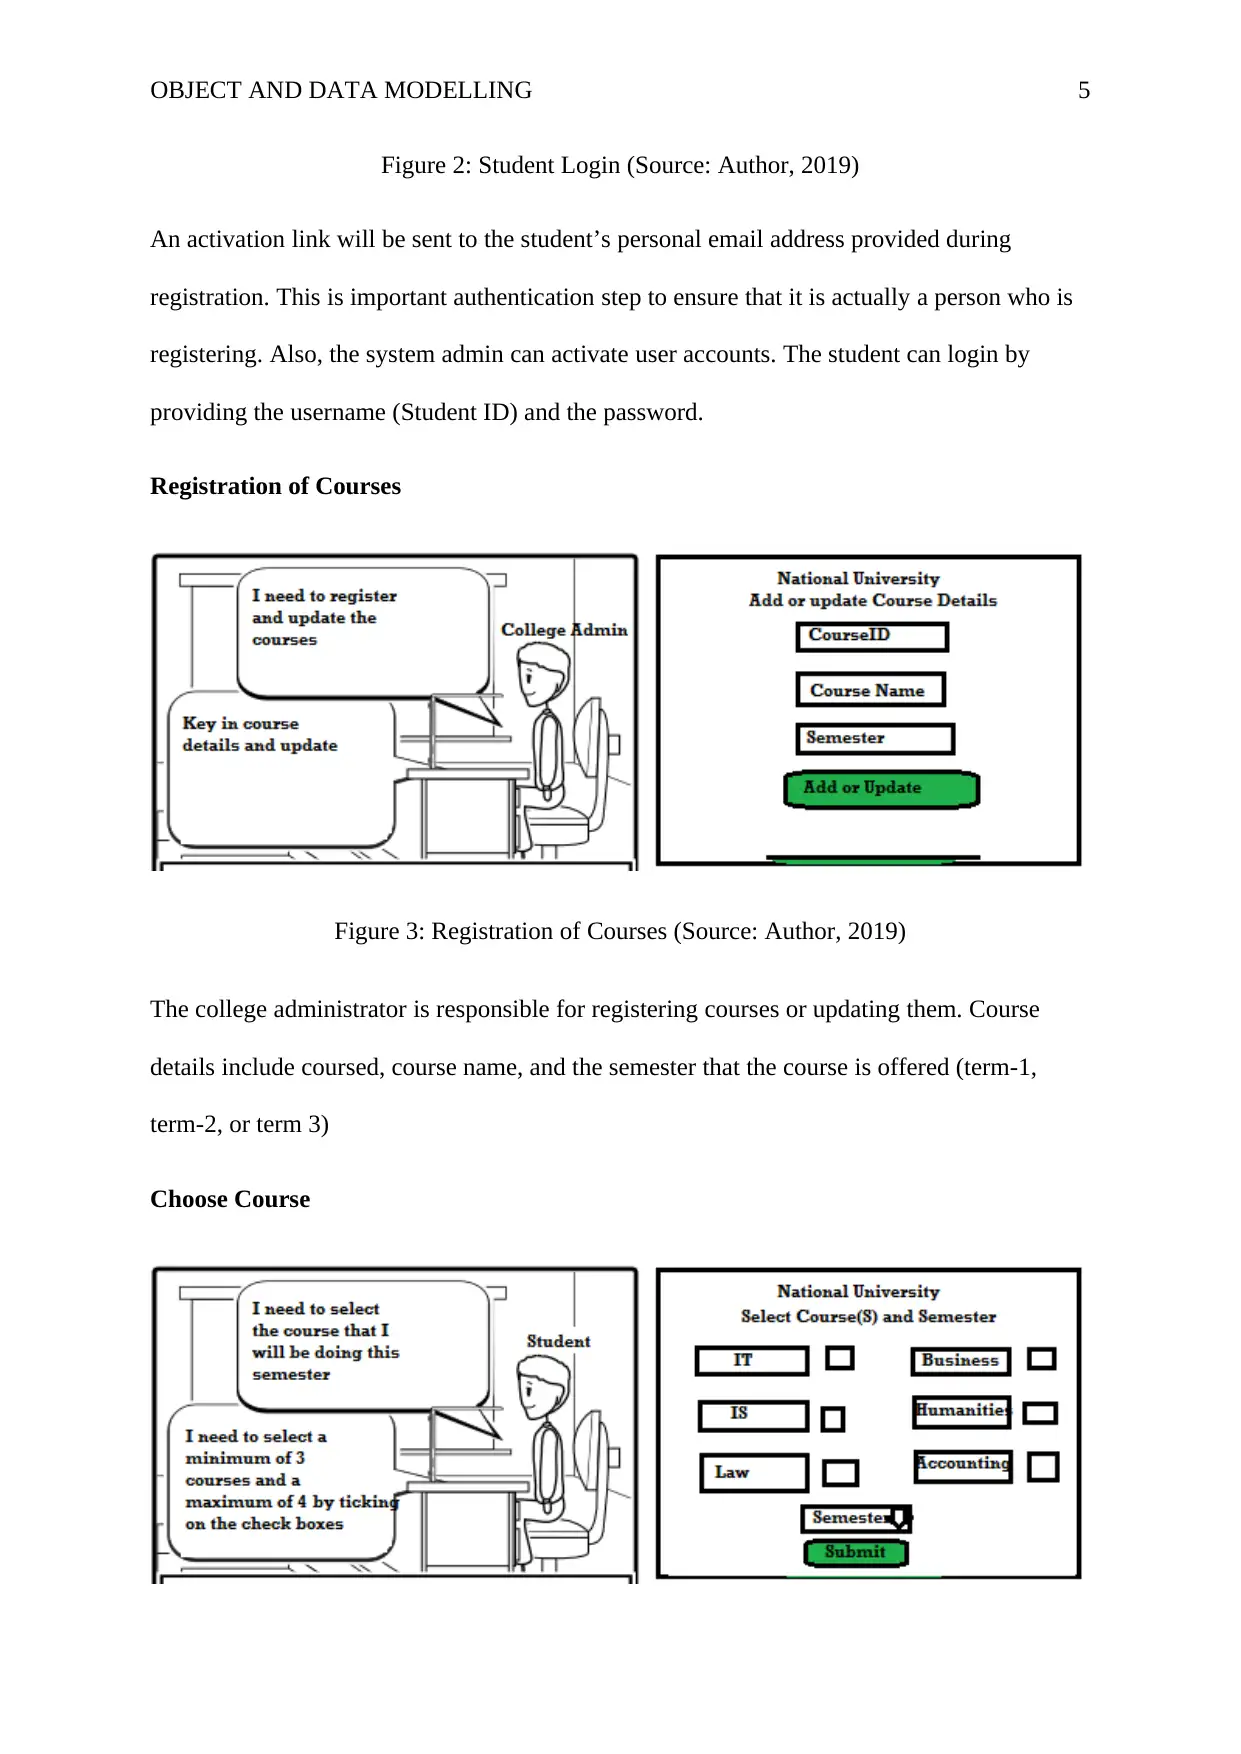
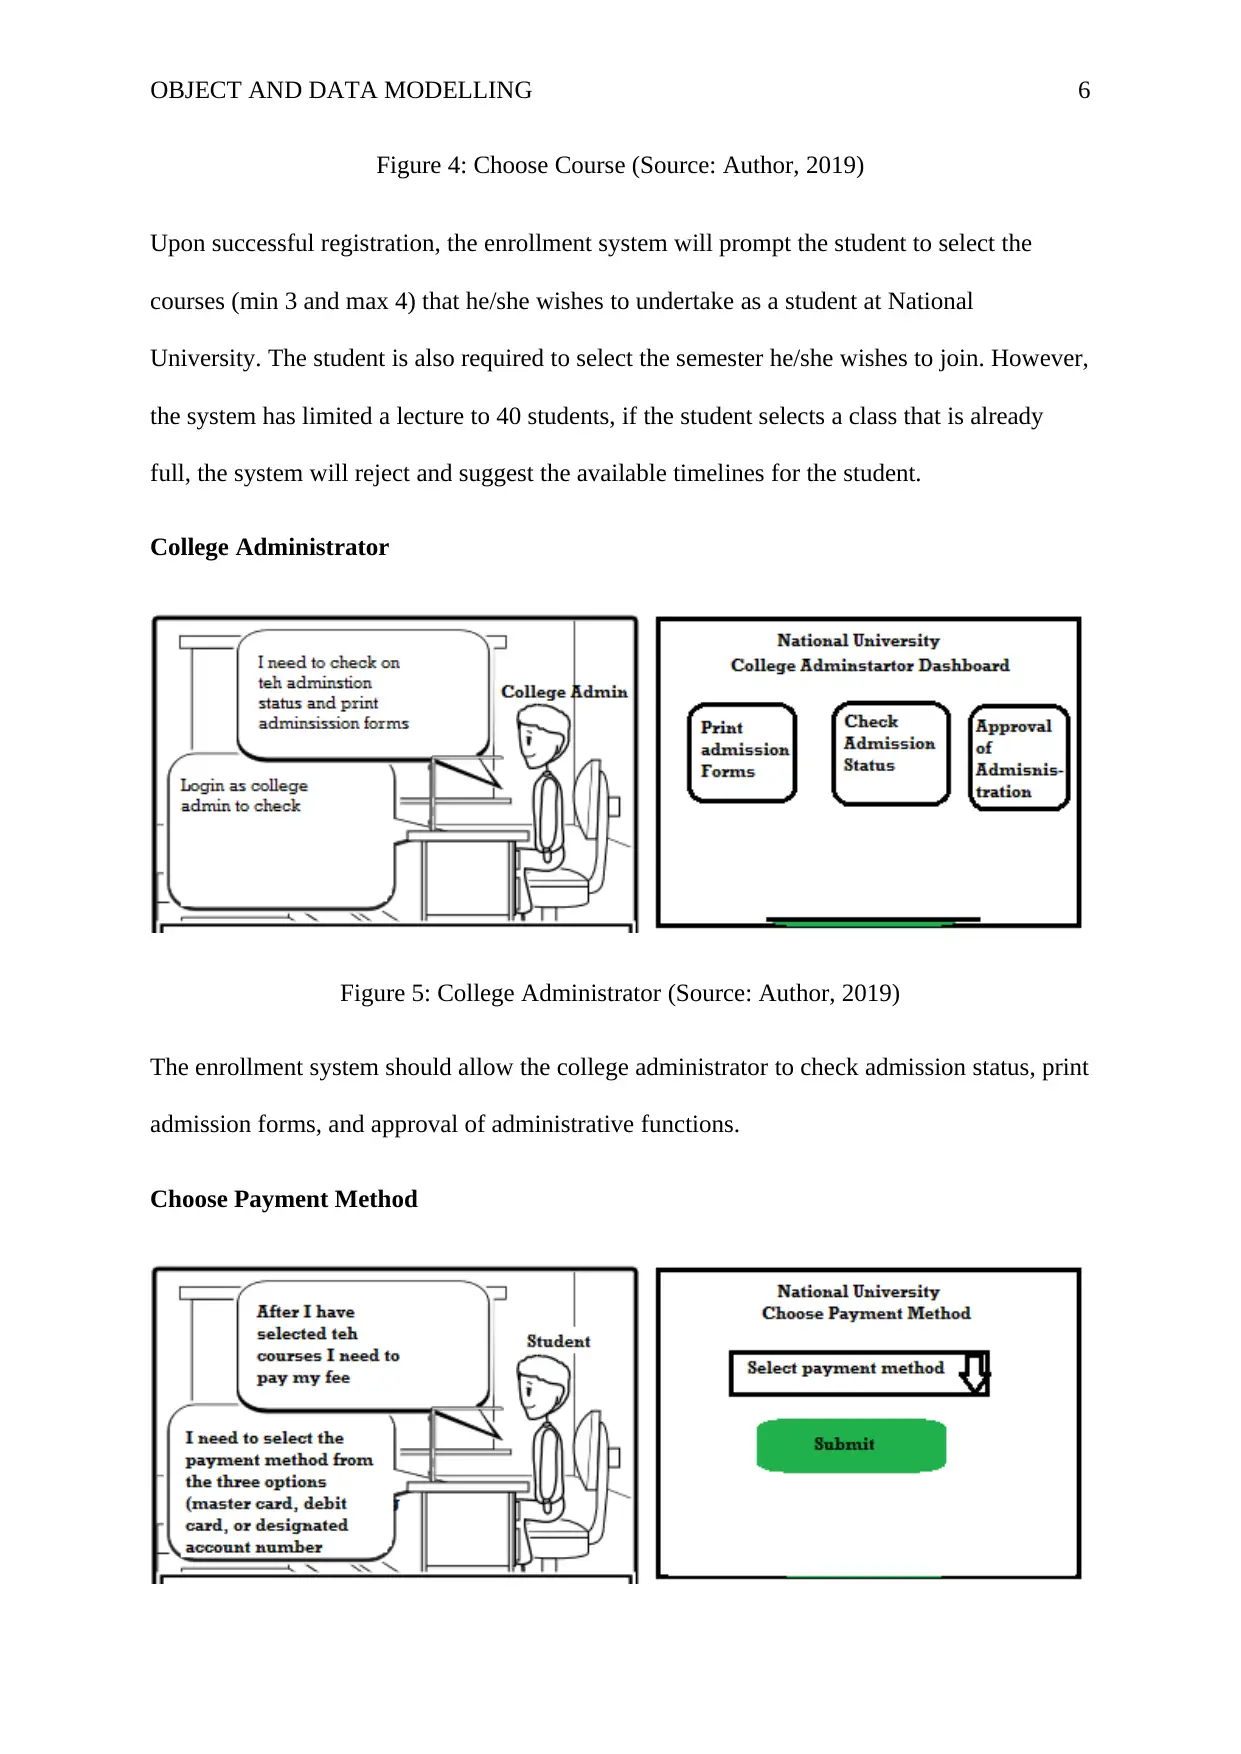
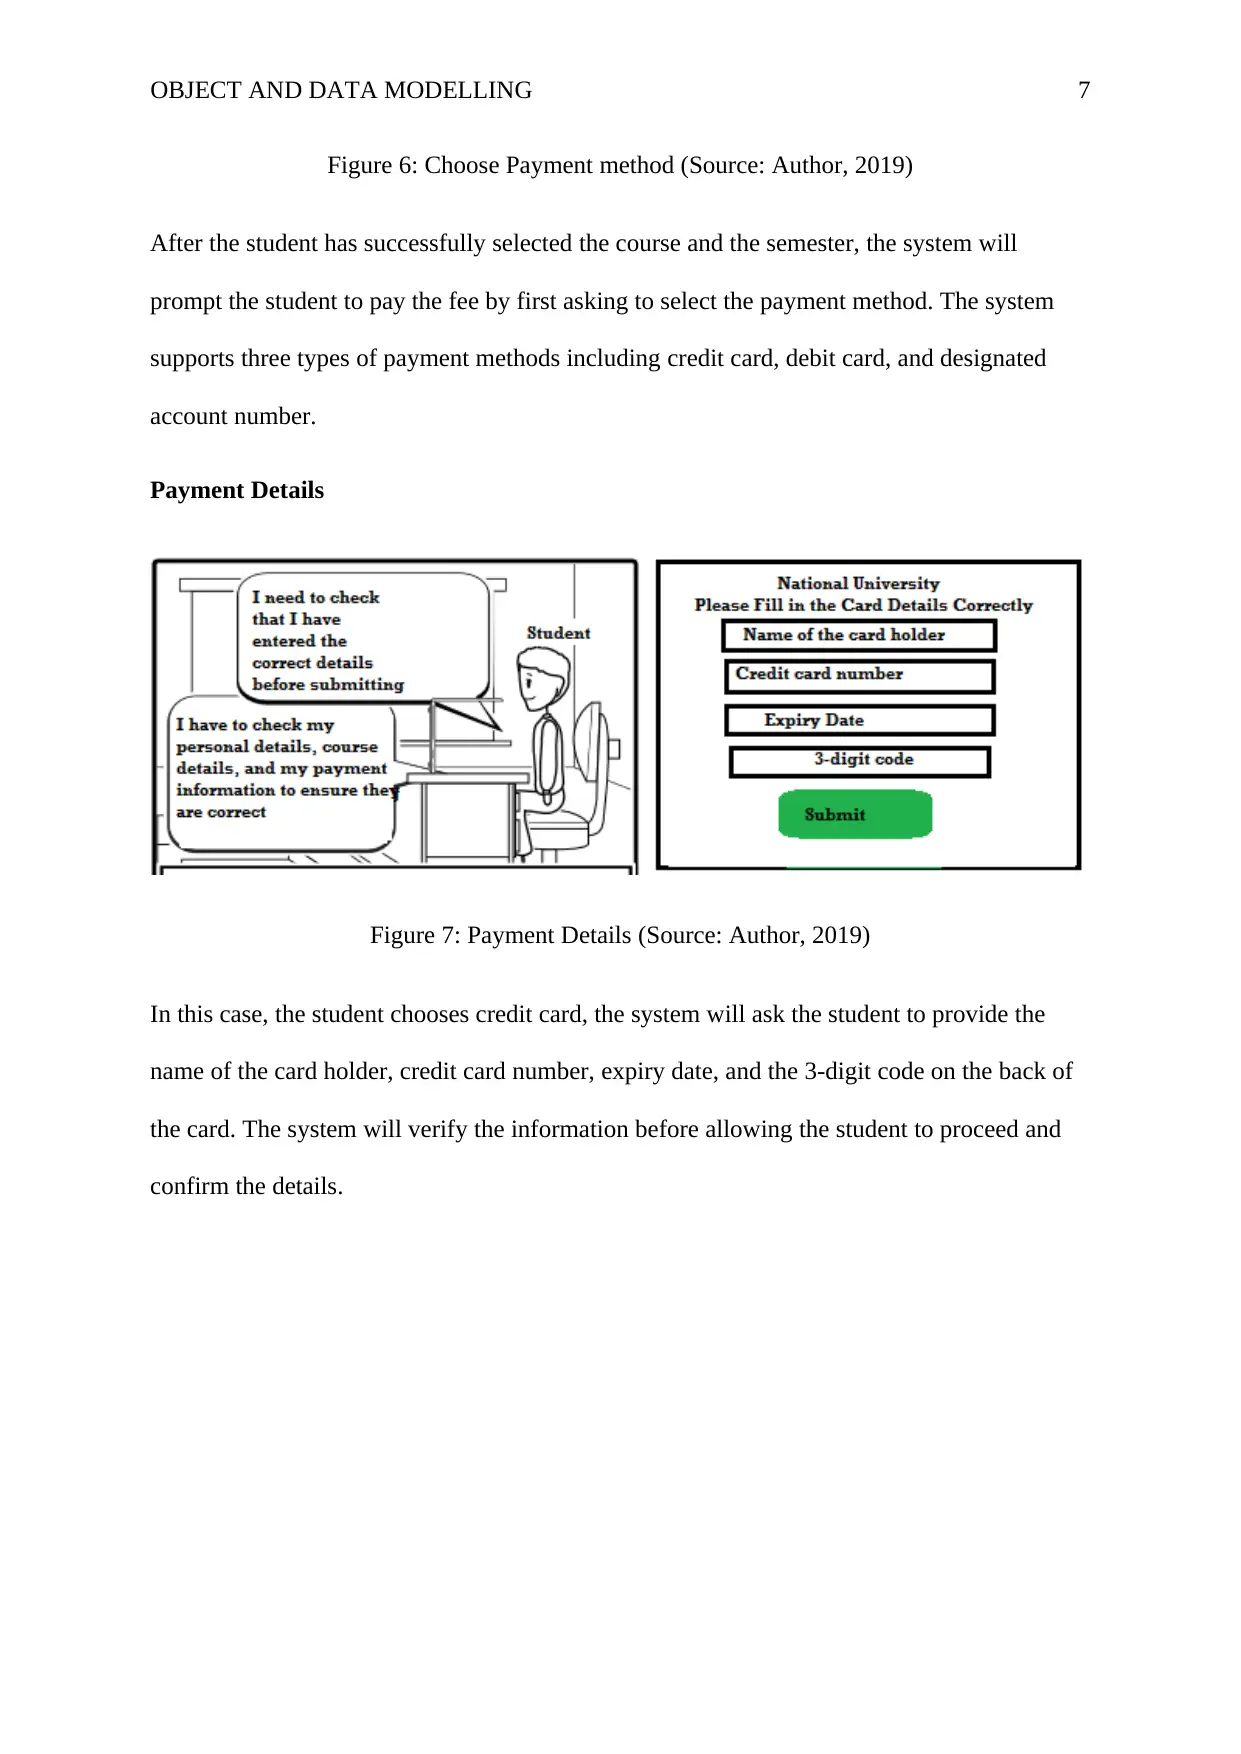
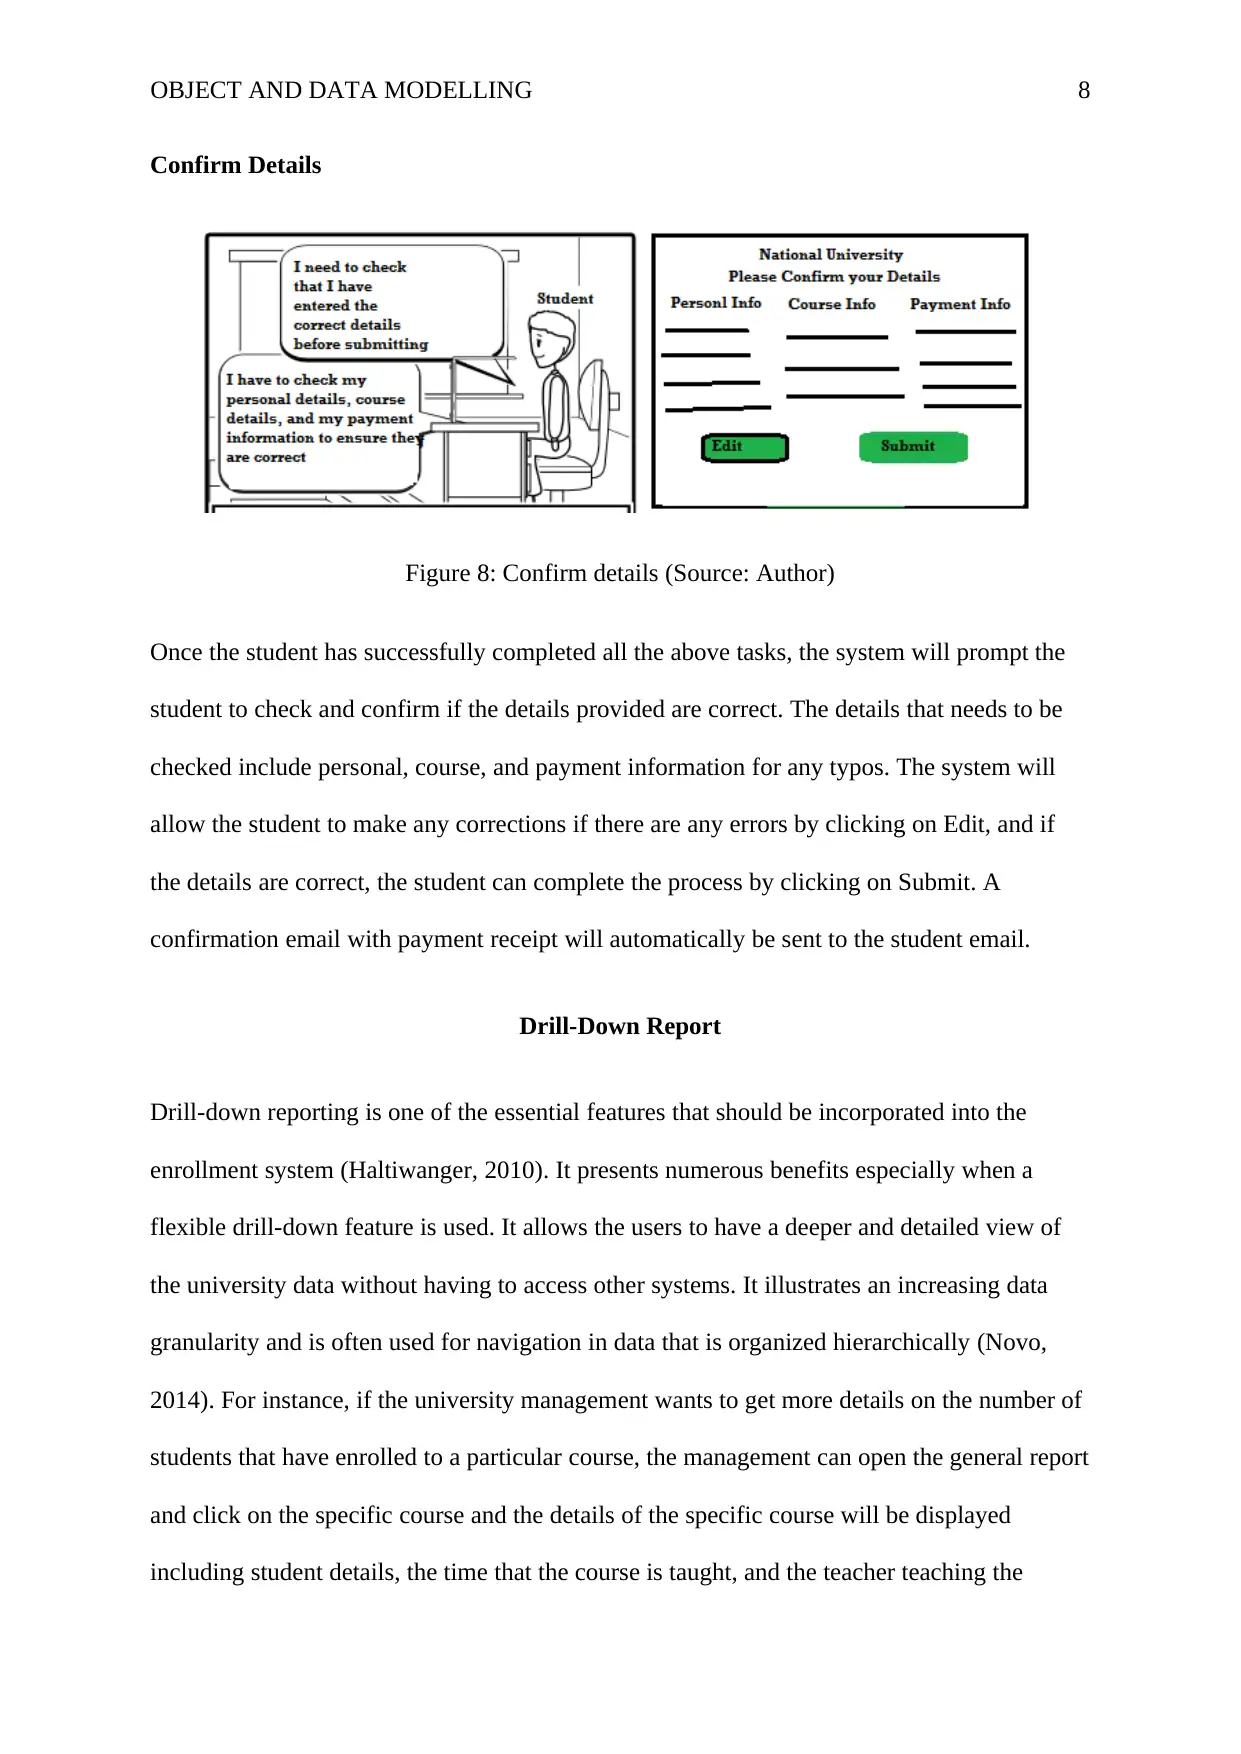
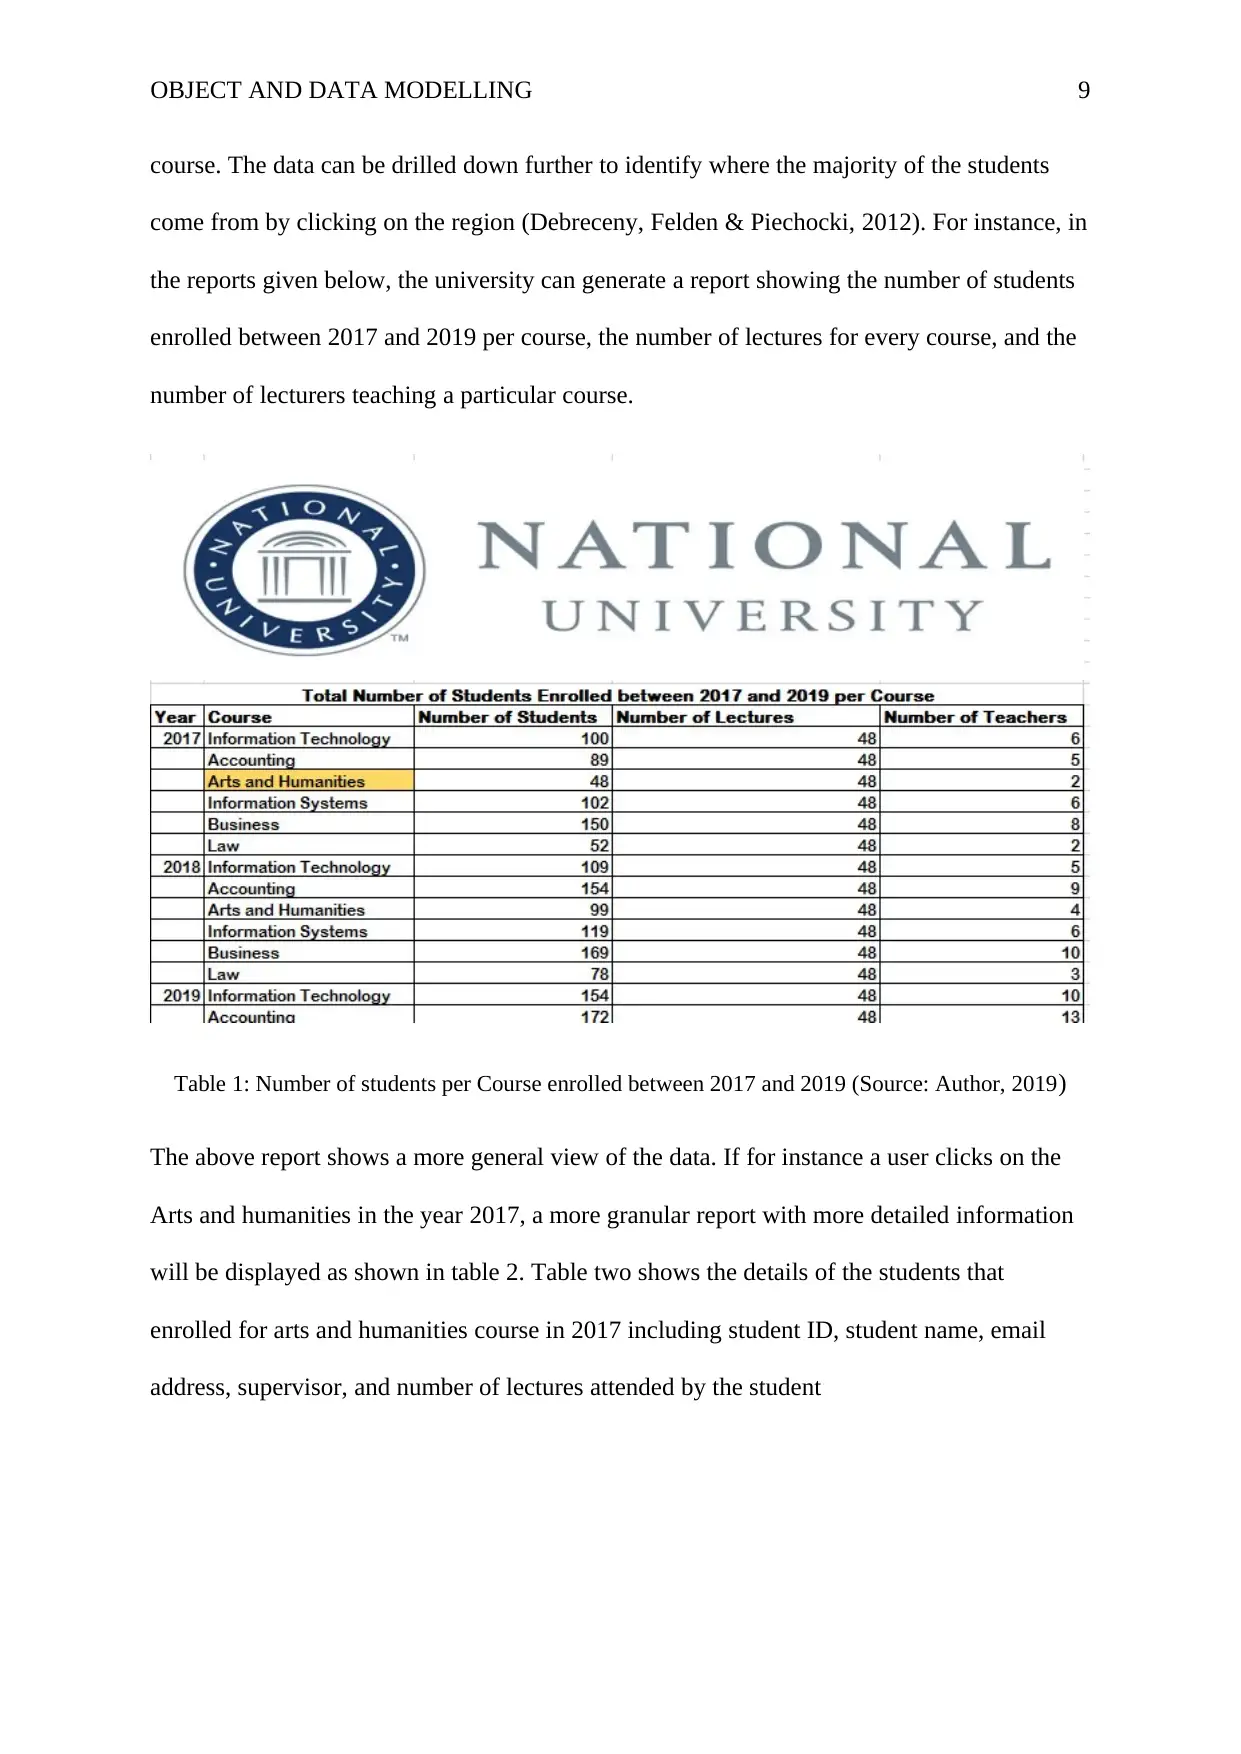
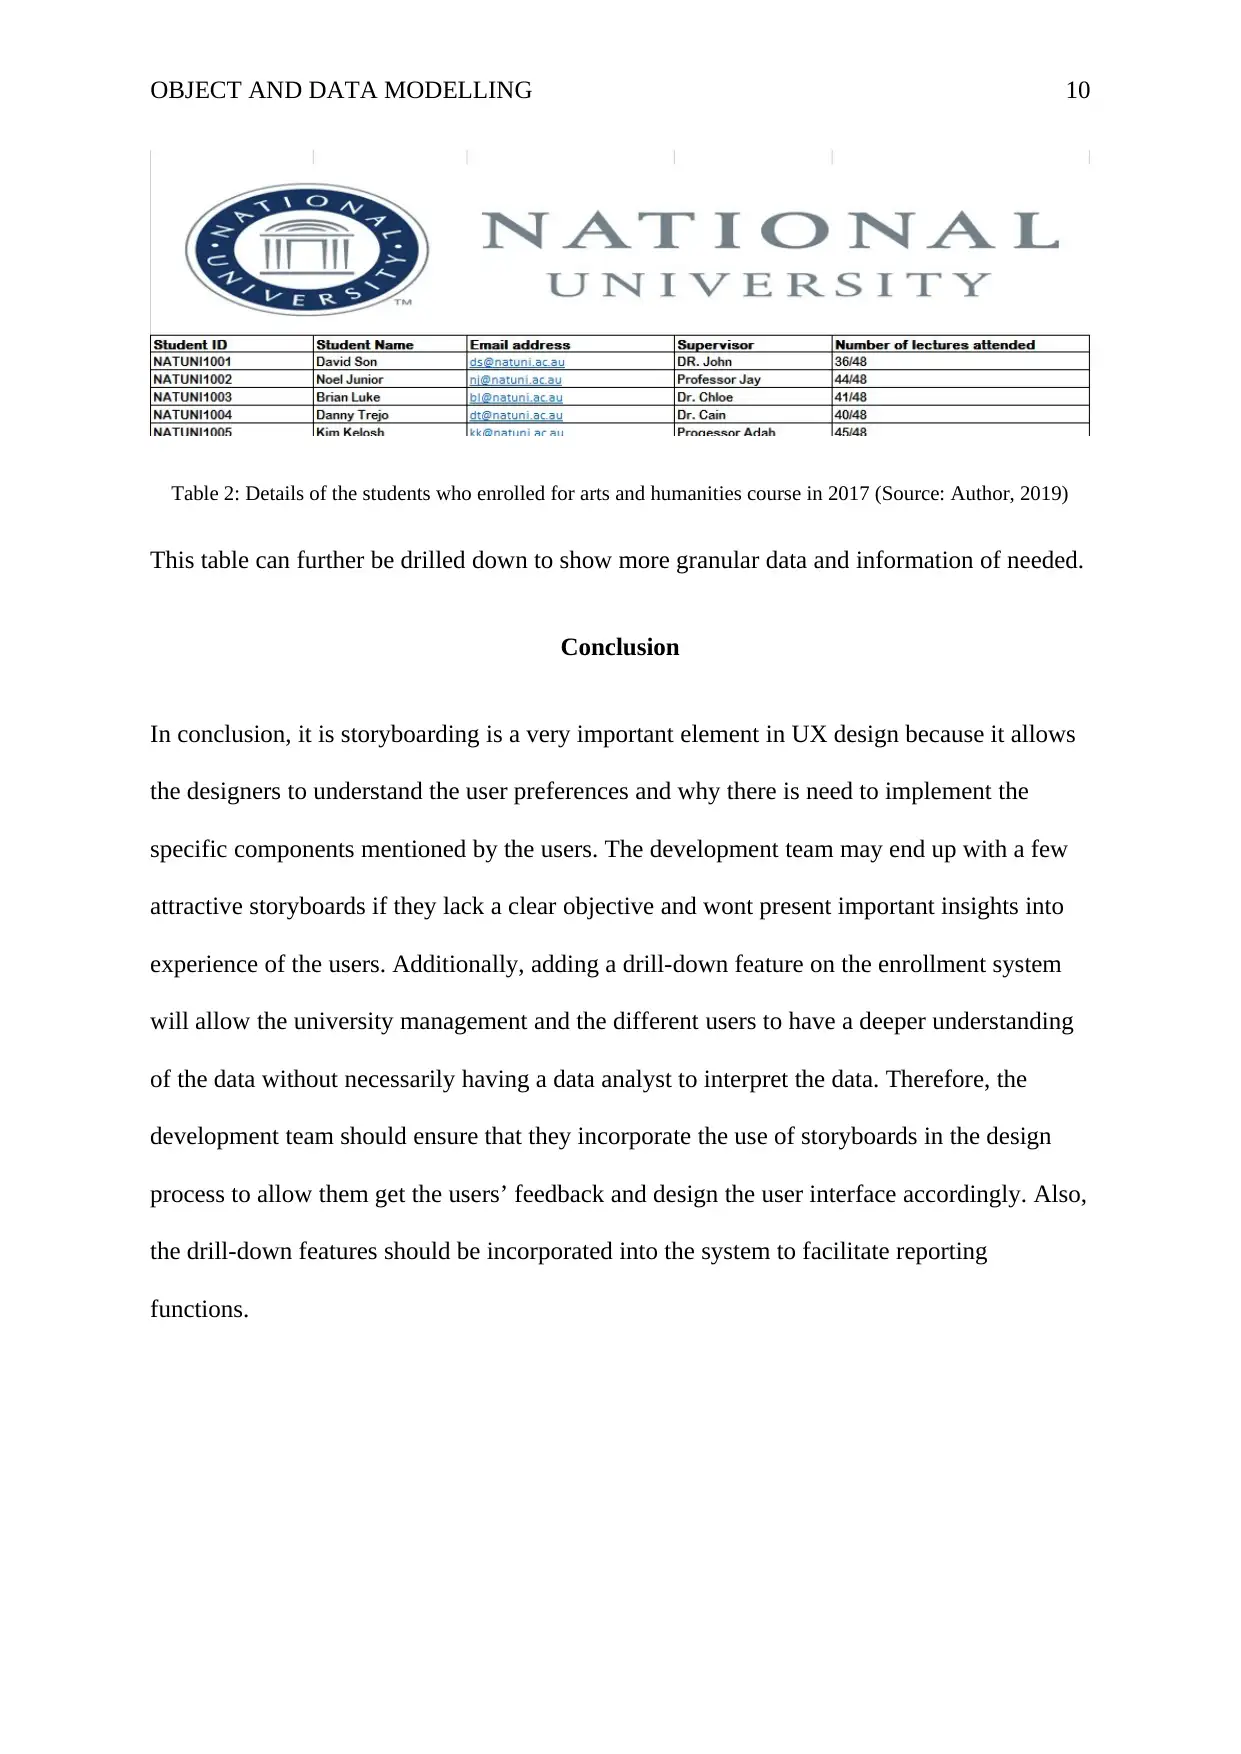
This report delves into object and data modelling, focusing on the design of a National University enrollment system. The report utilizes storyboards to visualize user interactions across various system functions, including student registration, login, course registration, course selection, college administrator functions, payment methods, and confirmation processes. These storyboards illustrate the user interface and flow for each function. Furthermore, the report highlights the importance and implementation of a drill-down report feature, which allows for detailed data analysis, such as student enrollment numbers per course and granular student information. The report concludes by emphasizing the significance of storyboards in user experience design and the benefits of drill-down features for data analysis and reporting within the enrollment system, providing valuable insights for system development and user interface design.
Contribute Materials
Your contribution can guide someone’s learning journey. Share your
documents today.

Running head: OBJECT AND DATA MODELLING 1
Object and Data Modelling
Student Name
Institutional Affiliation
Object and Data Modelling
Student Name
Institutional Affiliation
Secure Best Marks with AI Grader
Need help grading? Try our AI Grader for instant feedback on your assignments.

OBJECT AND DATA MODELLING 2
Table of Contents
Introduction................................................................................................................................3
Storyboards................................................................................................................................4
Register Student.....................................................................................................................4
Student Login.........................................................................................................................4
Registration of Courses..........................................................................................................5
Choose Course.......................................................................................................................5
College Administrator............................................................................................................6
Choose Payment Method.......................................................................................................6
Payment Details.....................................................................................................................7
Confirm Details......................................................................................................................7
Drill-Down Report.....................................................................................................................8
Conclusion................................................................................................................................10
References................................................................................................................................11

OBJECT AND DATA MODELLING 3
Introduction
A storyboard is a tool that is used in user interface design to visually explore and predict how
the users will interact with a system (Karr, 2015). Typically, it describes the way users will
interact with the system just like a movie but using graphics such as cartoons. Storyboards
helps the user interface designers to understand the interaction flow of the people with the
system overtime, thus, giving the designers a velar understanding of what users prefer or
view as important. Storyboarding creates a cheap and effective way of exploring, conveying,
and capturing user experience during system design (Kim, 2018). It makes the user design
process to be human-centered because the users are involved in the design process.
Additionally, designers can view the design from the different users’ point of view. It also
enables the designers to focus on what is important to the users.
In user interface design, storyboards are a powerful tool for ideation because it shapes the
flow and the persona, thus helping the designers to put together user stories, personas, and
different research findings to come up with system design requirements for the system
(Grozny, 2018). The complexities around the interface design are made simpler using words
and images (Babich, 2017). A storyboard is a foundation of human computer interaction and
illustrates the design elements and ideas that map system development. This paper will
describe the various storyboards for the different system functions and users of the
enrollment system for National University. It will also describe one of the drill-down report
that is essential in the project.

OBJECT AND DATA MODELLING 4
Storyboards
Register Student
Figure 1: Student Registration (Source: Author, 2019)
The student needs to register into the enrollment system by providing the name, mobile
number, physical address, personal email address, and the student ID that corresponds to
COE provided in the admission letter. Using the student ID that corresponds to COE ensures
that random registration from students that have not been invited are blocked to avoid
redundant and data that is not useful. To register successfully, the student need to have the
COE.
Student Login
Secure Best Marks with AI Grader
Need help grading? Try our AI Grader for instant feedback on your assignments.

OBJECT AND DATA MODELLING 5
Figure 2: Student Login (Source: Author, 2019)
An activation link will be sent to the student’s personal email address provided during
registration. This is important authentication step to ensure that it is actually a person who is
registering. Also, the system admin can activate user accounts. The student can login by
providing the username (Student ID) and the password.
Registration of Courses
Figure 3: Registration of Courses (Source: Author, 2019)
The college administrator is responsible for registering courses or updating them. Course
details include coursed, course name, and the semester that the course is offered (term-1,
term-2, or term 3)
Choose Course

OBJECT AND DATA MODELLING 6
Figure 4: Choose Course (Source: Author, 2019)
Upon successful registration, the enrollment system will prompt the student to select the
courses (min 3 and max 4) that he/she wishes to undertake as a student at National
University. The student is also required to select the semester he/she wishes to join. However,
the system has limited a lecture to 40 students, if the student selects a class that is already
full, the system will reject and suggest the available timelines for the student.
College Administrator
Figure 5: College Administrator (Source: Author, 2019)
The enrollment system should allow the college administrator to check admission status, print
admission forms, and approval of administrative functions.
Choose Payment Method

OBJECT AND DATA MODELLING 7
Figure 6: Choose Payment method (Source: Author, 2019)
After the student has successfully selected the course and the semester, the system will
prompt the student to pay the fee by first asking to select the payment method. The system
supports three types of payment methods including credit card, debit card, and designated
account number.
Payment Details
Figure 7: Payment Details (Source: Author, 2019)
In this case, the student chooses credit card, the system will ask the student to provide the
name of the card holder, credit card number, expiry date, and the 3-digit code on the back of
the card. The system will verify the information before allowing the student to proceed and
confirm the details.
Paraphrase This Document
Need a fresh take? Get an instant paraphrase of this document with our AI Paraphraser

OBJECT AND DATA MODELLING 8
Confirm Details
Figure 8: Confirm details (Source: Author)
Once the student has successfully completed all the above tasks, the system will prompt the
student to check and confirm if the details provided are correct. The details that needs to be
checked include personal, course, and payment information for any typos. The system will
allow the student to make any corrections if there are any errors by clicking on Edit, and if
the details are correct, the student can complete the process by clicking on Submit. A
confirmation email with payment receipt will automatically be sent to the student email.
Drill-Down Report
Drill-down reporting is one of the essential features that should be incorporated into the
enrollment system (Haltiwanger, 2010). It presents numerous benefits especially when a
flexible drill-down feature is used. It allows the users to have a deeper and detailed view of
the university data without having to access other systems. It illustrates an increasing data
granularity and is often used for navigation in data that is organized hierarchically (Novo,
2014). For instance, if the university management wants to get more details on the number of
students that have enrolled to a particular course, the management can open the general report
and click on the specific course and the details of the specific course will be displayed
including student details, the time that the course is taught, and the teacher teaching the

OBJECT AND DATA MODELLING 9
course. The data can be drilled down further to identify where the majority of the students
come from by clicking on the region (Debreceny, Felden & Piechocki, 2012). For instance, in
the reports given below, the university can generate a report showing the number of students
enrolled between 2017 and 2019 per course, the number of lectures for every course, and the
number of lecturers teaching a particular course.
Table 1: Number of students per Course enrolled between 2017 and 2019 (Source: Author, 2019)
The above report shows a more general view of the data. If for instance a user clicks on the
Arts and humanities in the year 2017, a more granular report with more detailed information
will be displayed as shown in table 2. Table two shows the details of the students that
enrolled for arts and humanities course in 2017 including student ID, student name, email
address, supervisor, and number of lectures attended by the student

OBJECT AND DATA MODELLING 10
Table 2: Details of the students who enrolled for arts and humanities course in 2017 (Source: Author, 2019)
This table can further be drilled down to show more granular data and information of needed.
Conclusion
In conclusion, it is storyboarding is a very important element in UX design because it allows
the designers to understand the user preferences and why there is need to implement the
specific components mentioned by the users. The development team may end up with a few
attractive storyboards if they lack a clear objective and wont present important insights into
experience of the users. Additionally, adding a drill-down feature on the enrollment system
will allow the university management and the different users to have a deeper understanding
of the data without necessarily having a data analyst to interpret the data. Therefore, the
development team should ensure that they incorporate the use of storyboards in the design
process to allow them get the users’ feedback and design the user interface accordingly. Also,
the drill-down features should be incorporated into the system to facilitate reporting
functions.
Secure Best Marks with AI Grader
Need help grading? Try our AI Grader for instant feedback on your assignments.

OBJECT AND DATA MODELLING 11
References
Babich, N. (2017). Storyboarding in UX Design. Retrieved from
https://uxplanet.org/storyboarding-in-ux-design-b9d2e18e5fab
Debreceny, R., Felden, C., & Piechocki, M. (2012). New dimensions of business reporting
and XBRL. Wiesbaden: Deutscher UniversitStäts-Verlag.
Grozny, M. (2018). 17 reasons to use Storyboards in UX Design. Retrieved from
https://uxdesign.cc/17-reasons-to-use-a-storyboards-in-ux-design-2bc6fea73e20
Haltiwanger, J. (2010). Making Drill Down Analysis. SSRN Electronic Journal. doi:
10.2139/ssrn.1889161
Karr, A. (2015). UX research vs. UX design. Interactions, 22(6), 7-7. doi: 10.1145/2834964
Kim, B. (2018). Cognitive and Emotional UX Design Methodology for Mobile
Chatbot. KOREA SCIENCE & ART FORUM, 34, 27-37. doi:
10.17548/ksaf.2018.06.30.27
Novo, J. (2014). Drilling Down. Saint Petersburg FL: Booklocker.com.
1 out of 11
Related Documents

Your All-in-One AI-Powered Toolkit for Academic Success.
+13062052269
info@desklib.com
Available 24*7 on WhatsApp / Email
Unlock your academic potential
© 2024 | Zucol Services PVT LTD | All rights reserved.