National University: Object and Data Modelling Enrollment System
VerifiedAdded on 2022/11/25
|16
|3006
|476
Project
AI Summary
This project focuses on object and data modelling for an enrollment system at National University. It begins with an introduction to storyboards and their importance in visualizing system functions and user interfaces. The project presents detailed dialogs for key system processes like registration, login, course registration, and payment. Following the dialogs, the project includes comprehensive enrollment system storyboards that illustrate the user's interaction with the system at various stages, from registration to course selection and payment. Furthermore, the project delves into drill-down reports, a crucial feature for data analysis, demonstrating how users can access detailed information from general overviews. The drill-down report example shows how enrollment data can be analyzed by year, semester, and student details. The report highlights the functionality of going deeper into data layers to enhance user understanding. The project concludes with a discussion on how these design elements contribute to a user-friendly and efficient enrollment system. The content is contributed by a student and available on Desklib, a platform providing AI-based study tools.

Running head: OBJECT AND DATA MODELLING 1
Object and Data Modelling
Student Name
Institutional Affiliation
Object and Data Modelling
Student Name
Institutional Affiliation
Paraphrase This Document
Need a fresh take? Get an instant paraphrase of this document with our AI Paraphraser
OBJECT AND DATA MODELLING 2
Table of Contents
Introduction................................................................................................................................3
Dialogs.......................................................................................................................................4
Register Dialog.......................................................................................................................4
Login Dialog..........................................................................................................................4
Register Course Dialog..........................................................................................................4
Select Major Course Dialog...................................................................................................5
Confirm Details Dialog..........................................................................................................5
Select Payment Method Dialog..............................................................................................6
Credit card details Dialog.......................................................................................................6
Enrolment Confirmation Dialog............................................................................................7
Enrollment System Storyboards.................................................................................................8
Drill Down Report....................................................................................................................11
Conclusion................................................................................................................................13
References................................................................................................................................15

OBJECT AND DATA MODELLING 3
Introduction
Story boards are very important aspects in visualizing how the system works (Rivers, 2016).
For a long time, storyboards have been used in televisions and films as a means of visual
story telling through comics and graphic novels (William, 2017). However, storyboards are
used differently in information systems, but they are used to tell stories on how the end
product will be used and not how the product is developed (Scott, 2017). They give a visual
illustration of the different system functions.
Using storyboards, enables the system designers to easily and quickly include real-world
scenarios that involve people and events (Timothy, 2015). Designers will also enable the
designers to learn unanticipated concepts from the storyboards and adding the concepts into
the design efforts to help them achieve ideal user experience. Additionally, when designing a
system, more focus should be on user interface because you can develop a fully functional
system, but is the user interface is poorly designed, users may reject it (Iadt.edu, 2013). As
such, storyboard will allow the system developers and designers to describe the user interface
using storyboards and get user feedback. Moreover, use of storyboards aids in enforcing a
discipline of conceptualizing in terms of experiential flow (van der Lelie, 2015). It also
ensures that user interface design is in line with the user requirements and the designers does
not lose sight of the flow and context it will be applied in towards achieving the ideal end
experience (Ambrose, 2013). This report will provide various storyboards for the various
system functions that will be illustrated in the subsequent sections. The paper will also
describe one drill report.
⊘ This is a preview!⊘
Do you want full access?
Subscribe today to unlock all pages.
Trusted by 1+ million students worldwide
OBJECT AND DATA MODELLING 4
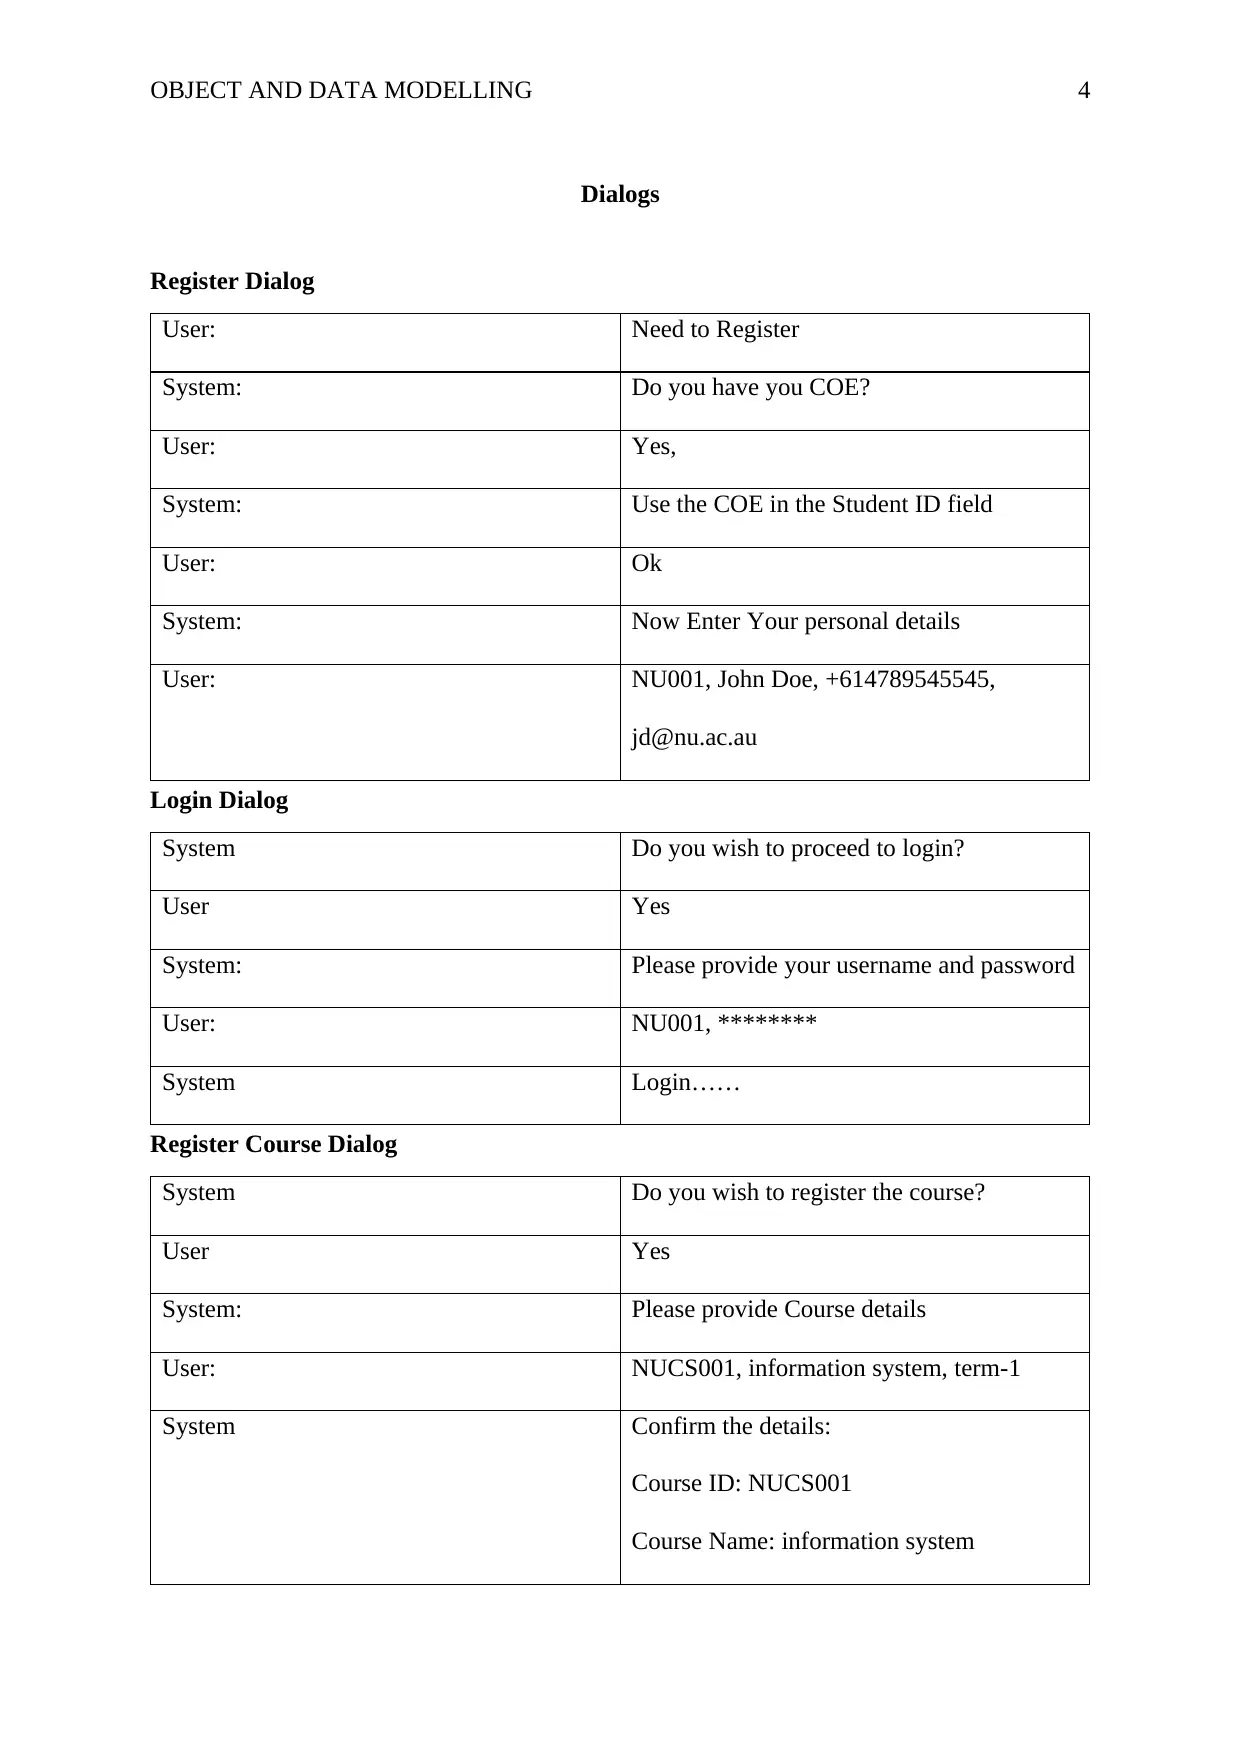
Dialogs
Register Dialog
User: Need to Register
System: Do you have you COE?
User: Yes,
System: Use the COE in the Student ID field
User: Ok
System: Now Enter Your personal details
User: NU001, John Doe, +614789545545,
jd@nu.ac.au
Login Dialog
System Do you wish to proceed to login?
User Yes
System: Please provide your username and password
User: NU001, ********
System Login……
Register Course Dialog
System Do you wish to register the course?
User Yes
System: Please provide Course details
User: NUCS001, information system, term-1
System Confirm the details:
Course ID: NUCS001
Course Name: information system
Paraphrase This Document
Need a fresh take? Get an instant paraphrase of this document with our AI Paraphraser
OBJECT AND DATA MODELLING 5
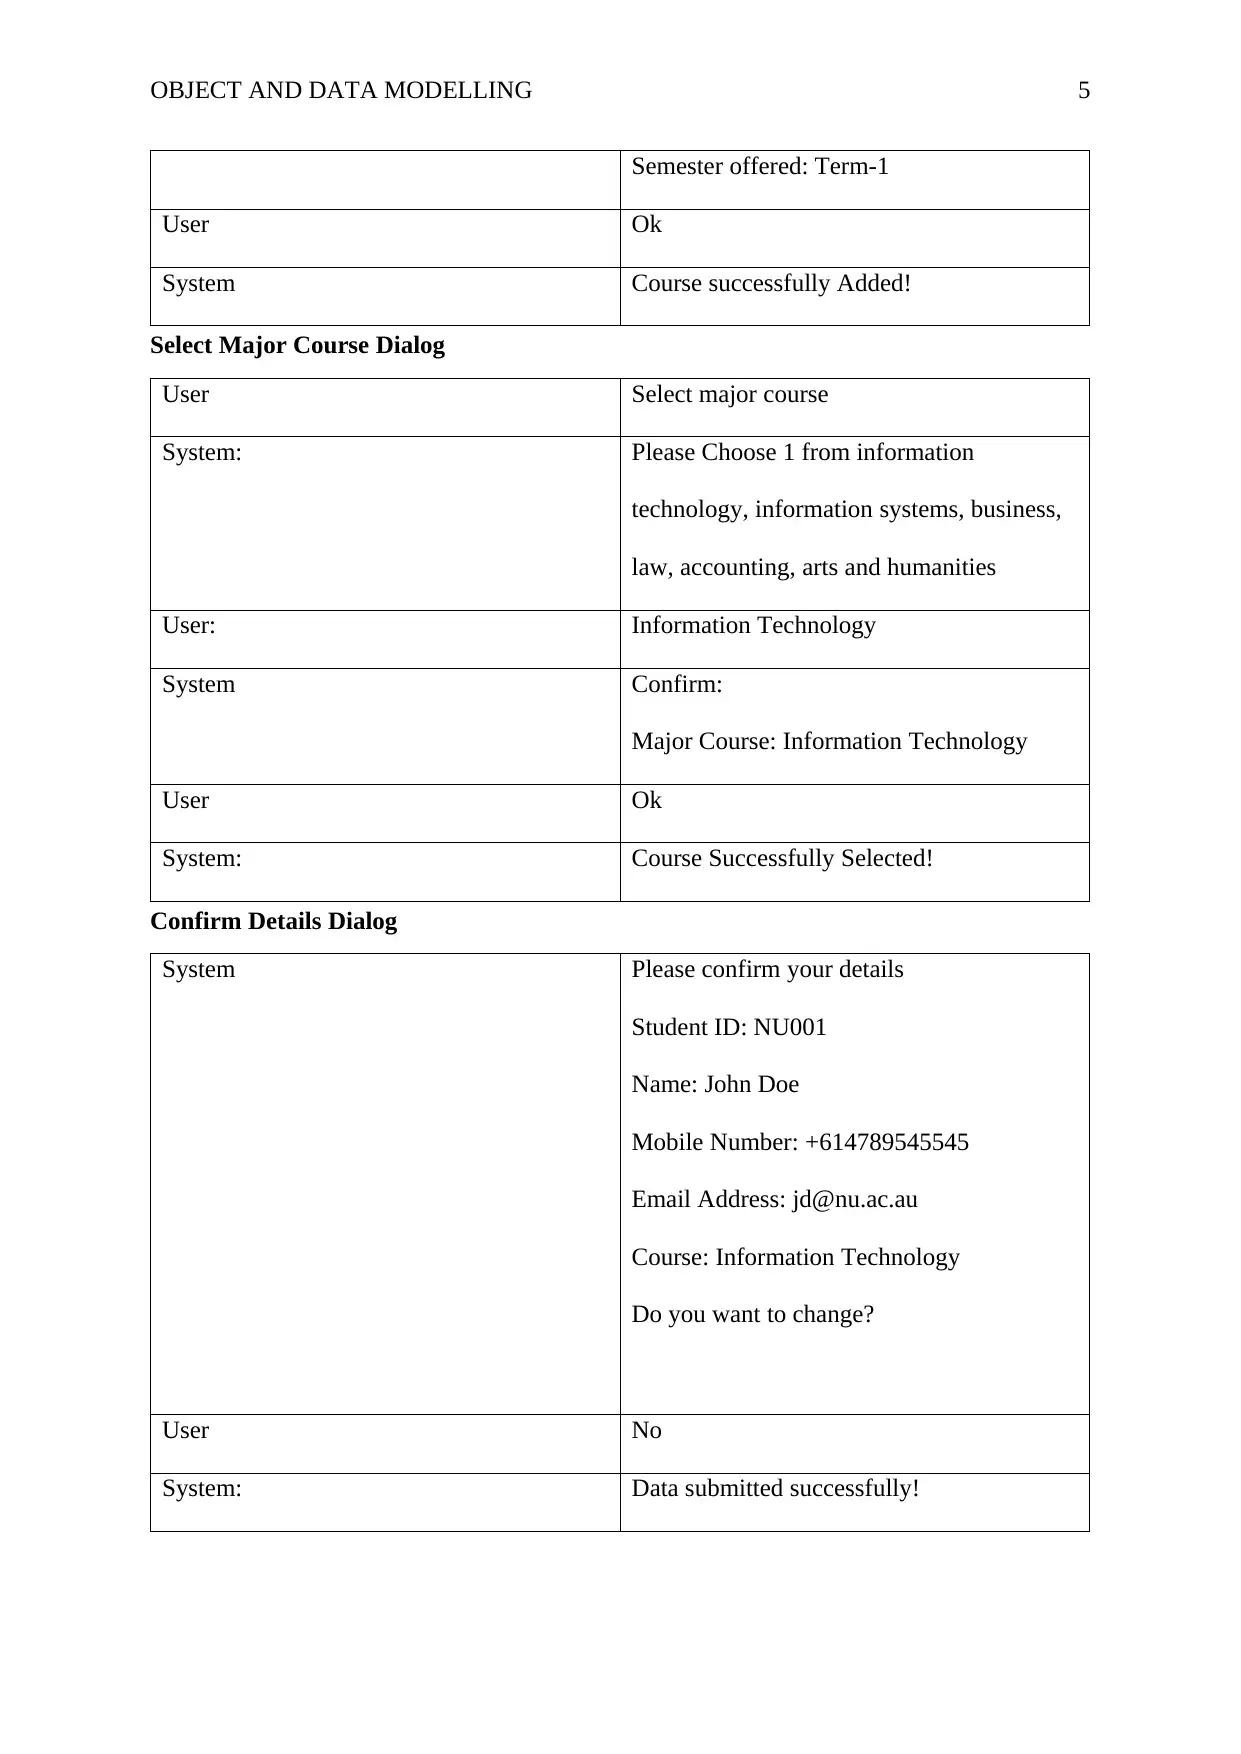
Semester offered: Term-1
User Ok
System Course successfully Added!
Select Major Course Dialog
User Select major course
System: Please Choose 1 from information
technology, information systems, business,
law, accounting, arts and humanities
User: Information Technology
System Confirm:
Major Course: Information Technology
User Ok
System: Course Successfully Selected!
Confirm Details Dialog
System Please confirm your details
Student ID: NU001
Name: John Doe
Mobile Number: +614789545545
Email Address: jd@nu.ac.au
Course: Information Technology
Do you want to change?
User No
System: Data submitted successfully!
OBJECT AND DATA MODELLING 6
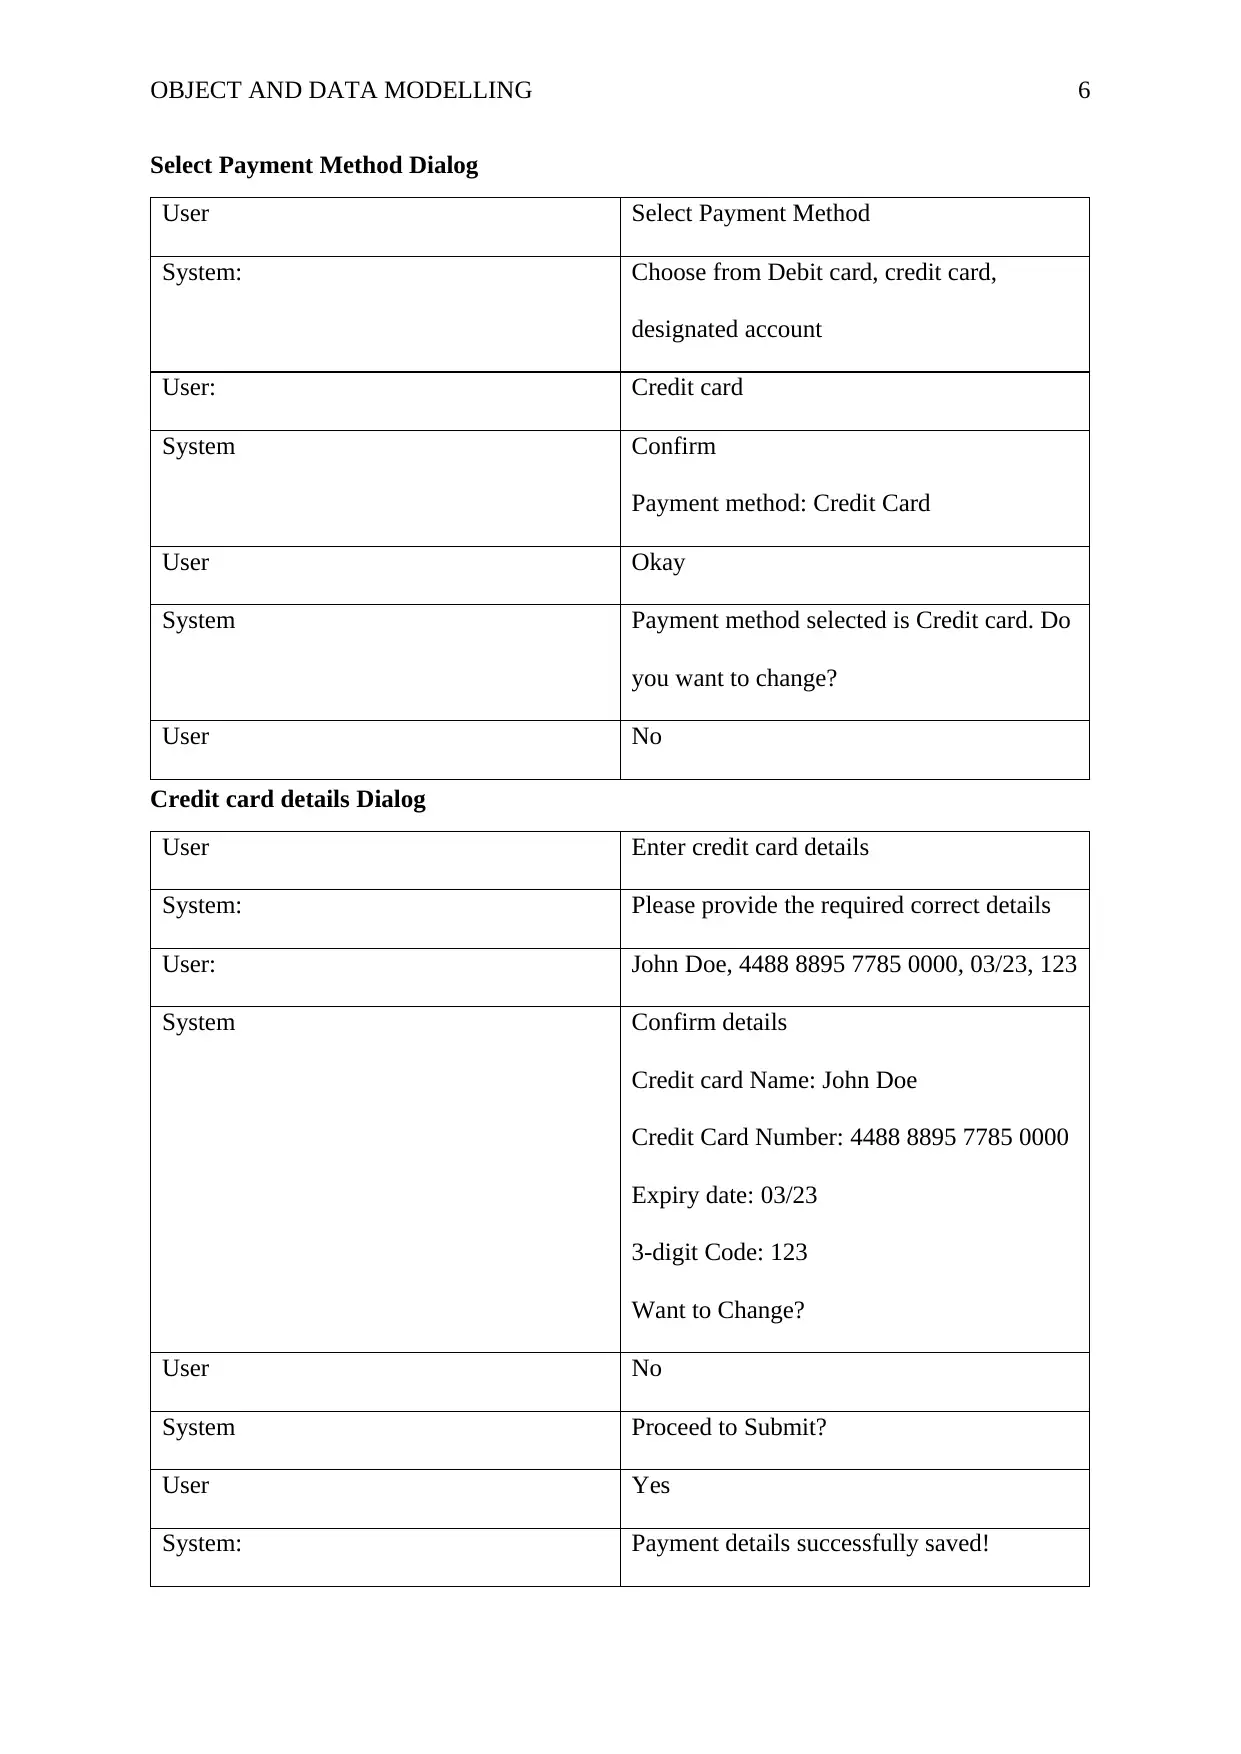
Select Payment Method Dialog
User Select Payment Method
System: Choose from Debit card, credit card,
designated account
User: Credit card
System Confirm
Payment method: Credit Card
User Okay
System Payment method selected is Credit card. Do
you want to change?
User No
Credit card details Dialog
User Enter credit card details
System: Please provide the required correct details
User: John Doe, 4488 8895 7785 0000, 03/23, 123
System Confirm details
Credit card Name: John Doe
Credit Card Number: 4488 8895 7785 0000
Expiry date: 03/23
3-digit Code: 123
Want to Change?
User No
System Proceed to Submit?
User Yes
System: Payment details successfully saved!
⊘ This is a preview!⊘
Do you want full access?
Subscribe today to unlock all pages.
Trusted by 1+ million students worldwide
OBJECT AND DATA MODELLING 7
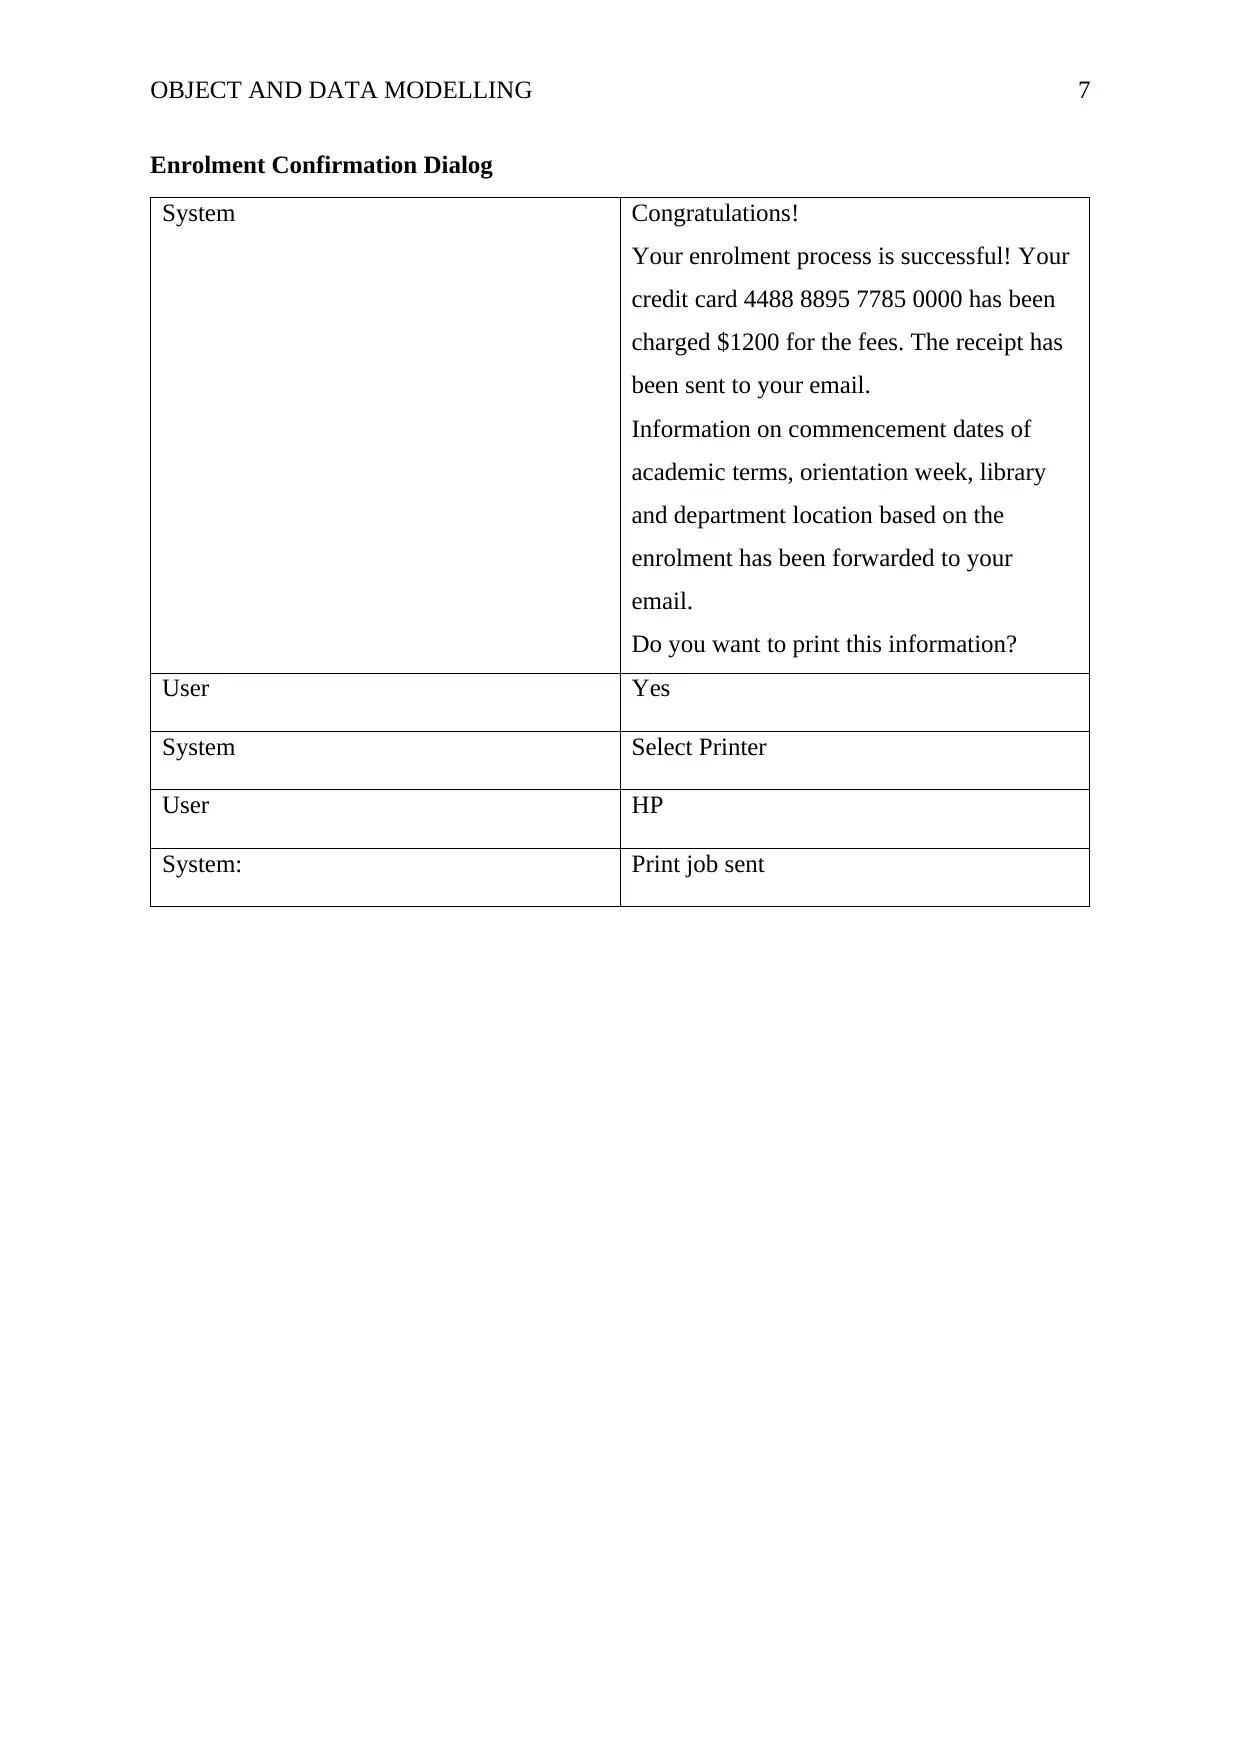
Enrolment Confirmation Dialog
System Congratulations!
Your enrolment process is successful! Your
credit card 4488 8895 7785 0000 has been
charged $1200 for the fees. The receipt has
been sent to your email.
Information on commencement dates of
academic terms, orientation week, library
and department location based on the
enrolment has been forwarded to your
email.
Do you want to print this information?
User Yes
System Select Printer
User HP
System: Print job sent
Paraphrase This Document
Need a fresh take? Get an instant paraphrase of this document with our AI Paraphraser
OBJECT AND DATA MODELLING 8
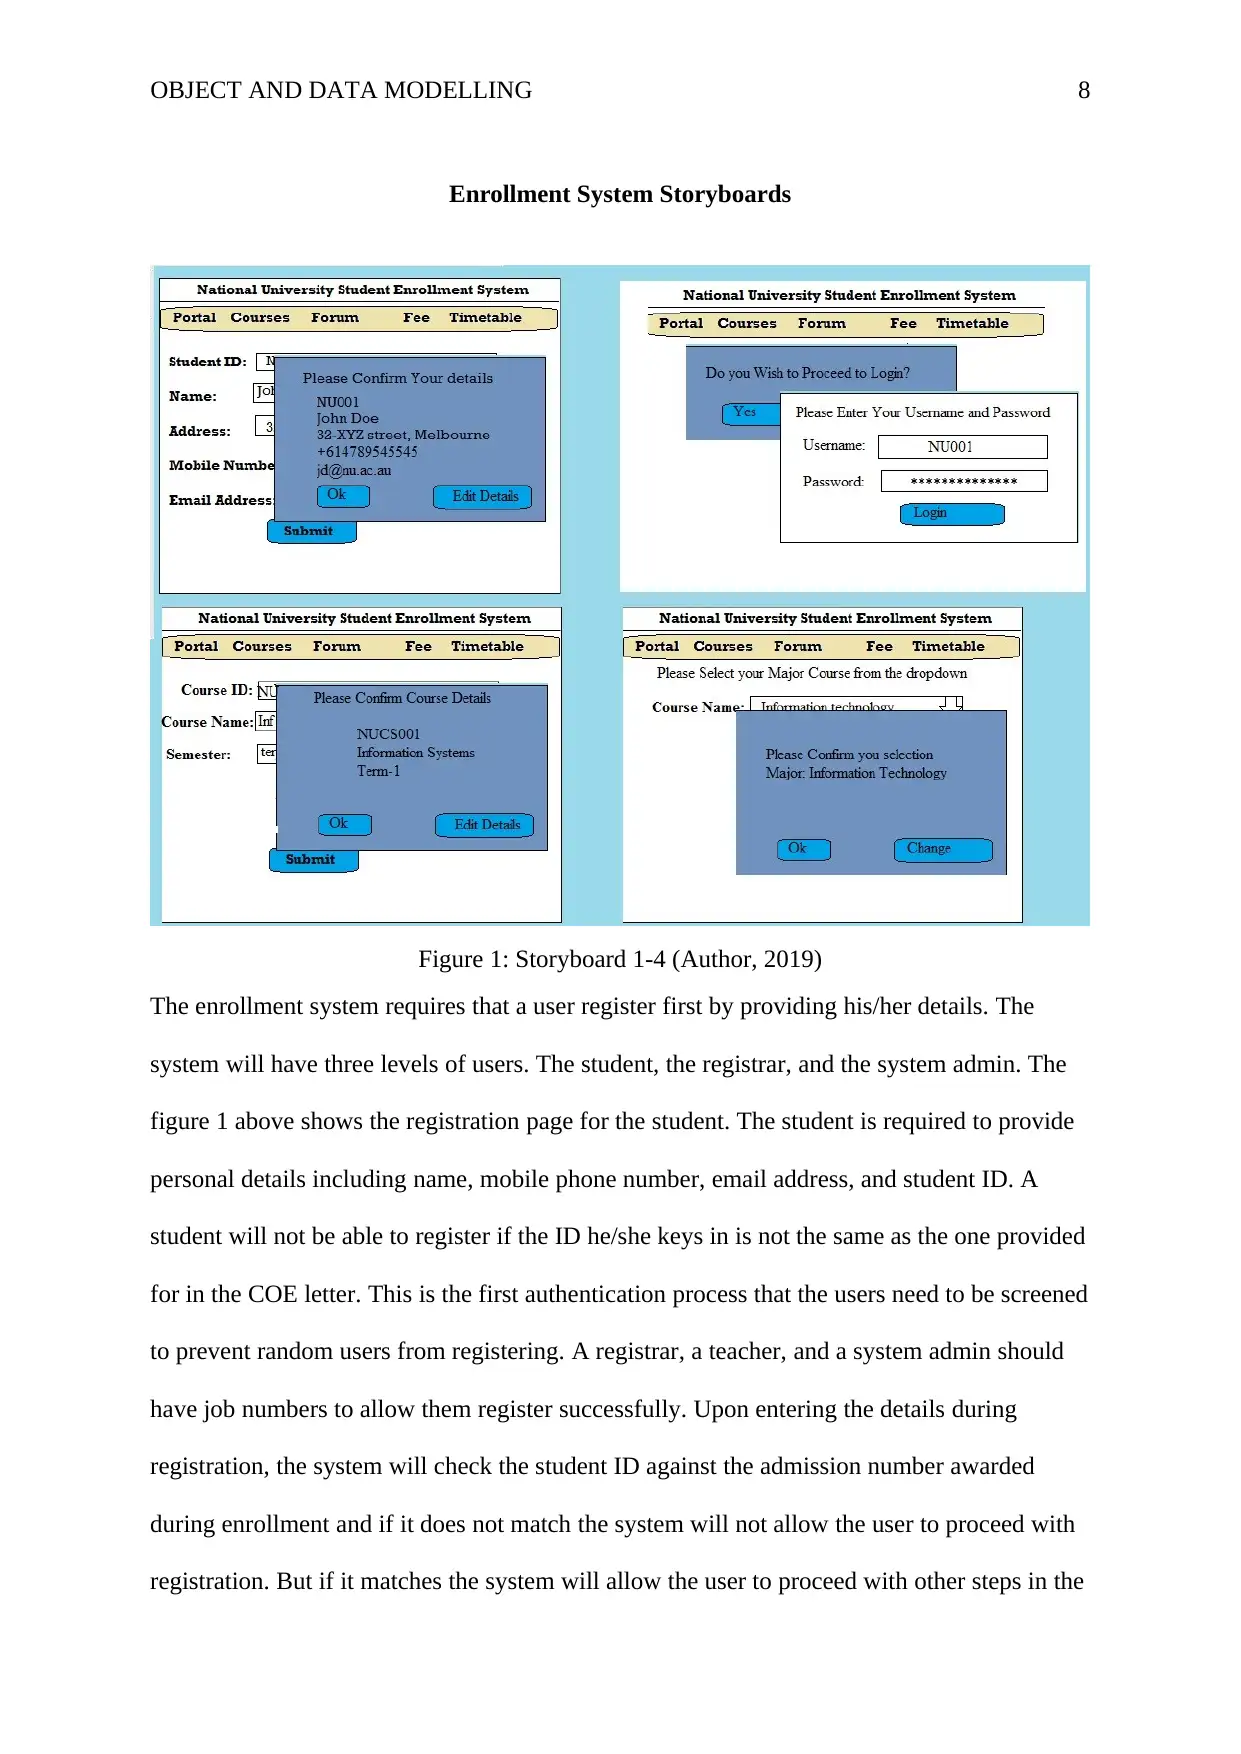
Enrollment System Storyboards
Figure 1: Storyboard 1-4 (Author, 2019)
The enrollment system requires that a user register first by providing his/her details. The
system will have three levels of users. The student, the registrar, and the system admin. The
figure 1 above shows the registration page for the student. The student is required to provide
personal details including name, mobile phone number, email address, and student ID. A
student will not be able to register if the ID he/she keys in is not the same as the one provided
for in the COE letter. This is the first authentication process that the users need to be screened
to prevent random users from registering. A registrar, a teacher, and a system admin should
have job numbers to allow them register successfully. Upon entering the details during
registration, the system will check the student ID against the admission number awarded
during enrollment and if it does not match the system will not allow the user to proceed with
registration. But if it matches the system will allow the user to proceed with other steps in the

OBJECT AND DATA MODELLING 9
enrollment process. Upon successful registration, the system will send an activation link to
the user’s email. The user needs to click on the link in order to activate the account.
Upon successful registration, the user will be able to login to the system and access the
system functions. The user will not be able to login in until he/she activates the account. The
login page will be common for the different levels of users but every user has been
categorized based on the functions that the user has been assigned. Upon login, a student will
be able to check on the available courses, update his/her profile, update payment details, and
choose the semester. A teacher upon login will be able to access a dashboard that will allow
him/her to choose the subjects and the time he/she will be available. Moreover, the system
admin will view a dashboard showing system status and the number of users logged in to the
system. The registrar will have a dashboard that allows them to add courses, student
information, and time table.
Course registration is done by the registrar. The registrar has to login in order to add course
or update course details. Some of the course details that are entered by the registrar are course
name and semester that the course is offered; the course ID is automatically generated by the
system. The system also allows the registrar to assign some courses to some teachers and also
can update when the course is offered.
After the student has registered and has been able to login successfully, the system will allow
him or her to choose the preferred courses (3 to 4 courses) and the time he/she wishes to join.
The system allows a maximum of 4 courses and a minimum of 3. The student will choose the
time or semester he/she prefers. However, the system only restricts a lecture class of a
maximum of 40 students. If the class is full, the system will recommend the available class
and time for the student.
⊘ This is a preview!⊘
Do you want full access?
Subscribe today to unlock all pages.
Trusted by 1+ million students worldwide
OBJECT AND DATA MODELLING 10
The system will allow the teacher to select the course and the time he/she wishes to teach.
This enables the teacher to plan for the lectures in time and the number of lectures he/she will
have in a week. Once the teacher has selected a course, he/she will not be able to change
(changes to course details can only be done by the registrar or the system admin).
Additionally, the students will be able to know the teacher who will be teaching them the
course or subject.
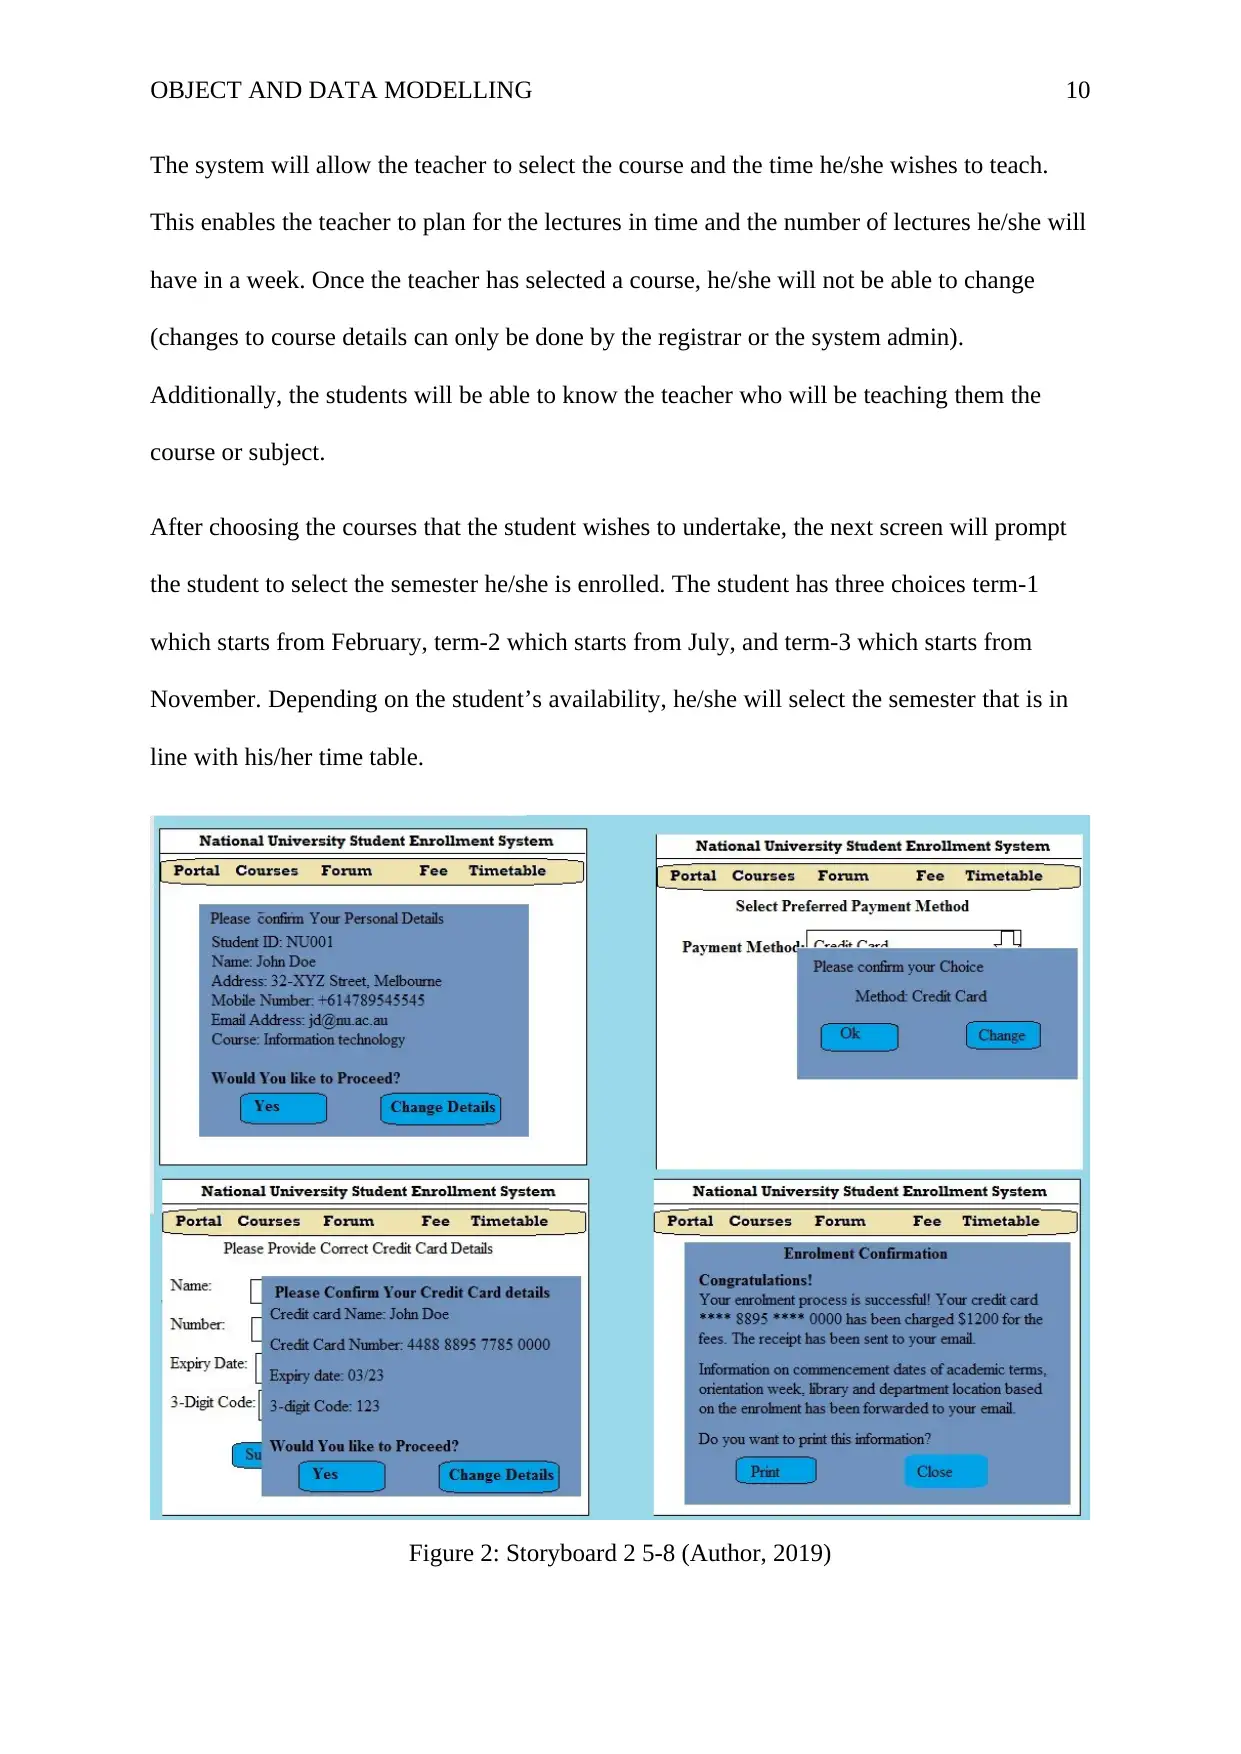
After choosing the courses that the student wishes to undertake, the next screen will prompt
the student to select the semester he/she is enrolled. The student has three choices term-1
which starts from February, term-2 which starts from July, and term-3 which starts from
November. Depending on the student’s availability, he/she will select the semester that is in
line with his/her time table.
Figure 2: Storyboard 2 5-8 (Author, 2019)
The system will allow the teacher to select the course and the time he/she wishes to teach.
This enables the teacher to plan for the lectures in time and the number of lectures he/she will
have in a week. Once the teacher has selected a course, he/she will not be able to change
(changes to course details can only be done by the registrar or the system admin).
Additionally, the students will be able to know the teacher who will be teaching them the
course or subject.
After choosing the courses that the student wishes to undertake, the next screen will prompt
the student to select the semester he/she is enrolled. The student has three choices term-1
which starts from February, term-2 which starts from July, and term-3 which starts from
November. Depending on the student’s availability, he/she will select the semester that is in
line with his/her time table.
Figure 2: Storyboard 2 5-8 (Author, 2019)
Paraphrase This Document
Need a fresh take? Get an instant paraphrase of this document with our AI Paraphraser

OBJECT AND DATA MODELLING 11
The system will incorporate three payment options designated account number, master card,
or debit card. Upon selecting the mode of payment, the system will open a new screen
prompting the student to enter card or account details.
If the user selects debit or master card option, he/she will be prompted to enter names of the
card holder, card number, card type (whether master card or debit card), expiry date, and the
three-digit code that is written on the back of the card. The system will validate this
information using the external banking API connected to the system to check if the details are
correct. The system will automatically deduct the fee from the account and generate a receipt
for the student.
Once the student has entered all the details, the system will prompt the him/her to check if the
information provided is correct. Personal, course, and payment details will be displayed in
one screen to enable the student to confirm them. If some details need to be changed, the
system will allow the student to edit the details then submit.
Drill Down Report
Drill down reports are extremely useful features that any system can offer. They are crucial
features in business intelligence (Diamantini, Potena & Storti, 2015). This is because drill
down reports offer the users the ability to view data and information in a more insightful and
detailed manner. Drill down has the ability that allows the user to shift from amore general
concept or view of the data to more detailed and precise fashion at a mouse click. For
instance, a report that displays how student are enrolling to different courses and from which
state or region the students come from, allows the National University to filter the data by
clicking on the country, state, and city to see students by city or state. Such reports are
referred to as drill-down because they allow the university to go deeper into more explicit
data layers being analyzed (Joglekar, Garcia-Molina & Parameswaran, 2015).
OBJECT AND DATA MODELLING 12
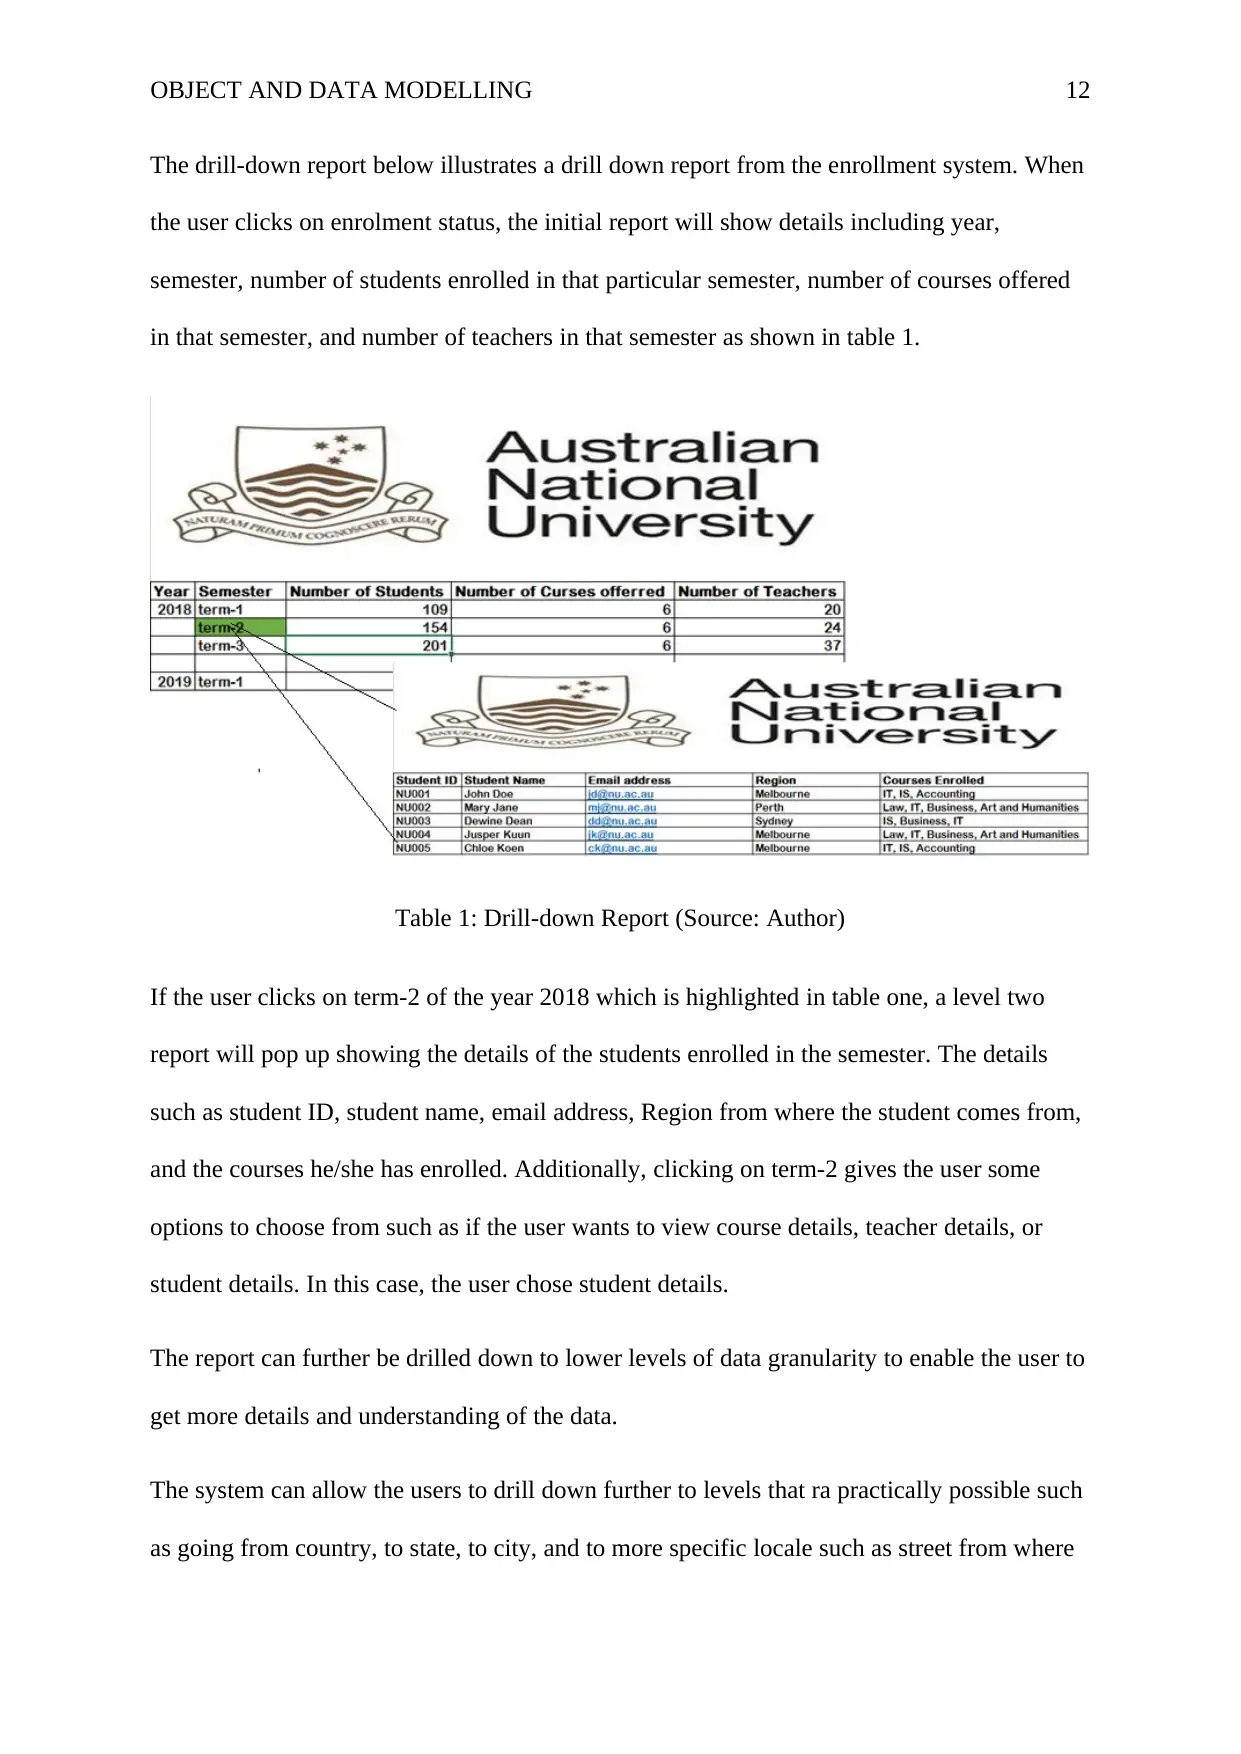
The drill-down report below illustrates a drill down report from the enrollment system. When
the user clicks on enrolment status, the initial report will show details including year,
semester, number of students enrolled in that particular semester, number of courses offered
in that semester, and number of teachers in that semester as shown in table 1.
Table 1: Drill-down Report (Source: Author)
If the user clicks on term-2 of the year 2018 which is highlighted in table one, a level two
report will pop up showing the details of the students enrolled in the semester. The details
such as student ID, student name, email address, Region from where the student comes from,
and the courses he/she has enrolled. Additionally, clicking on term-2 gives the user some
options to choose from such as if the user wants to view course details, teacher details, or
student details. In this case, the user chose student details.
The report can further be drilled down to lower levels of data granularity to enable the user to
get more details and understanding of the data.
The system can allow the users to drill down further to levels that ra practically possible such
as going from country, to state, to city, and to more specific locale such as street from where
⊘ This is a preview!⊘
Do you want full access?
Subscribe today to unlock all pages.
Trusted by 1+ million students worldwide
1 out of 16
Related Documents


Your All-in-One AI-Powered Toolkit for Academic Success.
+13062052269
info@desklib.com
Available 24*7 on WhatsApp / Email
![[object Object]](/_next/static/media/star-bottom.7253800d.svg)
Unlock your academic potential
Copyright © 2020–2026 A2Z Services. All Rights Reserved. Developed and managed by ZUCOL.