Financial Statement Analysis and Equity Valuation of Ocado Group Plc
VerifiedAdded on 2022/02/17
|13
|3686
|20
Report
AI Summary
This report presents a comprehensive financial analysis of Ocado Group Plc, evaluating its performance from 2016 to 2021. The study focuses on financial statement analysis, including profitability and liquidity ratios, to assess the company's financial health. Key performance indicators (KPIs) are examined to gauge operational efficiency and strategic progress. The analysis extends to competitor benchmarking, comparing Ocado Group Plc to Tesco and Sainsbury's. The report also delves into non-financial ratios, providing a holistic view of the company's performance. The findings reveal insights into revenue growth, profitability challenges, and liquidity management. The study concludes with recommendations for Ocado Group's medium-term financial strategies, considering the evolving socio-economic landscape and technological advancements within the online grocery market.
Accounting and Finance AAF044-6
Assignment one - Main
SAIMA SADIA SHEFA
STUDENT ID: 2016948
Assignment one - Main
SAIMA SADIA SHEFA
STUDENT ID: 2016948
Paraphrase This Document
Need a fresh take? Get an instant paraphrase of this document with our AI Paraphraser
1 | Accounting and Finance (AAF044-6) Assignment one - Main
Table of Contents
`
Introduction.................................................................................................................. 3
Company Overview........................................................................................................ 3
Profitability Ratios.......................................................................................................... 4
Liquidity ratios .............................................................................................................. 5
Key performance indicators ............................................................................................ 6
Non-financial ratios........................................................................................................ 7
Competitors Performance Analysis .................................................................................. 8
Share price analysis ..................................................................................................... 10
Conclusion and Recommendation.................................................................................. 11
Reference .................................................................................................................. 12
Abstract
The purpose of this study to outlines the financial statement analysis and
financial performance of the Ocado Group Plc for the use of equity valuation.
Standard profitability analysis is a combined, extended and is accompanied by
an analysis of growth to give an overall view of predicting equities' payoffs.
Therefore, financial statement analysis is presented initially as a pro forma study
of the future, with projected ratios viewed as the building blocks of payoffs
forecasts. The financial statement analysis hierarchy divides residual earnings
into financial statement drivers, which are then linked to the company's value-
generating activities.
The research finds that Ocado Group Plc has able to generate expanding
revenues thanks to varied divisions and a large market share, despite high
administrative costs and a longer operating cycle. The group faces further
challenges for the growing socio-economic diversity among residential
customers, the stable technological changes and the increasing demand for
sustainable structure.
Keywords: Key Financial Metrics; financial statement analysis; valuation; Ratio
Analysis
Introduction
This research is based on an analysis of Ocado Company's financial performance
and company’s corporate governance compliance by considering data of
previous five financial years. Financial and non-financial ratios will be examined
in the first stage of the study considering factors of profitability, liquidity, share
prices and key performance indicators. In addition, the second part of the study
evaluates the efficiency of the company's corporate governance policies and
makes recommendations for Ocado Group's medium-term financial strategies.
Overview of Ocado Group Plc
Ocado Group Plc is an online grocery solutions and logistics company established
in 2000 in UK that licences its technology to grocery merchants all over the
world. Ocado Group owns a 50 percent share in Ocado Retail, or Ocado.com, a
UK online grocer. The headquarter of the company is based in Hatfield, UK. It has
able to attract a huge number of customers due to its diverse product line, as its
present customer base is roughly over 800,000 across the United Kingdom.
The group transforming online grocery in the UK through joint venture with M&S,
combining Ocado Retail Limited with M&S branded food and product. It also can
be specified that Ocado sell its own brand groceries as well via Waitrose
supermarket.
The company's mission is to provide customers with the finest shopping
experience possible in a variety of ways, including the best price, quality, and
service terms, which aids in the development of a solid business foundation
(Ocado, 2014). It offers through Ocado.com hypermarket in the major three
specialties destination locations in addition to its shop operations.
2 | Accounting and Finance (AAF044-6) Assignment one - Main
⊘ This is a preview!⊘
Do you want full access?
Subscribe today to unlock all pages.
Trusted by 1+ million students worldwide
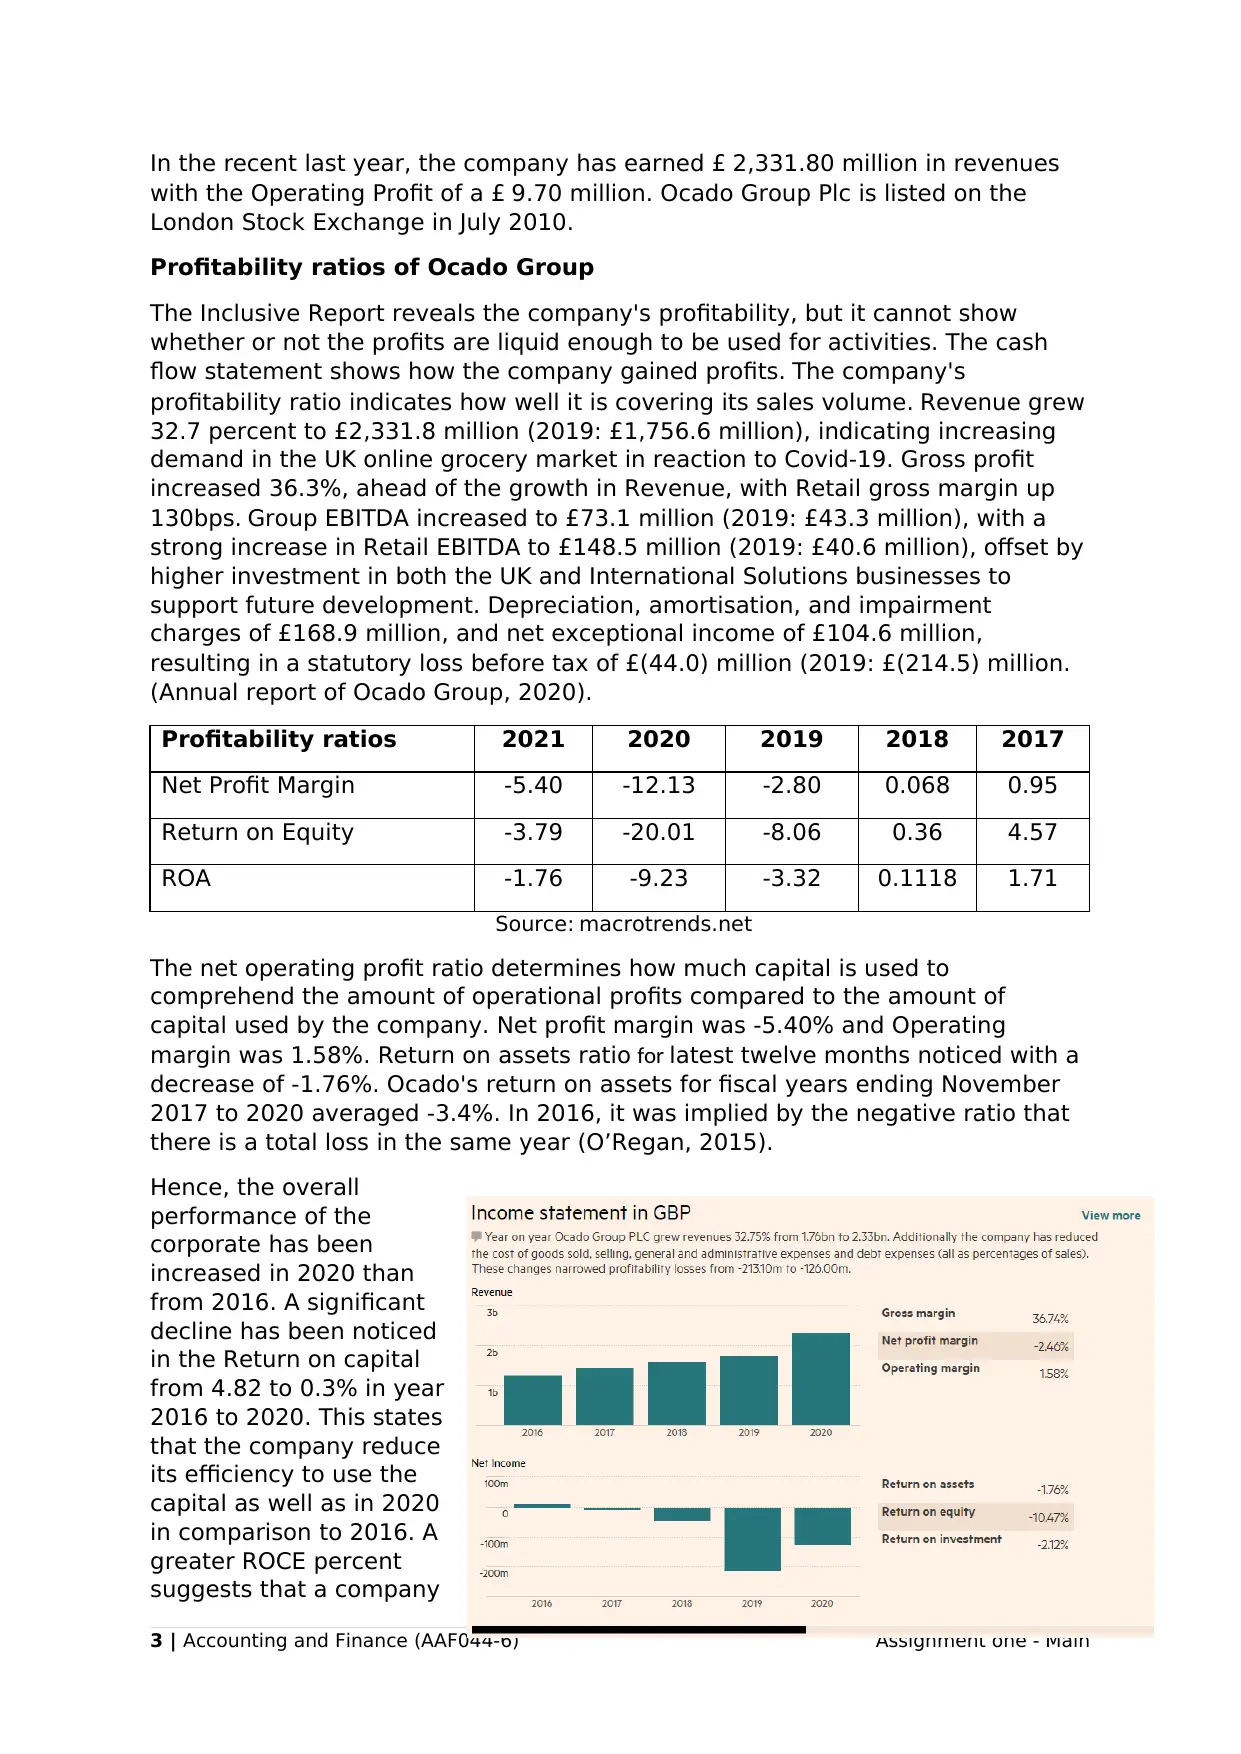
In the recent last year, the company has earned £ 2,331.80 million in revenues
with the Operating Profit of a £ 9.70 million. Ocado Group Plc is listed on the
London Stock Exchange in July 2010.
Profitability ratios of Ocado Group
The Inclusive Report reveals the company's profitability, but it cannot show
whether or not the profits are liquid enough to be used for activities. The cash
flow statement shows how the company gained profits. The company's
profitability ratio indicates how well it is covering its sales volume. Revenue grew
32.7 percent to £2,331.8 million (2019: £1,756.6 million), indicating increasing
demand in the UK online grocery market in reaction to Covid-19. Gross profit
increased 36.3%, ahead of the growth in Revenue, with Retail gross margin up
130bps. Group EBITDA increased to £73.1 million (2019: £43.3 million), with a
strong increase in Retail EBITDA to £148.5 million (2019: £40.6 million), offset by
higher investment in both the UK and International Solutions businesses to
support future development. Depreciation, amortisation, and impairment
charges of £168.9 million, and net exceptional income of £104.6 million,
resulting in a statutory loss before tax of £(44.0) million (2019: £(214.5) million.
(Annual report of Ocado Group, 2020).
Profitability ratios 2021 2020 2019 2018 2017
Net Profit Margin -5.40 -12.13 -2.80 0.068 0.95
Return on Equity -3.79 -20.01 -8.06 0.36 4.57
ROA -1.76 -9.23 -3.32 0.1118 1.71
Source: macrotrends.net
The net operating profit ratio determines how much capital is used to
comprehend the amount of operational profits compared to the amount of
capital used by the company. Net profit margin was -5.40% and Operating
margin was 1.58%. Return on assets ratio for latest twelve months noticed with a
decrease of -1.76%. Ocado's return on assets for fiscal years ending November
2017 to 2020 averaged -3.4%. In 2016, it was implied by the negative ratio that
there is a total loss in the same year (O’Regan, 2015).
Hence, the overall
performance of the
corporate has been
increased in 2020 than
from 2016. A significant
decline has been noticed
in the Return on capital
from 4.82 to 0.3% in year
2016 to 2020. This states
that the company reduce
its efficiency to use the
capital as well as in 2020
in comparison to 2016. A
greater ROCE percent
suggests that a company
3 | Accounting and Finance (AAF044-6) Assignment one - Main
Paraphrase This Document
Need a fresh take? Get an instant paraphrase of this document with our AI Paraphraser
is more profitable. Moreover, it is critical to consider the ratio in the long run.
Source: ft.com
Investors prefer companies with a consistent and rising ROCE percent trend
versus those with an unpredictable tendency. Group’s current performance on:
Return On Equity (ROE): -7.14, Net Debt:484.20, Net Working Capital:1,887.70,
Net Tangible Asset Value PS :202.81.
Liquidity ratios of Ocado Group
Liquidity ratios demonstrate a company's capacity to meet its obligations without
trouble. Investors, suppliers, and employees all benefit from liquidity ratios. The
current ratio is one of the most important liquidity ratios. It determines how
much current assets can be cashed to satisfy the obligation if the company
defaults (Ocado, 2014)
Liquidity(Financial
Health)
2021 2020 2019 2018 2017
Current Ratio 4.0 4.82 2.75 2.20 1.37
Quick Ratio 3.86 4.69 2.66 2.08 1.26
Debt/Equity Ratio 1.26 1.19 1.69 1.17 2.40
Source: macrotrends.net
It can be observed from the above table that the current ratio in 2021 is 4.0 and
in the remaining most years the ratio is below the ideal ratio which is 2:1. In year
2020 the current ratio is 4.82 and rest of years it remains below 2.75 therefore,
the company was not performing reasonably well in past years though the
sudden jump & quick fall doesn’t show any stability. In addition, company was
not having enough current assets to pay the liabilities. The quick ratio of the
company in 2021 is 3.86 while in 2020 it was 4.69.
4 | Accounting and Finance (AAF044-6) Assignment one - Main
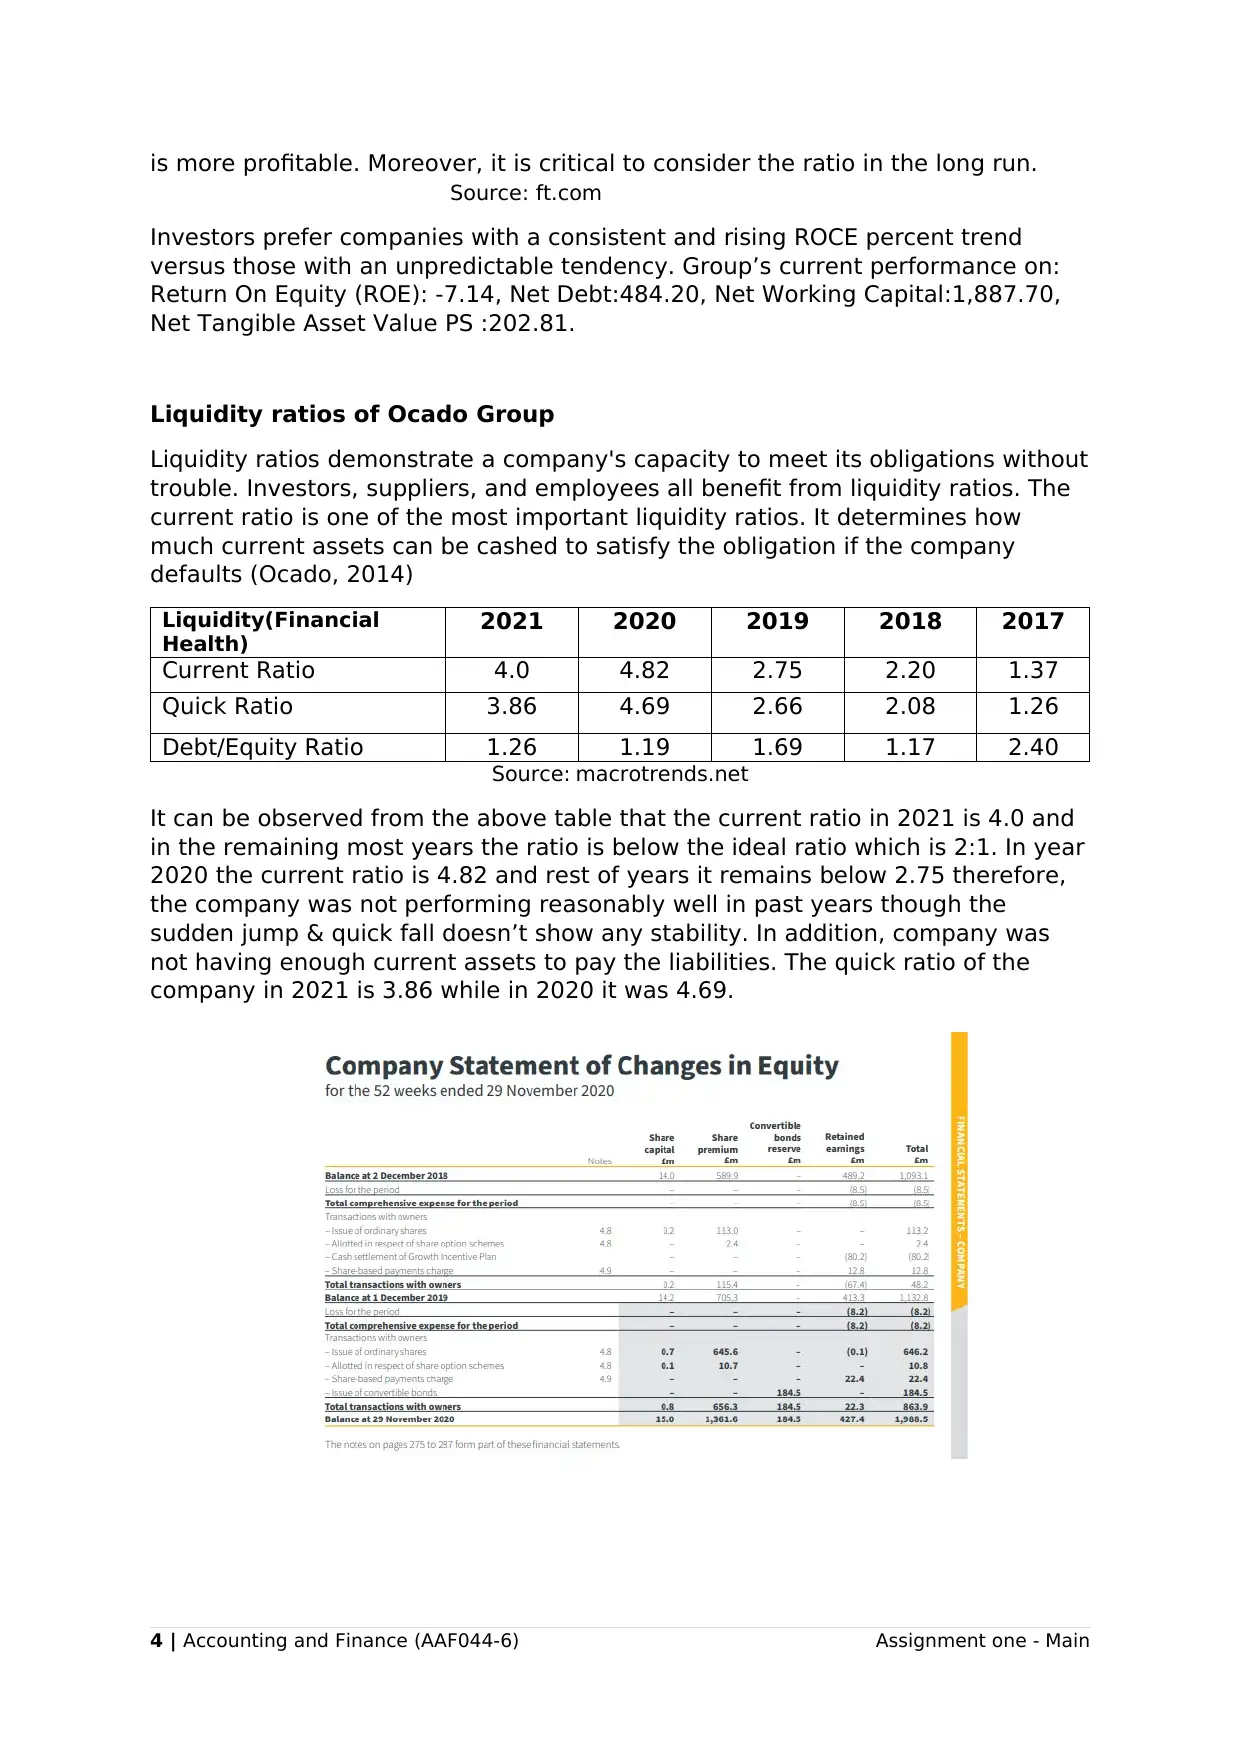
Source: Annual Report 2020
The Company has adequate cash resources to manage the short-term working
capital needs of the business. In December 2019, it issued £600.0million of
senior unsecured convertible bonds. In June 2020, it issued another £350.0
million of senior unsecured convertible bonds, alongside £657.1 million of
ordinary shares. The £100.0 million revolving credit facility was terminated in
October 2020; it was not utilised in the current or prior period. The Company’s
capital management policies are consistent with those of the Group. (Annual
report of Ocado Group, 2020). It determines how quickly the assets can be
converted into cash to pay back the obligations of the company (Chen, Chou and
Huang, 2016). Further, debt-equity ratio and ROA of the company has been
stabilised over the years. This constancy demonstrates the appropriate
management of debt; it can be said that company has covered its outstanding
expenses and liabilities. By considering liquidity ratios of company, it can be
seen that the company's overall working capital management has been
improved.
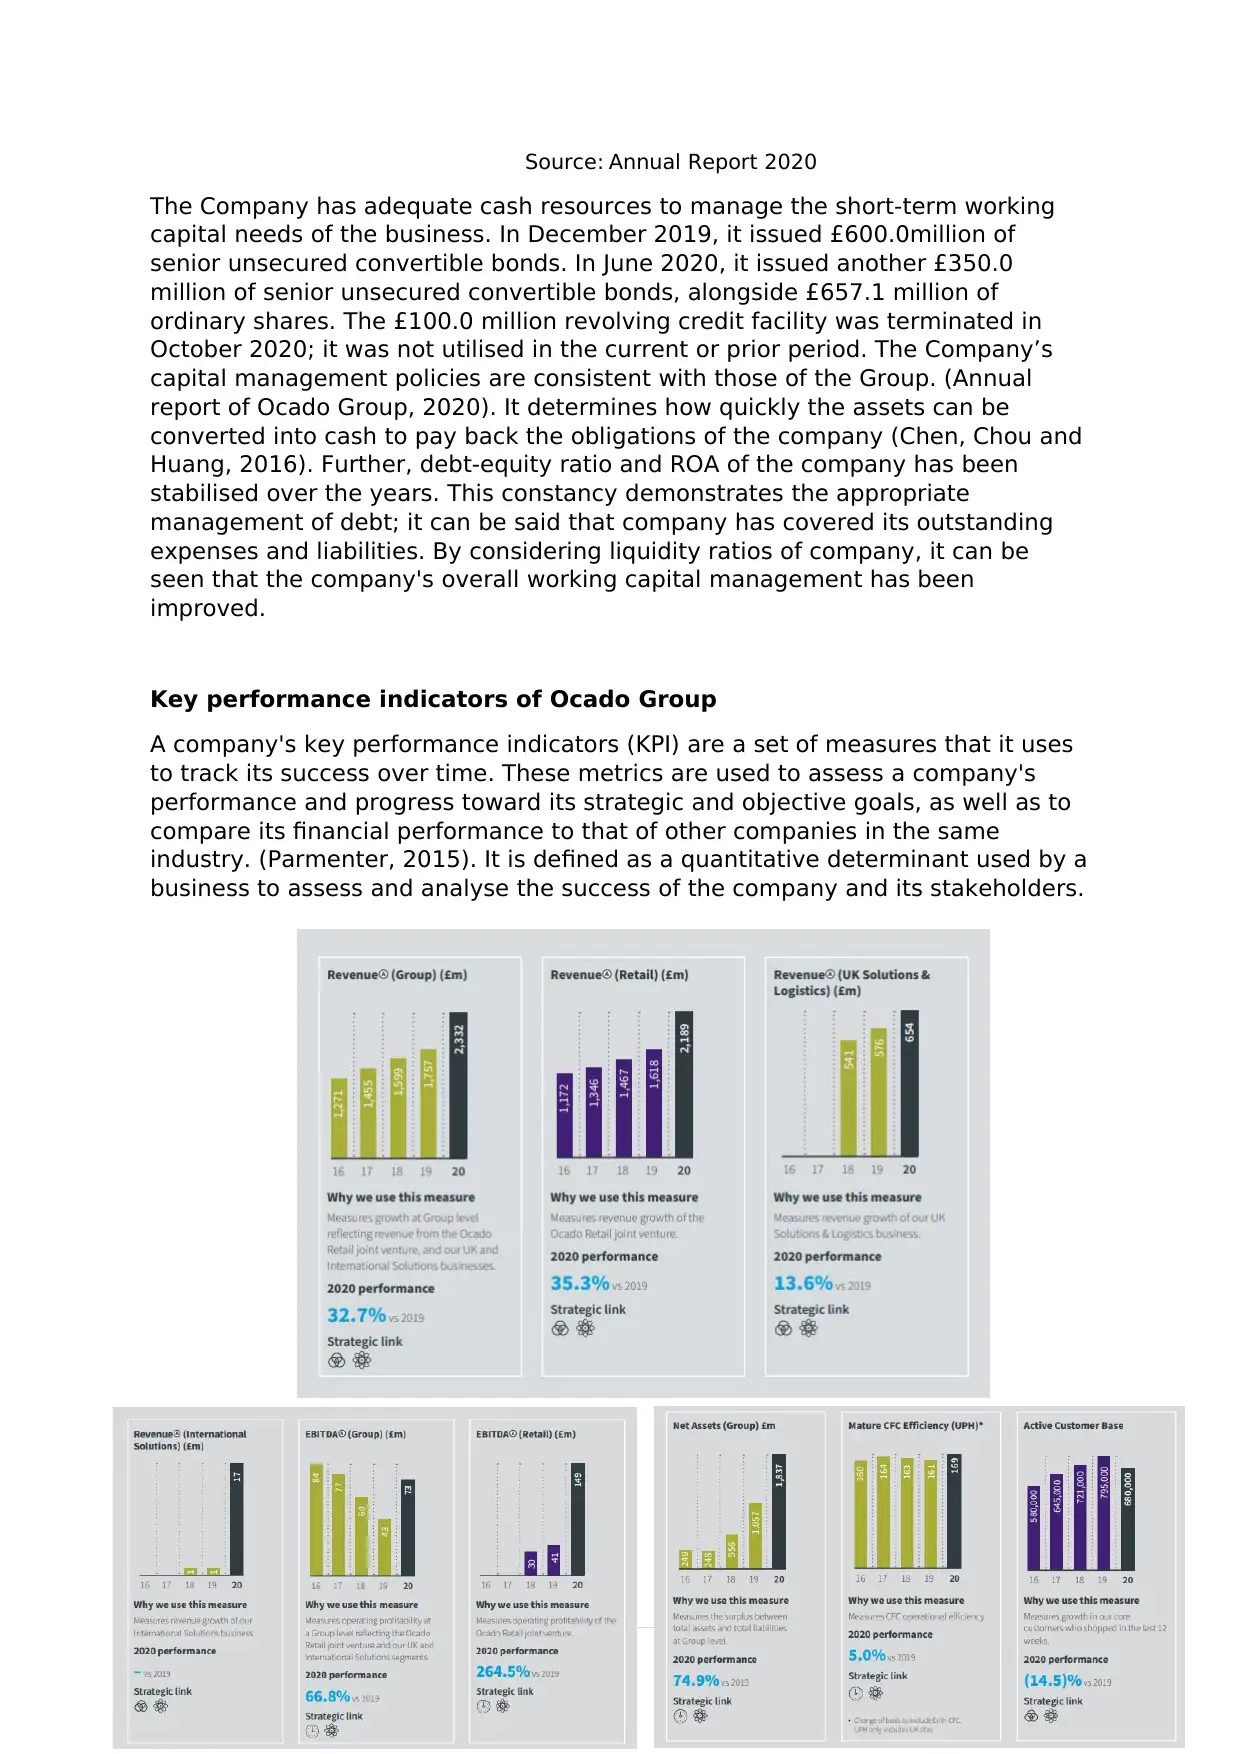
Key performance indicators of Ocado Group
A company's key performance indicators (KPI) are a set of measures that it uses
to track its success over time. These metrics are used to assess a company's
performance and progress toward its strategic and objective goals, as well as to
compare its financial performance to that of other companies in the same
industry. (Parmenter, 2015). It is defined as a quantitative determinant used by a
business to assess and analyse the success of the company and its stakeholders.
5 | Accounting and Finance (AAF044-6) Assignment one - Main
The Company has adequate cash resources to manage the short-term working
capital needs of the business. In December 2019, it issued £600.0million of
senior unsecured convertible bonds. In June 2020, it issued another £350.0
million of senior unsecured convertible bonds, alongside £657.1 million of
ordinary shares. The £100.0 million revolving credit facility was terminated in
October 2020; it was not utilised in the current or prior period. The Company’s
capital management policies are consistent with those of the Group. (Annual
report of Ocado Group, 2020). It determines how quickly the assets can be
converted into cash to pay back the obligations of the company (Chen, Chou and
Huang, 2016). Further, debt-equity ratio and ROA of the company has been
stabilised over the years. This constancy demonstrates the appropriate
management of debt; it can be said that company has covered its outstanding
expenses and liabilities. By considering liquidity ratios of company, it can be
seen that the company's overall working capital management has been
improved.
Key performance indicators of Ocado Group
A company's key performance indicators (KPI) are a set of measures that it uses
to track its success over time. These metrics are used to assess a company's
performance and progress toward its strategic and objective goals, as well as to
compare its financial performance to that of other companies in the same
industry. (Parmenter, 2015). It is defined as a quantitative determinant used by a
business to assess and analyse the success of the company and its stakeholders.
5 | Accounting and Finance (AAF044-6) Assignment one - Main
⊘ This is a preview!⊘
Do you want full access?
Subscribe today to unlock all pages.
Trusted by 1+ million students worldwide
Source: Annual Report 2020
• Revenue grew 32.7 percent to £2,331.8 million (2019: £1,756.6 million),
indicating increasing demand in the UK online grocery market in reaction to
Covid-19.
• Gross profit increased 36.3 percent, outpacing revenue growth, with Retail
gross margin improved 130bps mainly due to changes in the product mix.
• Group EBITDA A of £73.1 million (2019: £43.3 million), boosted by a large
increase in Retail EBITDA A of £148.5 million (2019: £40.6 million), offset by
higher investment in the UK and International Solutions businesses to support
future development.
• Statutory loss before tax of £(44.0) million (2019: £(214.5) million, including
£168.9 million in depreciation, amortisation, and impairment charges, and
£104.6 million in net exceptional income, mostly owing to insurance income for
the Andover CFC.
• Company's balance sheet was strong at the end of the year, with cash and
other financial assets of £2.1 billion, Following the £600 million convertible bond
issue in December 2019 and the £1 billion convertible bond and share placement
in June 2020.
• To speed up the commercial delivery of robotic solutions, the Group has
completed the purchase of two top robotics enterprises Kindred Systems and
Haddington Dynamics Inc in the United States for $260 million, as well as raising
a total of £1.6 billion in capital markets to fund future expansion. This supports
its potential to seize the structural growth prospects in global online grocery
uptake at a rapid pace. (Annual report of Ocado Group, 2020).
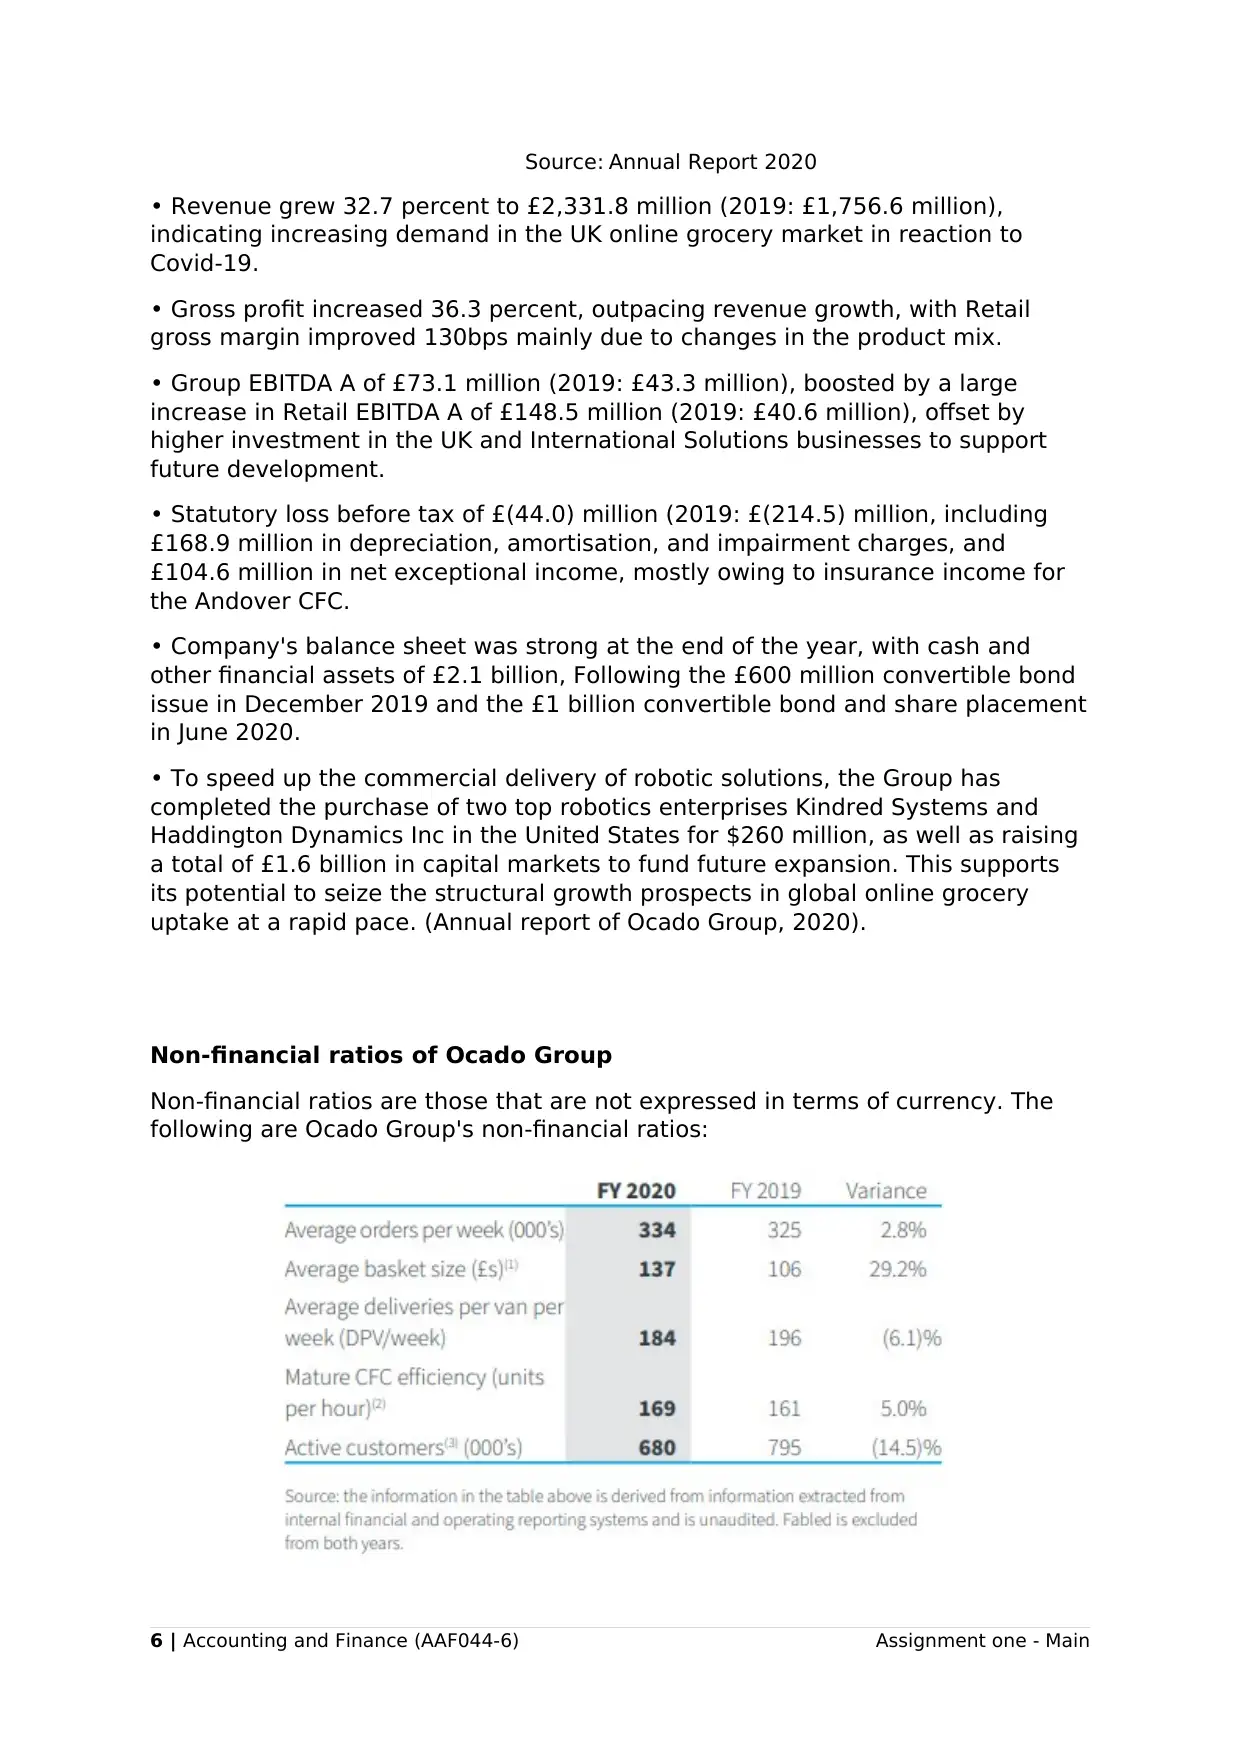
Non-financial ratios of Ocado Group
Non-financial ratios are those that are not expressed in terms of currency. The
following are Ocado Group's non-financial ratios:
6 | Accounting and Finance (AAF044-6) Assignment one - Main
• Revenue grew 32.7 percent to £2,331.8 million (2019: £1,756.6 million),
indicating increasing demand in the UK online grocery market in reaction to
Covid-19.
• Gross profit increased 36.3 percent, outpacing revenue growth, with Retail
gross margin improved 130bps mainly due to changes in the product mix.
• Group EBITDA A of £73.1 million (2019: £43.3 million), boosted by a large
increase in Retail EBITDA A of £148.5 million (2019: £40.6 million), offset by
higher investment in the UK and International Solutions businesses to support
future development.
• Statutory loss before tax of £(44.0) million (2019: £(214.5) million, including
£168.9 million in depreciation, amortisation, and impairment charges, and
£104.6 million in net exceptional income, mostly owing to insurance income for
the Andover CFC.
• Company's balance sheet was strong at the end of the year, with cash and
other financial assets of £2.1 billion, Following the £600 million convertible bond
issue in December 2019 and the £1 billion convertible bond and share placement
in June 2020.
• To speed up the commercial delivery of robotic solutions, the Group has
completed the purchase of two top robotics enterprises Kindred Systems and
Haddington Dynamics Inc in the United States for $260 million, as well as raising
a total of £1.6 billion in capital markets to fund future expansion. This supports
its potential to seize the structural growth prospects in global online grocery
uptake at a rapid pace. (Annual report of Ocado Group, 2020).
Non-financial ratios of Ocado Group
Non-financial ratios are those that are not expressed in terms of currency. The
following are Ocado Group's non-financial ratios:
6 | Accounting and Finance (AAF044-6) Assignment one - Main
Paraphrase This Document
Need a fresh take? Get an instant paraphrase of this document with our AI Paraphraser
As it can be seen average orders per week is increased by 2.8 percent, followed
by average basket size gone up to 29.2percent and active customers also
increased by a significant number in recent years.
Competitors Performance Analysis of Ocado Group plc:
A competitor benchmarking is essential for an effective financial analysis in order
to estimate and comment on the company's performance. Financial ratios will be
the tool that will be useful in measuring overall performance in this scenario. It
will be compared to the Tesco & Sainsbury's, which belongs to the same industry
and is nearly the same size.
1. Profitability ratios Analysis:
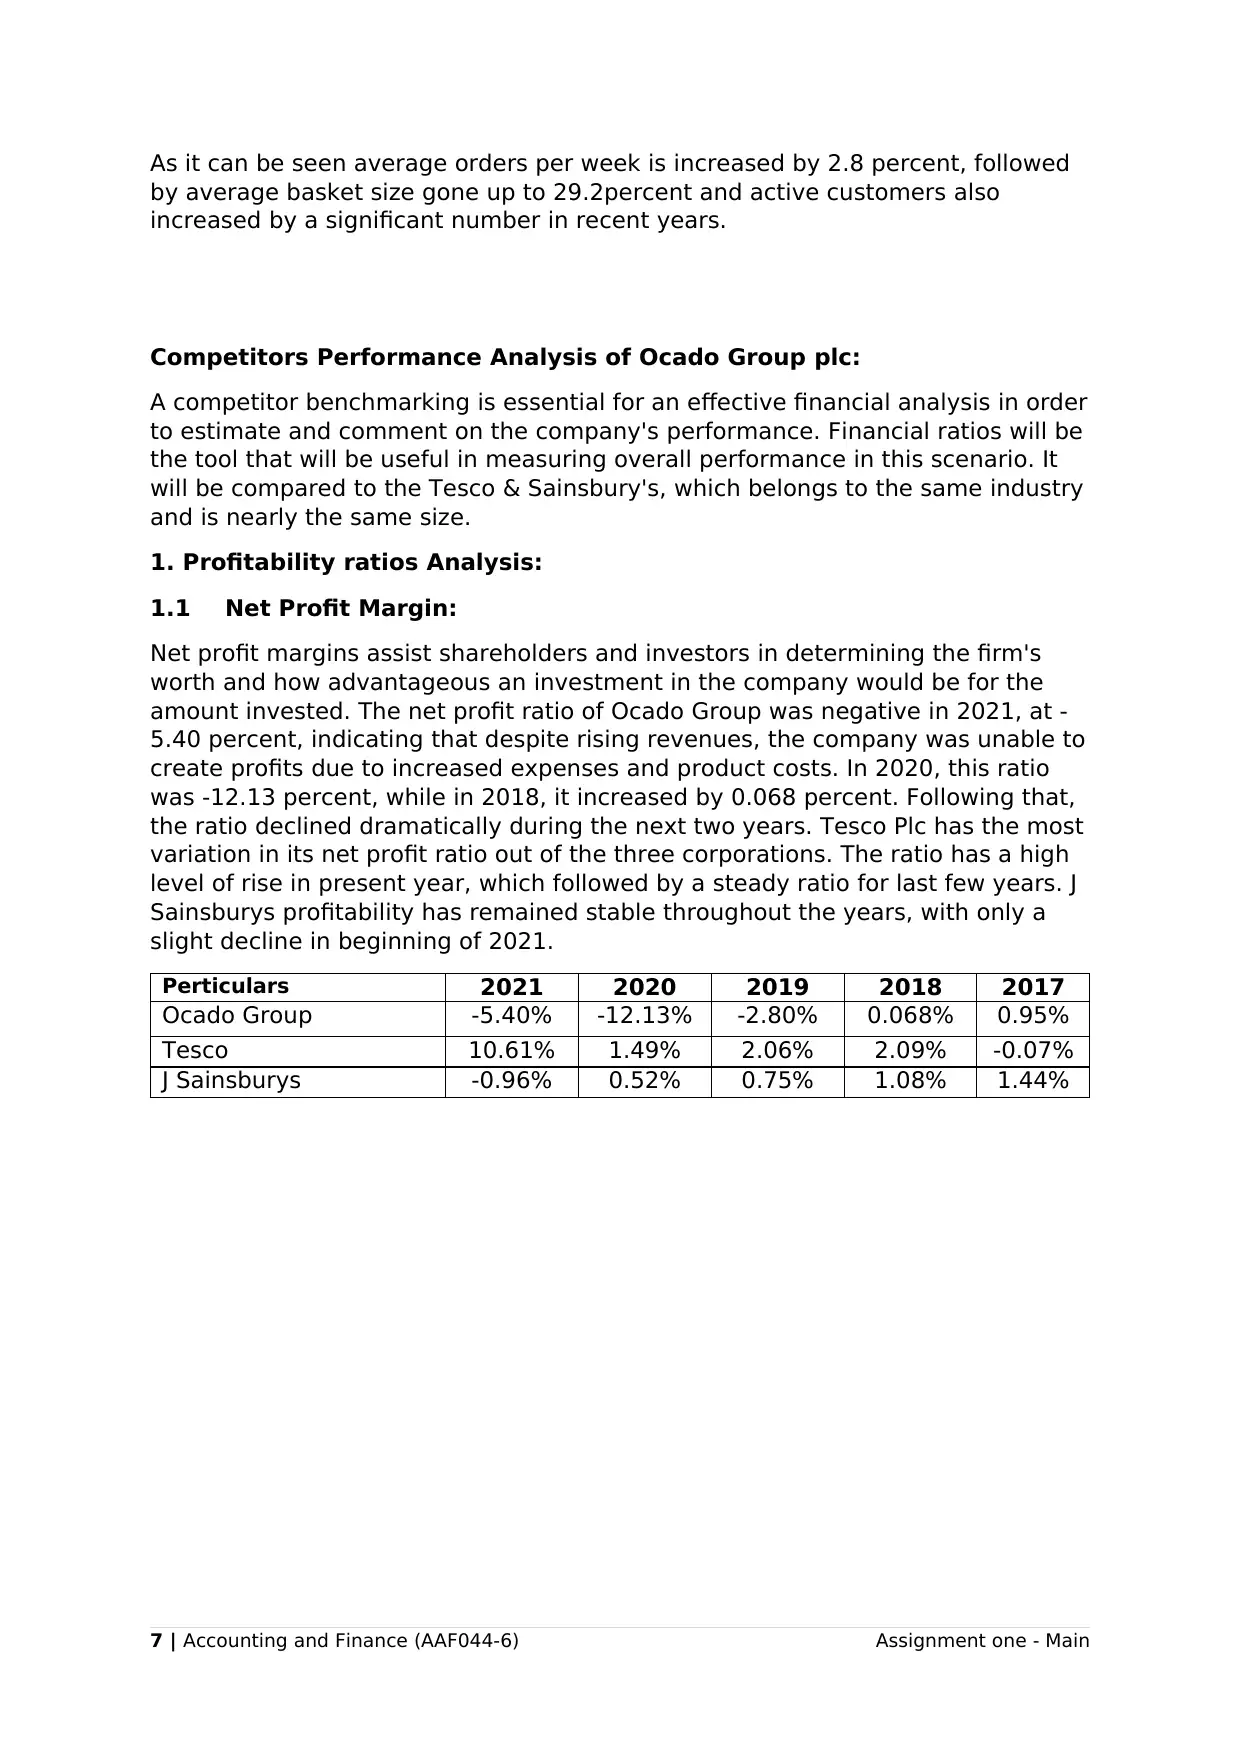
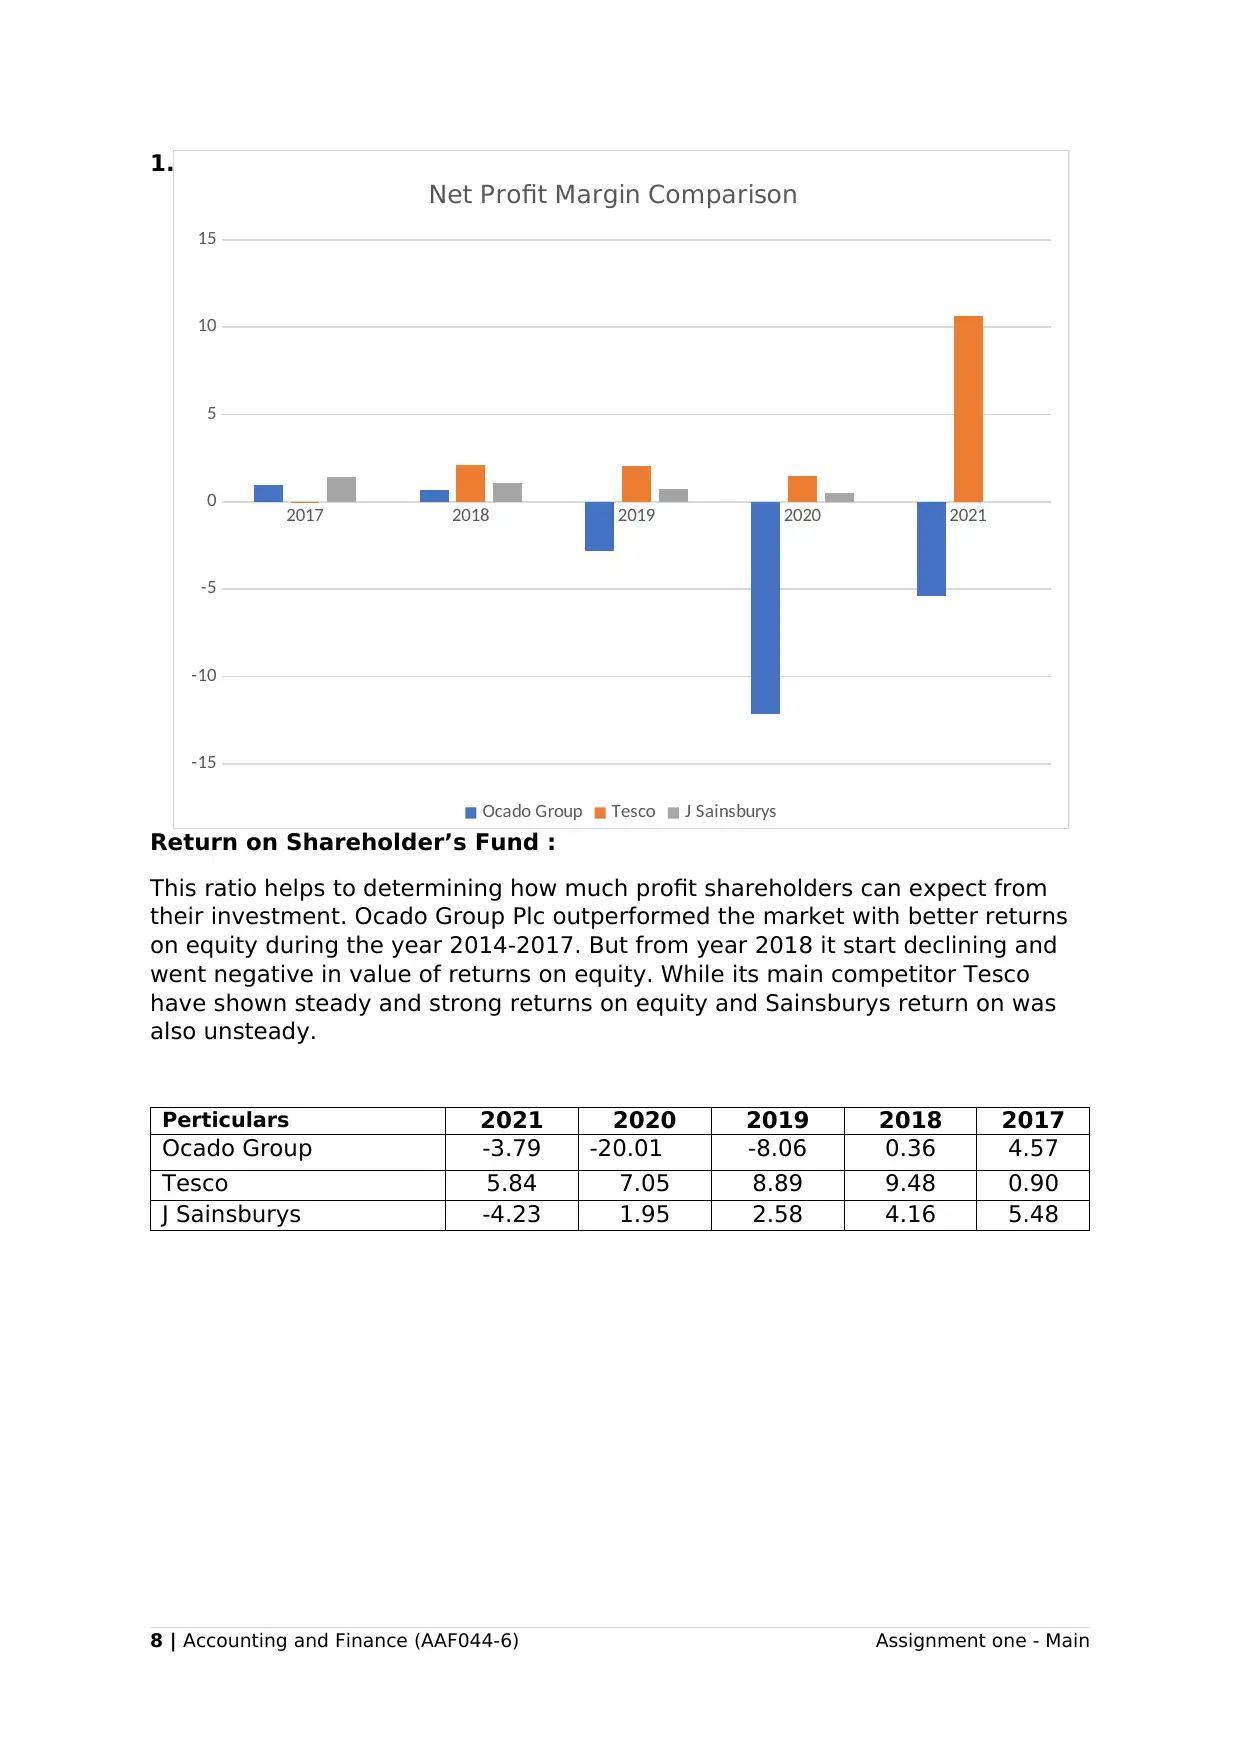
1.1 Net Profit Margin:
Net profit margins assist shareholders and investors in determining the firm's
worth and how advantageous an investment in the company would be for the
amount invested. The net profit ratio of Ocado Group was negative in 2021, at -
5.40 percent, indicating that despite rising revenues, the company was unable to
create profits due to increased expenses and product costs. In 2020, this ratio
was -12.13 percent, while in 2018, it increased by 0.068 percent. Following that,
the ratio declined dramatically during the next two years. Tesco Plc has the most
variation in its net profit ratio out of the three corporations. The ratio has a high
level of rise in present year, which followed by a steady ratio for last few years. J
Sainsburys profitability has remained stable throughout the years, with only a
slight decline in beginning of 2021.
Perticulars 2021 2020 2019 2018 2017
Ocado Group -5.40% -12.13% -2.80% 0.068% 0.95%
Tesco 10.61% 1.49% 2.06% 2.09% -0.07%
J Sainsburys -0.96% 0.52% 0.75% 1.08% 1.44%
7 | Accounting and Finance (AAF044-6) Assignment one - Main
by average basket size gone up to 29.2percent and active customers also
increased by a significant number in recent years.
Competitors Performance Analysis of Ocado Group plc:
A competitor benchmarking is essential for an effective financial analysis in order
to estimate and comment on the company's performance. Financial ratios will be
the tool that will be useful in measuring overall performance in this scenario. It
will be compared to the Tesco & Sainsbury's, which belongs to the same industry
and is nearly the same size.
1. Profitability ratios Analysis:
1.1 Net Profit Margin:
Net profit margins assist shareholders and investors in determining the firm's
worth and how advantageous an investment in the company would be for the
amount invested. The net profit ratio of Ocado Group was negative in 2021, at -
5.40 percent, indicating that despite rising revenues, the company was unable to
create profits due to increased expenses and product costs. In 2020, this ratio
was -12.13 percent, while in 2018, it increased by 0.068 percent. Following that,
the ratio declined dramatically during the next two years. Tesco Plc has the most
variation in its net profit ratio out of the three corporations. The ratio has a high
level of rise in present year, which followed by a steady ratio for last few years. J
Sainsburys profitability has remained stable throughout the years, with only a
slight decline in beginning of 2021.
Perticulars 2021 2020 2019 2018 2017
Ocado Group -5.40% -12.13% -2.80% 0.068% 0.95%
Tesco 10.61% 1.49% 2.06% 2.09% -0.07%
J Sainsburys -0.96% 0.52% 0.75% 1.08% 1.44%
7 | Accounting and Finance (AAF044-6) Assignment one - Main
1.2
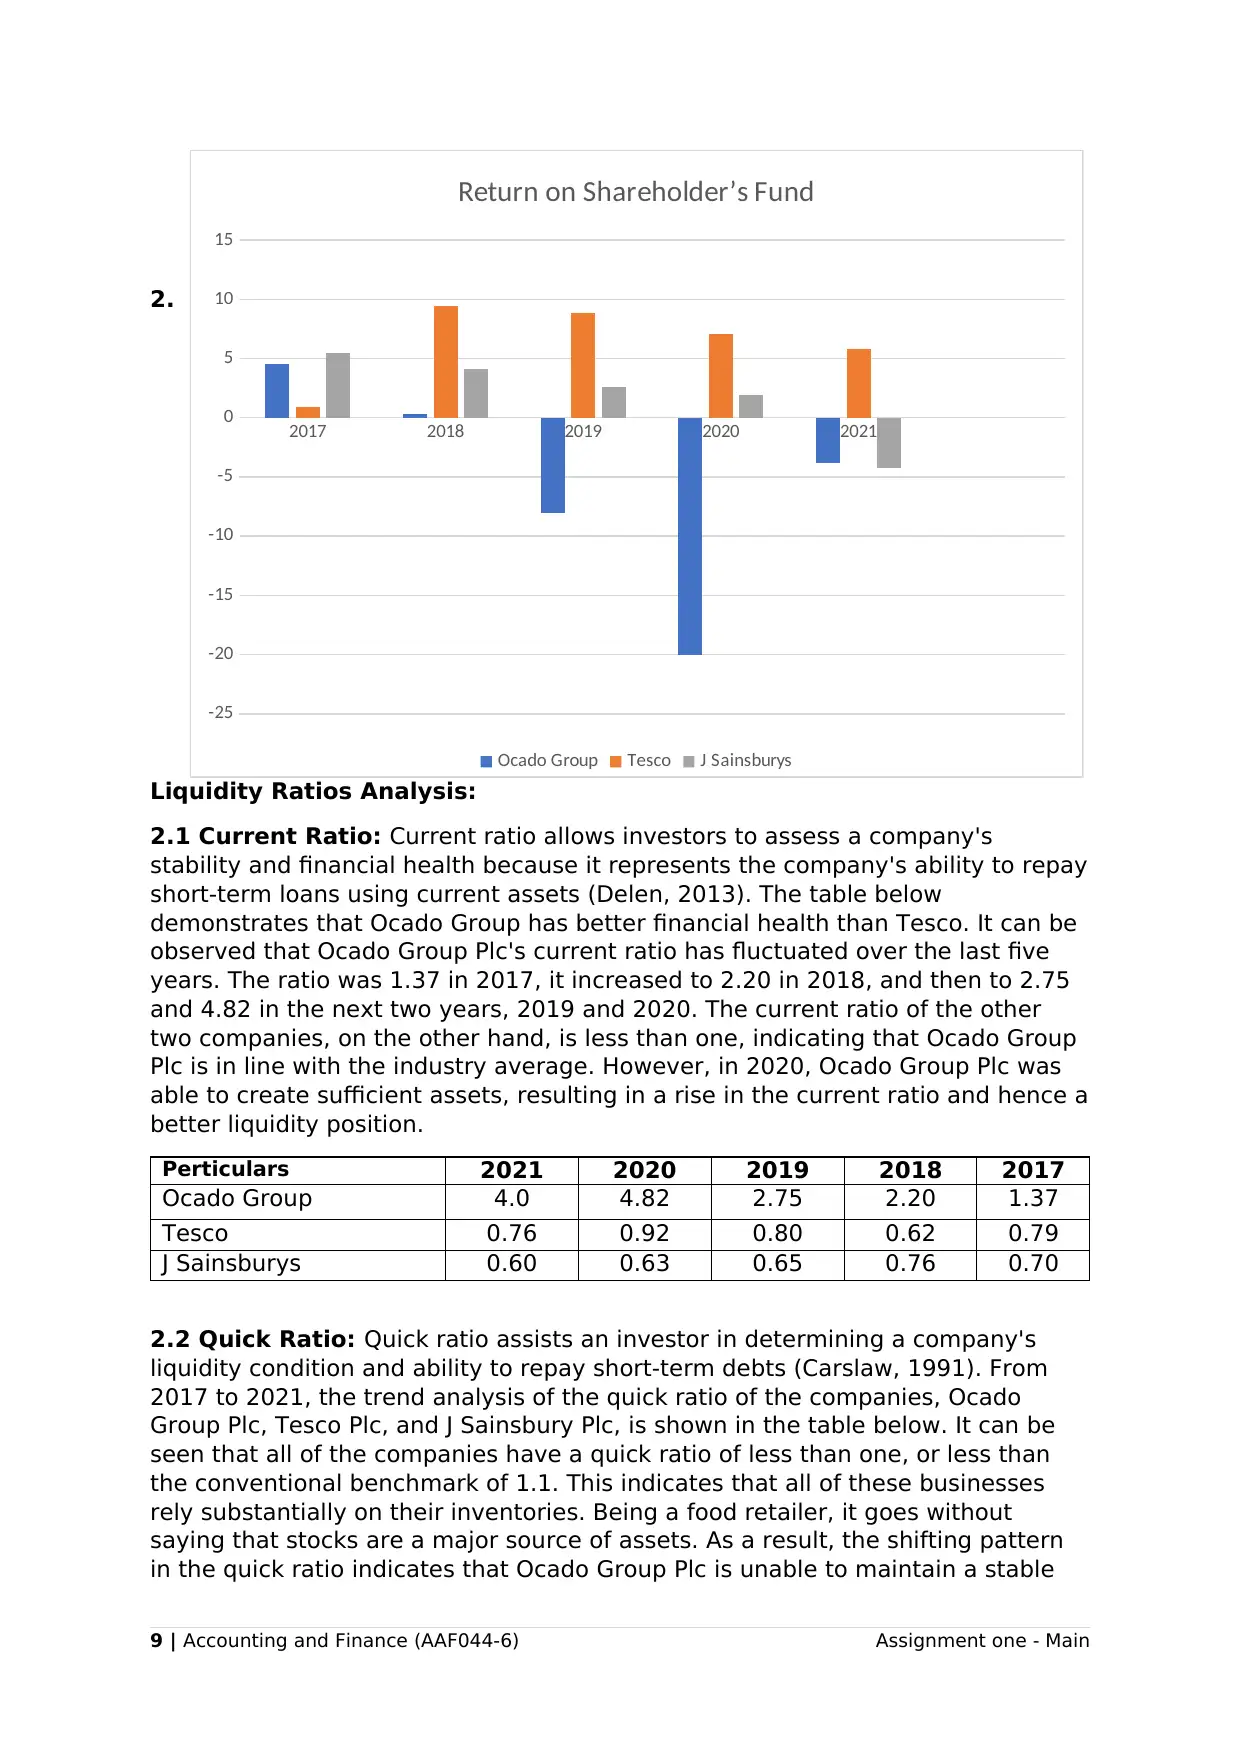
Return on Shareholder’s Fund :
This ratio helps to determining how much profit shareholders can expect from
their investment. Ocado Group Plc outperformed the market with better returns
on equity during the year 2014-2017. But from year 2018 it start declining and
went negative in value of returns on equity. While its main competitor Tesco
have shown steady and strong returns on equity and Sainsburys return on was
also unsteady.
Perticulars 2021 2020 2019 2018 2017
Ocado Group -3.79 -20.01 -8.06 0.36 4.57
Tesco 5.84 7.05 8.89 9.48 0.90
J Sainsburys -4.23 1.95 2.58 4.16 5.48
8 | Accounting and Finance (AAF044-6) Assignment one - Main
2017 2018 2019 2020 2021
-15
-10
-5
0
5
10
15
Net Profit Margin Comparison
Ocado Group Tesco J Sainsburys
⊘ This is a preview!⊘
Do you want full access?
Subscribe today to unlock all pages.
Trusted by 1+ million students worldwide
2.
Liquidity Ratios Analysis:
2.1 Current Ratio: Current ratio allows investors to assess a company's
stability and financial health because it represents the company's ability to repay
short-term loans using current assets (Delen, 2013). The table below
demonstrates that Ocado Group has better financial health than Tesco. It can be
observed that Ocado Group Plc's current ratio has fluctuated over the last five
years. The ratio was 1.37 in 2017, it increased to 2.20 in 2018, and then to 2.75
and 4.82 in the next two years, 2019 and 2020. The current ratio of the other
two companies, on the other hand, is less than one, indicating that Ocado Group
Plc is in line with the industry average. However, in 2020, Ocado Group Plc was
able to create sufficient assets, resulting in a rise in the current ratio and hence a
better liquidity position.
Perticulars 2021 2020 2019 2018 2017
Ocado Group 4.0 4.82 2.75 2.20 1.37
Tesco 0.76 0.92 0.80 0.62 0.79
J Sainsburys 0.60 0.63 0.65 0.76 0.70
2.2 Quick Ratio: Quick ratio assists an investor in determining a company's
liquidity condition and ability to repay short-term debts (Carslaw, 1991). From
2017 to 2021, the trend analysis of the quick ratio of the companies, Ocado
Group Plc, Tesco Plc, and J Sainsbury Plc, is shown in the table below. It can be
seen that all of the companies have a quick ratio of less than one, or less than
the conventional benchmark of 1.1. This indicates that all of these businesses
rely substantially on their inventories. Being a food retailer, it goes without
saying that stocks are a major source of assets. As a result, the shifting pattern
in the quick ratio indicates that Ocado Group Plc is unable to maintain a stable
9 | Accounting and Finance (AAF044-6) Assignment one - Main
2017 2018 2019 2020 2021
-25
-20
-15
-10
-5
0
5
10
15
Return on Shareholder’s Fund
Ocado Group Tesco J Sainsburys
Paraphrase This Document
Need a fresh take? Get an instant paraphrase of this document with our AI Paraphraser
liquidity position in terms of inventory operations. While J Sainsbury has done
well throughout the years and has maintained an upward trend. Tesco Plc has
also attempted to maintain consistency in its quick ratio throughout the year, but
it appears that 2017 was not a good year for all companies.
Company Name 2021 2020 2019 2018 2017
Ocado Group 3.86 4.69 2.66 2.08 1.26
Tesco 0.62 0.80 0.66 0.49 0.68
J Sainsburys 0.47 0.49 0.50 0.59 0.51
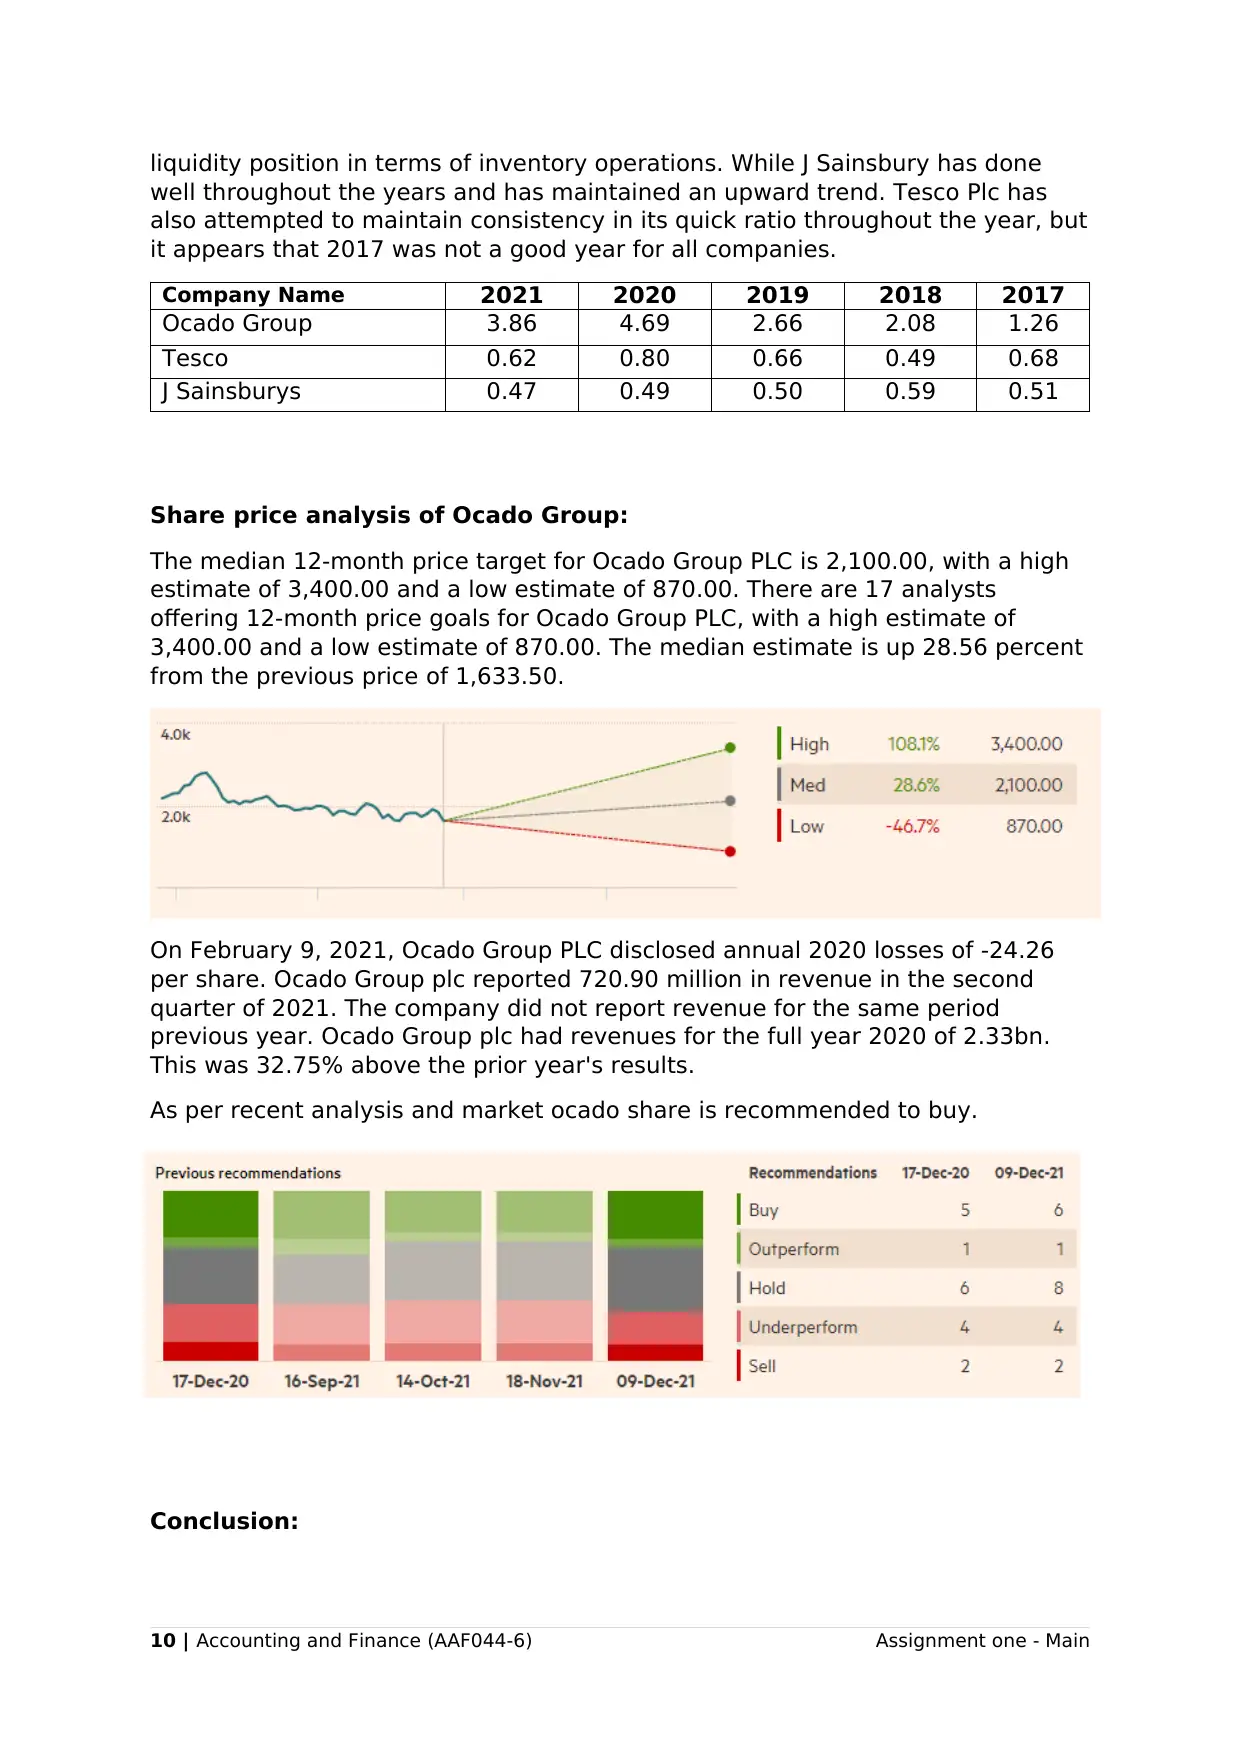
Share price analysis of Ocado Group:
The median 12-month price target for Ocado Group PLC is 2,100.00, with a high
estimate of 3,400.00 and a low estimate of 870.00. There are 17 analysts
offering 12-month price goals for Ocado Group PLC, with a high estimate of
3,400.00 and a low estimate of 870.00. The median estimate is up 28.56 percent
from the previous price of 1,633.50.
On February 9, 2021, Ocado Group PLC disclosed annual 2020 losses of -24.26
per share. Ocado Group plc reported 720.90 million in revenue in the second
quarter of 2021. The company did not report revenue for the same period
previous year. Ocado Group plc had revenues for the full year 2020 of 2.33bn.
This was 32.75% above the prior year's results.
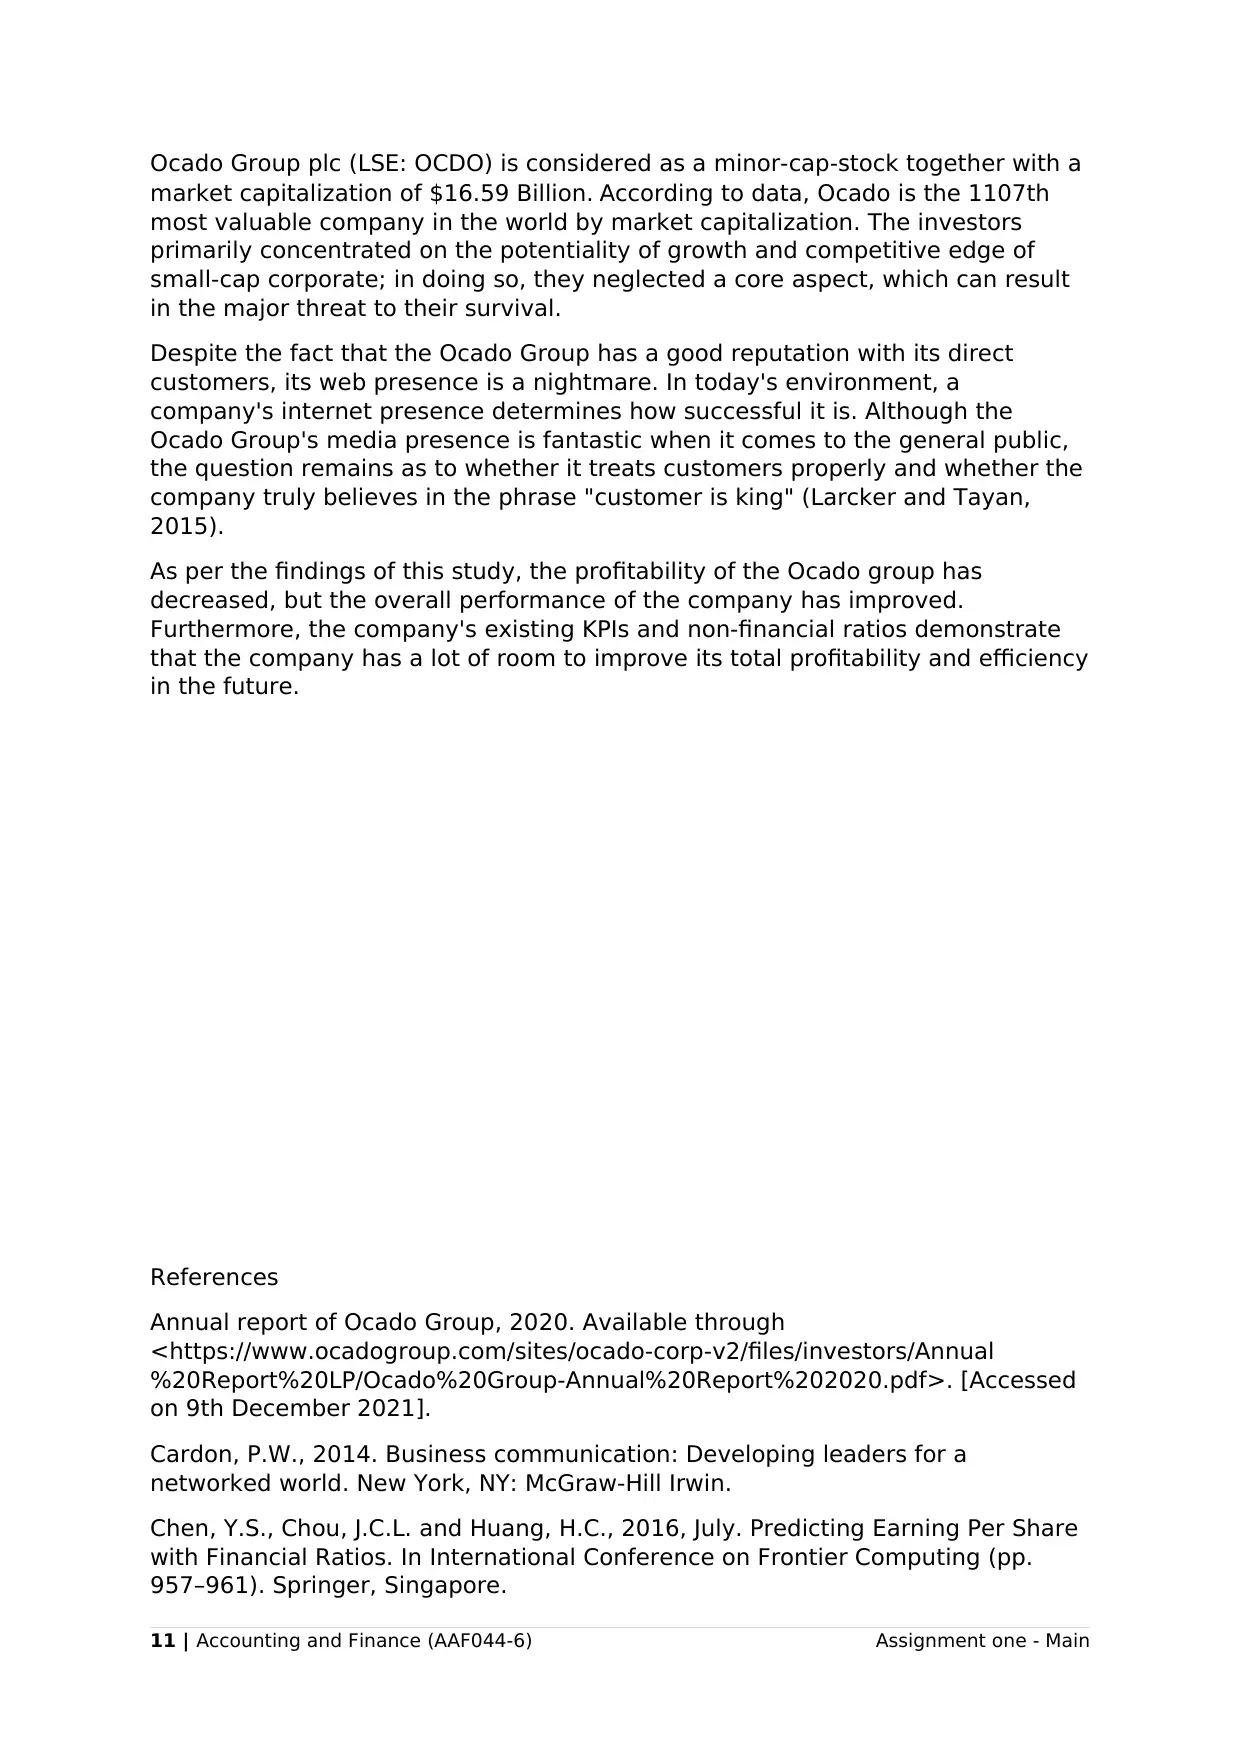
As per recent analysis and market ocado share is recommended to buy.
Conclusion:
10 | Accounting and Finance (AAF044-6) Assignment one - Main
well throughout the years and has maintained an upward trend. Tesco Plc has
also attempted to maintain consistency in its quick ratio throughout the year, but
it appears that 2017 was not a good year for all companies.
Company Name 2021 2020 2019 2018 2017
Ocado Group 3.86 4.69 2.66 2.08 1.26
Tesco 0.62 0.80 0.66 0.49 0.68
J Sainsburys 0.47 0.49 0.50 0.59 0.51
Share price analysis of Ocado Group:
The median 12-month price target for Ocado Group PLC is 2,100.00, with a high
estimate of 3,400.00 and a low estimate of 870.00. There are 17 analysts
offering 12-month price goals for Ocado Group PLC, with a high estimate of
3,400.00 and a low estimate of 870.00. The median estimate is up 28.56 percent
from the previous price of 1,633.50.
On February 9, 2021, Ocado Group PLC disclosed annual 2020 losses of -24.26
per share. Ocado Group plc reported 720.90 million in revenue in the second
quarter of 2021. The company did not report revenue for the same period
previous year. Ocado Group plc had revenues for the full year 2020 of 2.33bn.
This was 32.75% above the prior year's results.
As per recent analysis and market ocado share is recommended to buy.
Conclusion:
10 | Accounting and Finance (AAF044-6) Assignment one - Main
Ocado Group plc (LSE: OCDO) is considered as a minor-cap-stock together with a
market capitalization of $16.59 Billion. According to data, Ocado is the 1107th
most valuable company in the world by market capitalization. The investors
primarily concentrated on the potentiality of growth and competitive edge of
small-cap corporate; in doing so, they neglected a core aspect, which can result
in the major threat to their survival.
Despite the fact that the Ocado Group has a good reputation with its direct
customers, its web presence is a nightmare. In today's environment, a
company's internet presence determines how successful it is. Although the
Ocado Group's media presence is fantastic when it comes to the general public,
the question remains as to whether it treats customers properly and whether the
company truly believes in the phrase "customer is king" (Larcker and Tayan,
2015).
As per the findings of this study, the profitability of the Ocado group has
decreased, but the overall performance of the company has improved.
Furthermore, the company's existing KPIs and non-financial ratios demonstrate
that the company has a lot of room to improve its total profitability and efficiency
in the future.
References
Annual report of Ocado Group, 2020. Available through
<https://www.ocadogroup.com/sites/ocado-corp-v2/files/investors/Annual
%20Report%20LP/Ocado%20Group-Annual%20Report%202020.pdf>. [Accessed
on 9th December 2021].
Cardon, P.W., 2014. Business communication: Developing leaders for a
networked world. New York, NY: McGraw-Hill Irwin.
Chen, Y.S., Chou, J.C.L. and Huang, H.C., 2016, July. Predicting Earning Per Share
with Financial Ratios. In International Conference on Frontier Computing (pp.
957–961). Springer, Singapore.
11 | Accounting and Finance (AAF044-6) Assignment one - Main
⊘ This is a preview!⊘
Do you want full access?
Subscribe today to unlock all pages.
Trusted by 1+ million students worldwide
1 out of 13
Related Documents


![Financial Decision Making Report: Tesco PLC Analysis, [Semester]](/_next/image/?url=https%3A%2F%2Fdesklib.com%2Fmedia%2Fimages%2Fhr%2F4d8ba67960c740769ebe4af06e7a847d.jpg&w=256&q=75)


Your All-in-One AI-Powered Toolkit for Academic Success.
+13062052269
info@desklib.com
Available 24*7 on WhatsApp / Email
![[object Object]](/_next/static/media/star-bottom.7253800d.svg)
Unlock your academic potential
Copyright © 2020–2026 A2Z Services. All Rights Reserved. Developed and managed by ZUCOL.