MOD007667 Finance Report: Ocado Group Financial Analysis
VerifiedAdded on 2022/02/04
|22
|4875
|40
Report
AI Summary
This report provides a comprehensive financial analysis of the Ocado Group, a technology-led retail company, focusing on the impact of the COVID-19 pandemic. It begins with a detailed ratio analysis, examining profitability, efficiency, liquidity, and gearing ratios over a five-year period, with graphical representations and comparisons to competitor Tesco Plc. The report then explores the uses and drawbacks of preparing budgets, including financial planning approaches and the role of performance management in decision-making. Finally, it delves into investment appraisal methods, specifically Net Present Value (NPV) and Internal Rate of Return (IRR), considering risk and uncertainty in the context of a £50 million investment in new product development. The report concludes with a summary of findings and recommendations for the company's financial strategy.
Name of Module:
MOD007667 Finance for Decision Making
SID Number:
Title of Your Course and Year/Stage: Final Submission Date:
Actual word count: Extension Granted to (if any):
Checklist before submission
1. Have you read, understood and acted in accordance with the referencing guidelines set
out in the Harvard Reference Guide?
2. Where you have quoted directly from or where you have paraphrased the work of others,
have you acknowledged and appropriately referenced the source of your quotation in the
body of the text?
3. Have you placed all direct quotations in inverted commas?
4. Have you listed and correctly presented all your sources in the reference list?
Declaration by the candidate
1. I declare that this assignment is my own work (or, in the case of a group assignment, the
work of my group), that it has not been copied from elsewhere and that any extracts from
books, papers or other sources have been properly acknowledged as references or
quotations.
2. The work contains no material drawn from unattributed sources.
Please tick the box to confirm acceptance of the above declaration.
Date ________________________
Signature ________________________
Paraphrase This Document
Need a fresh take? Get an instant paraphrase of this document with our AI Paraphraser
Table of Contents
1. Introduction..................................................................................................................................3
2. Financial Overview of Ocado Group Using Ratios.....................................................................3
2.1 Comparison With Competitor (Tesco Plc.)...........................................................................7
2.2 Ratio Analysis Limitations....................................................................................................8
3. Uses and Drawbacks of Preparing Budgets.................................................................................9
3.1 Financial Planning Approaches...........................................................................................10
3.2 Role of Performance Management (PM) in Decision Making............................................11
4. Investment Appraisal Methods..................................................................................................11
4.1 NPV (Net Present Value).....................................................................................................12
4.2 IRR (Internal Rate of Return)..............................................................................................13
4.3 Risk and Uncertainty Involvement......................................................................................14
5. Conclusion.................................................................................................................................14
Reference.......................................................................................................................................16
Appendix........................................................................................................................................20
Figure 1: Operating Profit Margin Ocado Group; Source: Self-made............................................5
Figure 2: Asset Turnover Ratio Ocado Group; Source: Self-made.................................................6
Figure 3: Current Ratio Ocado Group; Source: Self-made.............................................................7
Figure 4: Debt Ratio Ocado Group; Source: Self-made..................................................................8
Figure 5: Competitor Analysis; Ocado Group Vs Tesco Plc Year 2020; Source: Self-made.........9
Figure 6: Top Companies in the UK in Online Food & Beverage Segment; Source: Statista
(2020).............................................................................................................................................21
Figure 7: NPV Formula; Source: Self-made.................................................................................22
Figure 8: IRR Formula; Source: Self-made...................................................................................22
Table 1: Financial Overview of Ocado Group With Ratio Analysis; Source: Self-made...............5
Table 2: NPV Calculation; Source: Self-made..............................................................................14
Table 3: IRR Calculation; Source: Self-made...............................................................................15
⊘ This is a preview!⊘
Do you want full access?
Subscribe today to unlock all pages.
Trusted by 1+ million students worldwide
1. Introduction
The global economy faces major challenges in terms of Covid-19. The majority of companies are
seriously impacted because they are unable to cope with the sudden fluctuations in demand and
supply. Ocado group is also working hard to address Covid-19's challenges. It is a technology
company headquartered in the United Kingdom that offers creative and exclusive end-to-end
online grocery solutions to customers all over the world (Ocado, 2021). If the COVID-19
pandemic progresses, there has never been a more urgent need for companies to reconsider and
realign their operations to adapt to a changing environment. According to Meyer, Prescott and
Sheng (2021), now is the time for companies to concentrate their attention on supporting key
aspects of their operations that will help them survive in the new world and plan for the future.
This report uses ratios analysis to present the financial analysis of the selected tech-
led retail company. Also, the comparison of its ratios with one of its competitors (Tesco Plc.) is
presented for the year 2020. Besides that, capital budgeting methods are used in investment
planning. Acting as the company's CFO, I will also assess the £50 million investment in new
product development following the Covid-19 pandemic. The first part of the report includes a
ratio analysis of the business. The significance of budgeting, as well as the benefits and
drawbacks of capital budgeting strategies, are discussed in the second section. The final part of
the report uses investment analysis methods to evaluate the available investment options.
2. Financial Overview of Ocado Group Using Ratios
Financial ratios are a useful analysis tool for gaining a better understanding of financial
outcomes and trends over time and recognising key measures of business performance. To attain
Paraphrase This Document
Need a fresh take? Get an instant paraphrase of this document with our AI Paraphraser
long-term business objectives, financial analysis, scheduling and management are necessary
(Lev, 2018). Table 1 shows a financial ratio overview of the Ocado group, with graphical
representations in Figures 1 to 4, which inform us about the company's financial progress over
the last five years.
Table 1: Financial Overview of Ocado Group With Ratio Analysis; Source: Self-made
Tesco
Plc
Categories Ratios Formulas 2020 2019 2018 2017 2016 2020
1. Profitability OPM OI/SR 0.0038 -0.1058 -0.0200 0.0037 0.0170 0.0150
2. Efficiency ATR NS/ATA 0.7377 0.9643 1.4247 1.8237 1.9672 1.1861
3. Liquidity CR CA/CL 4.8191 2.1925 1.7448 1.0113 0.5146 0.7343
4. Gearing DR TL/TA 0.5439 0.5389 0.5884 0.6974 0.6255 0.7466
Ratio Analysis
Ocado Group
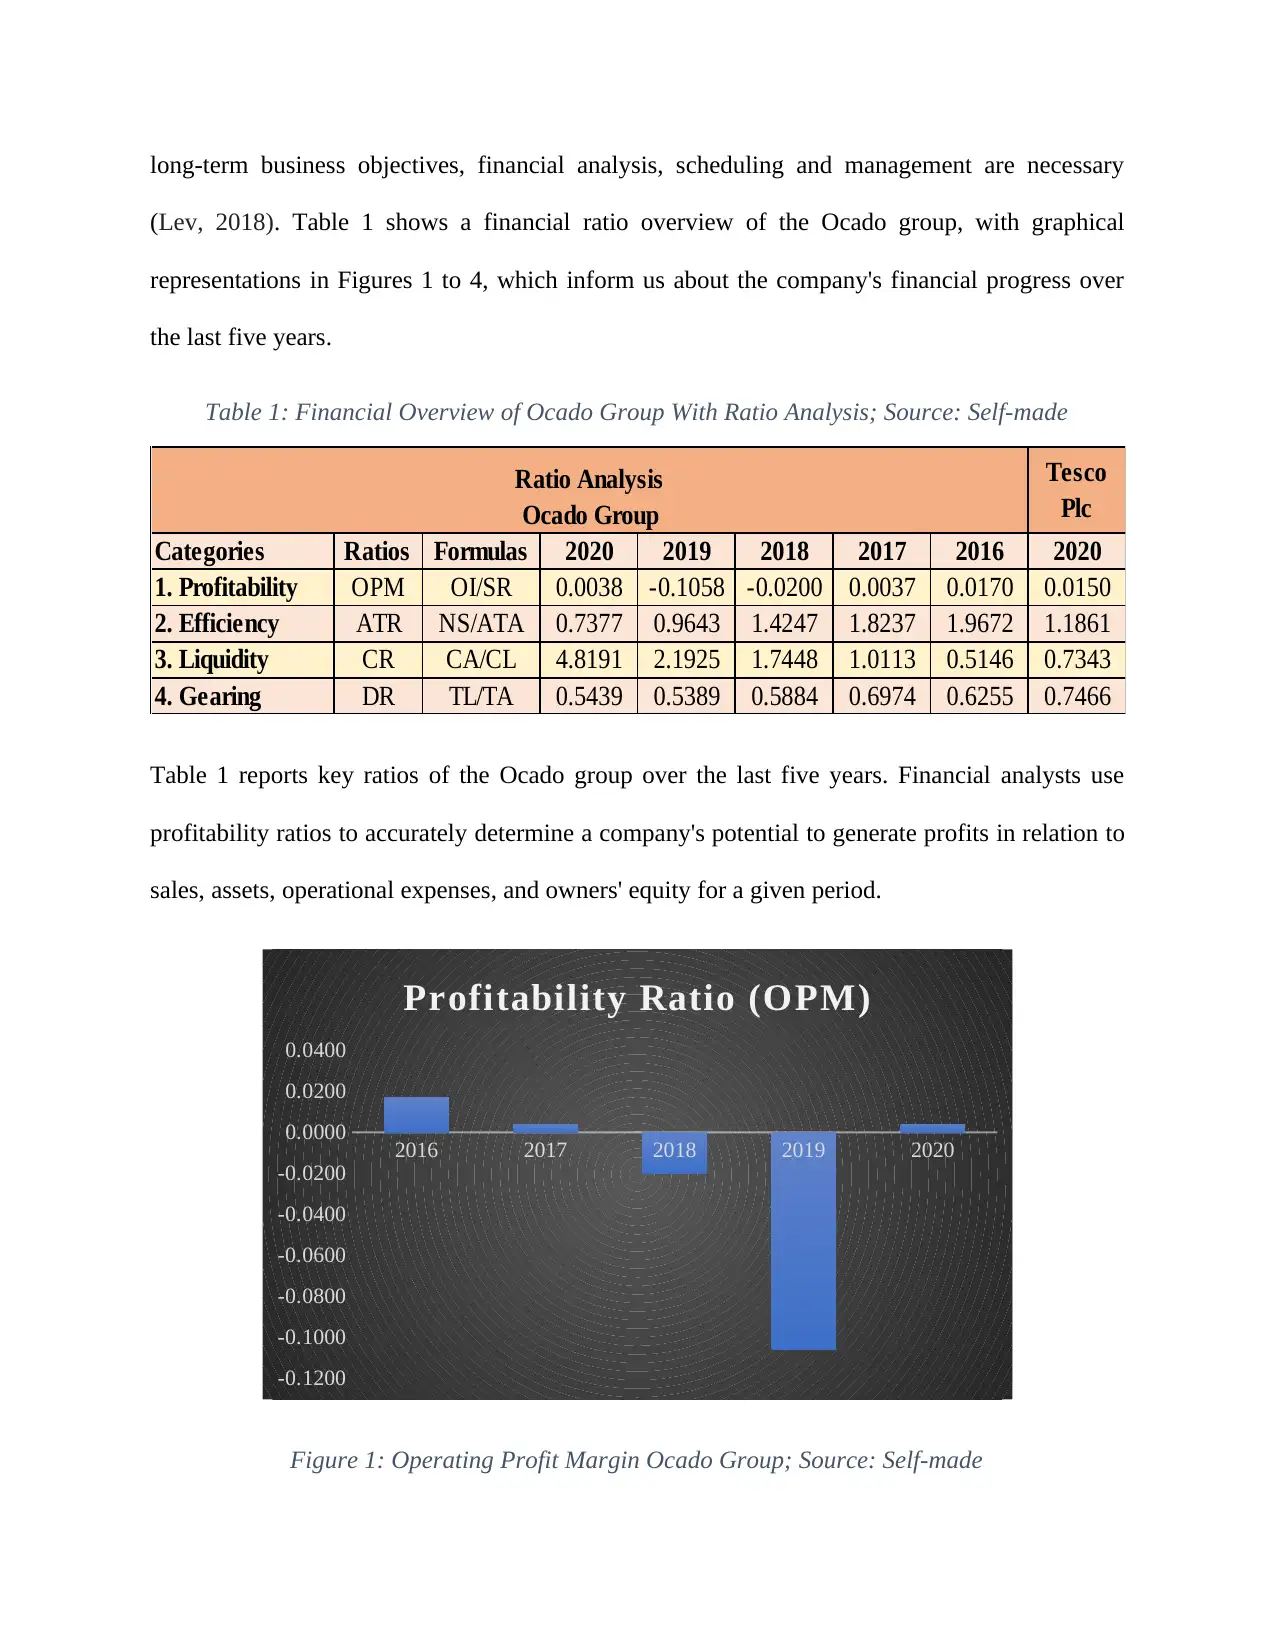
Table 1 reports key ratios of the Ocado group over the last five years. Financial analysts use
profitability ratios to accurately determine a company's potential to generate profits in relation to
sales, assets, operational expenses, and owners' equity for a given period.
2016 2017 2018 2019 2020
-0.1200
-0.1000
-0.0800
-0.0600
-0.0400
-0.0200
0.0000
0.0200
0.0400
Profitability Ratio (OPM)
Figure 1: Operating Profit Margin Ocado Group; Source: Self-made
(Lev, 2018). Table 1 shows a financial ratio overview of the Ocado group, with graphical
representations in Figures 1 to 4, which inform us about the company's financial progress over
the last five years.
Table 1: Financial Overview of Ocado Group With Ratio Analysis; Source: Self-made
Tesco
Plc
Categories Ratios Formulas 2020 2019 2018 2017 2016 2020
1. Profitability OPM OI/SR 0.0038 -0.1058 -0.0200 0.0037 0.0170 0.0150
2. Efficiency ATR NS/ATA 0.7377 0.9643 1.4247 1.8237 1.9672 1.1861
3. Liquidity CR CA/CL 4.8191 2.1925 1.7448 1.0113 0.5146 0.7343
4. Gearing DR TL/TA 0.5439 0.5389 0.5884 0.6974 0.6255 0.7466
Ratio Analysis
Ocado Group
Table 1 reports key ratios of the Ocado group over the last five years. Financial analysts use
profitability ratios to accurately determine a company's potential to generate profits in relation to
sales, assets, operational expenses, and owners' equity for a given period.
2016 2017 2018 2019 2020
-0.1200
-0.1000
-0.0800
-0.0600
-0.0400
-0.0200
0.0000
0.0200
0.0400
Profitability Ratio (OPM)
Figure 1: Operating Profit Margin Ocado Group; Source: Self-made
The profitability of the company is evaluated with the OPM ratio that estimates the company’s
profit obtained from its operations before the deduction of tax and interest payments (Rani,
Yadav and Jain, 2015). Figure 1 also graphically support the findings of the OPM ratio obtained
in Table 1. Findings indicate that the company’s profitability follows the decreasing trend from
the year 2016 to 2019 and even become negative in 2018 and 2019. It implies that the company’s
operations are not contributing towards achieving profits even before the pandemic period.
However, during the crisis period amid covid-19, the Ocado group performs significantly well as
the figure suggests that the profitability of the company turns positive again in the year 2020. It
means that the company has made necessary policy adjustments in its business strategy
considering the pandemic situation (Ding et al., 2021).
2016 2017 2018 2019 2020
0.0000
0.5000
1.0000
1.5000
2.0000
2.5000
Efficiency Ratio (ATR)
Figure 2: Asset Turnover Ratio Ocado Group; Source: Self-made
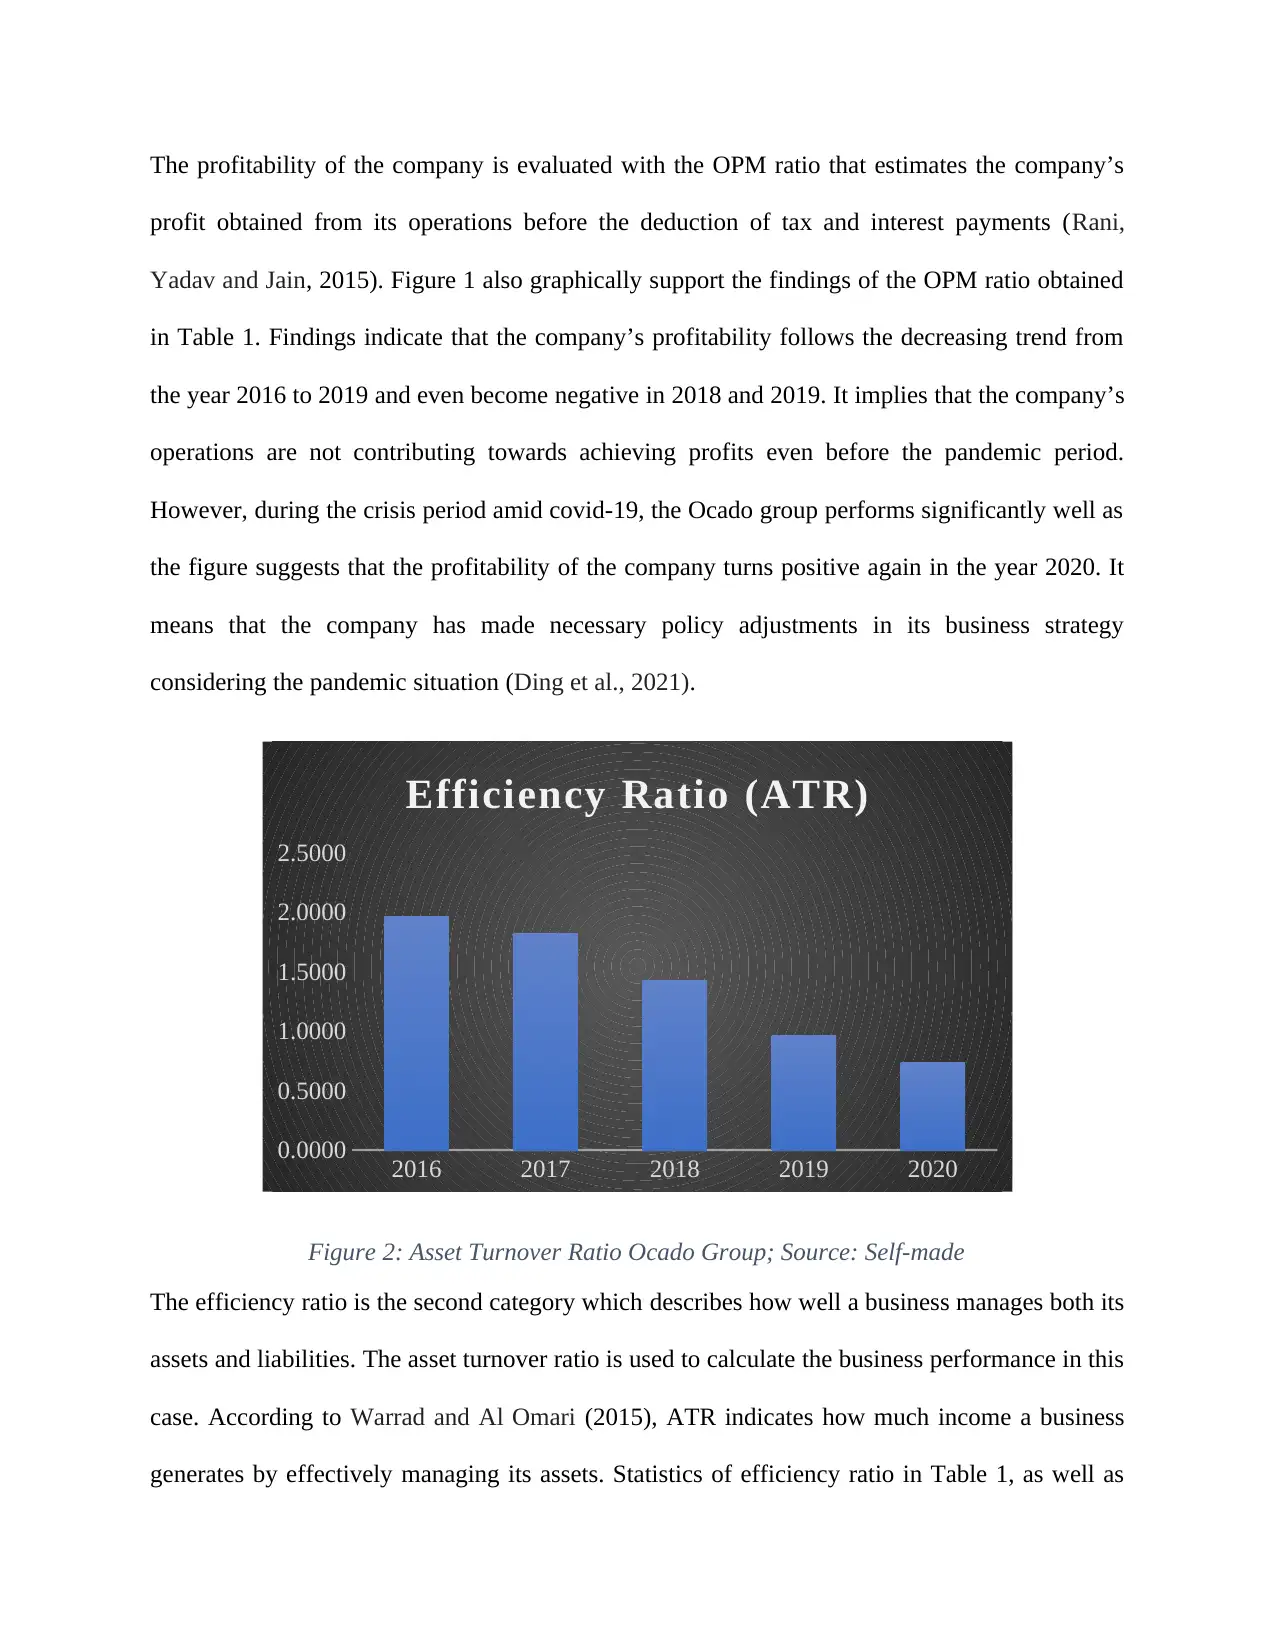
The efficiency ratio is the second category which describes how well a business manages both its
assets and liabilities. The asset turnover ratio is used to calculate the business performance in this
case. According to Warrad and Al Omari (2015), ATR indicates how much income a business
generates by effectively managing its assets. Statistics of efficiency ratio in Table 1, as well as
profit obtained from its operations before the deduction of tax and interest payments (Rani,
Yadav and Jain, 2015). Figure 1 also graphically support the findings of the OPM ratio obtained
in Table 1. Findings indicate that the company’s profitability follows the decreasing trend from
the year 2016 to 2019 and even become negative in 2018 and 2019. It implies that the company’s
operations are not contributing towards achieving profits even before the pandemic period.
However, during the crisis period amid covid-19, the Ocado group performs significantly well as
the figure suggests that the profitability of the company turns positive again in the year 2020. It
means that the company has made necessary policy adjustments in its business strategy
considering the pandemic situation (Ding et al., 2021).
2016 2017 2018 2019 2020
0.0000
0.5000
1.0000
1.5000
2.0000
2.5000
Efficiency Ratio (ATR)
Figure 2: Asset Turnover Ratio Ocado Group; Source: Self-made
The efficiency ratio is the second category which describes how well a business manages both its
assets and liabilities. The asset turnover ratio is used to calculate the business performance in this
case. According to Warrad and Al Omari (2015), ATR indicates how much income a business
generates by effectively managing its assets. Statistics of efficiency ratio in Table 1, as well as
⊘ This is a preview!⊘
Do you want full access?
Subscribe today to unlock all pages.
Trusted by 1+ million students worldwide
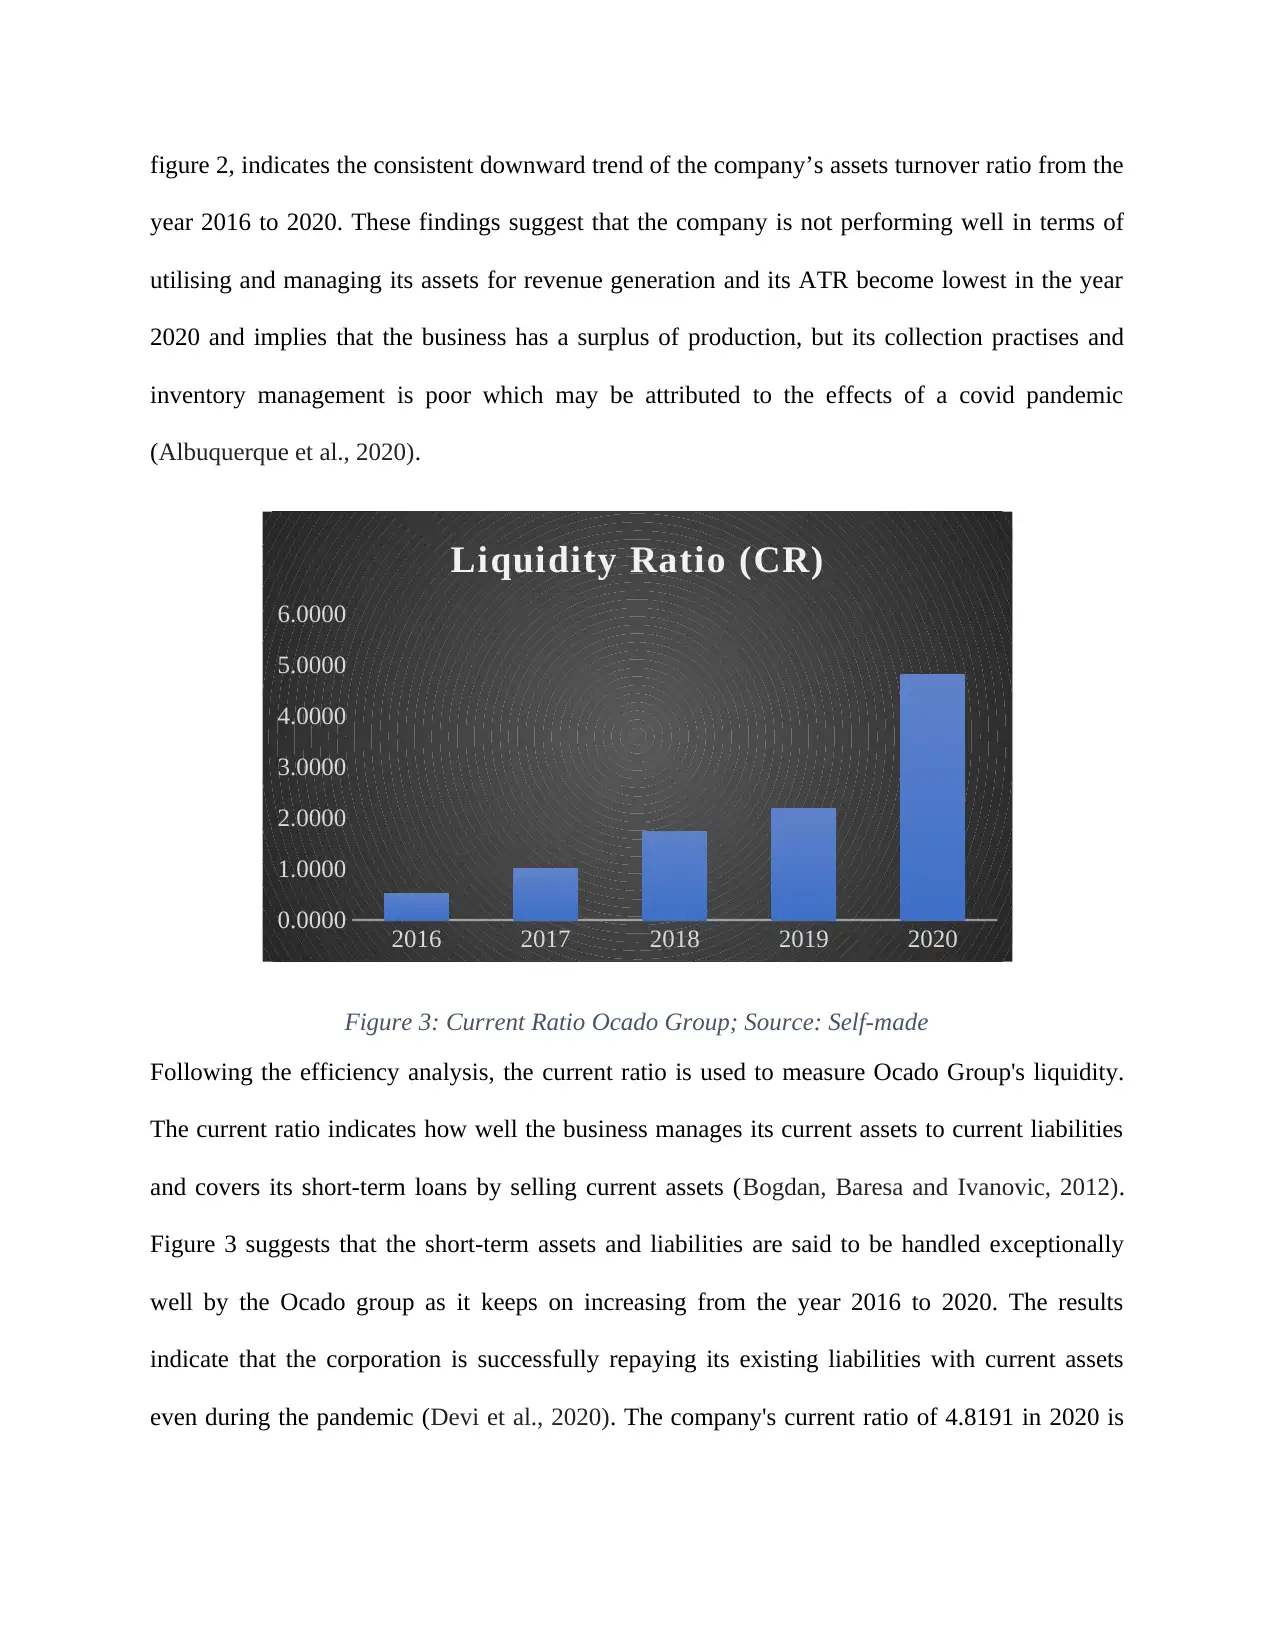
figure 2, indicates the consistent downward trend of the company’s assets turnover ratio from the
year 2016 to 2020. These findings suggest that the company is not performing well in terms of
utilising and managing its assets for revenue generation and its ATR become lowest in the year
2020 and implies that the business has a surplus of production, but its collection practises and
inventory management is poor which may be attributed to the effects of a covid pandemic
(Albuquerque et al., 2020).
2016 2017 2018 2019 2020
0.0000
1.0000
2.0000
3.0000
4.0000
5.0000
6.0000
Liquidity Ratio (CR)
Figure 3: Current Ratio Ocado Group; Source: Self-made
Following the efficiency analysis, the current ratio is used to measure Ocado Group's liquidity.
The current ratio indicates how well the business manages its current assets to current liabilities
and covers its short-term loans by selling current assets (Bogdan, Baresa and Ivanovic, 2012).
Figure 3 suggests that the short-term assets and liabilities are said to be handled exceptionally
well by the Ocado group as it keeps on increasing from the year 2016 to 2020. The results
indicate that the corporation is successfully repaying its existing liabilities with current assets
even during the pandemic (Devi et al., 2020). The company's current ratio of 4.8191 in 2020 is
Paraphrase This Document
Need a fresh take? Get an instant paraphrase of this document with our AI Paraphraser
the best in the last five years, up from 2.1925 the year before. Results reflect that covid-19 has
not affected the company’s liquidity.
2016 2017 2018 2019 2020
0.0000
0.1000
0.2000
0.3000
0.4000
0.5000
0.6000
0.7000
0.8000
Gearing Ratio (DR)
Figure 4: Debt Ratio Ocado Group; Source: Self-made
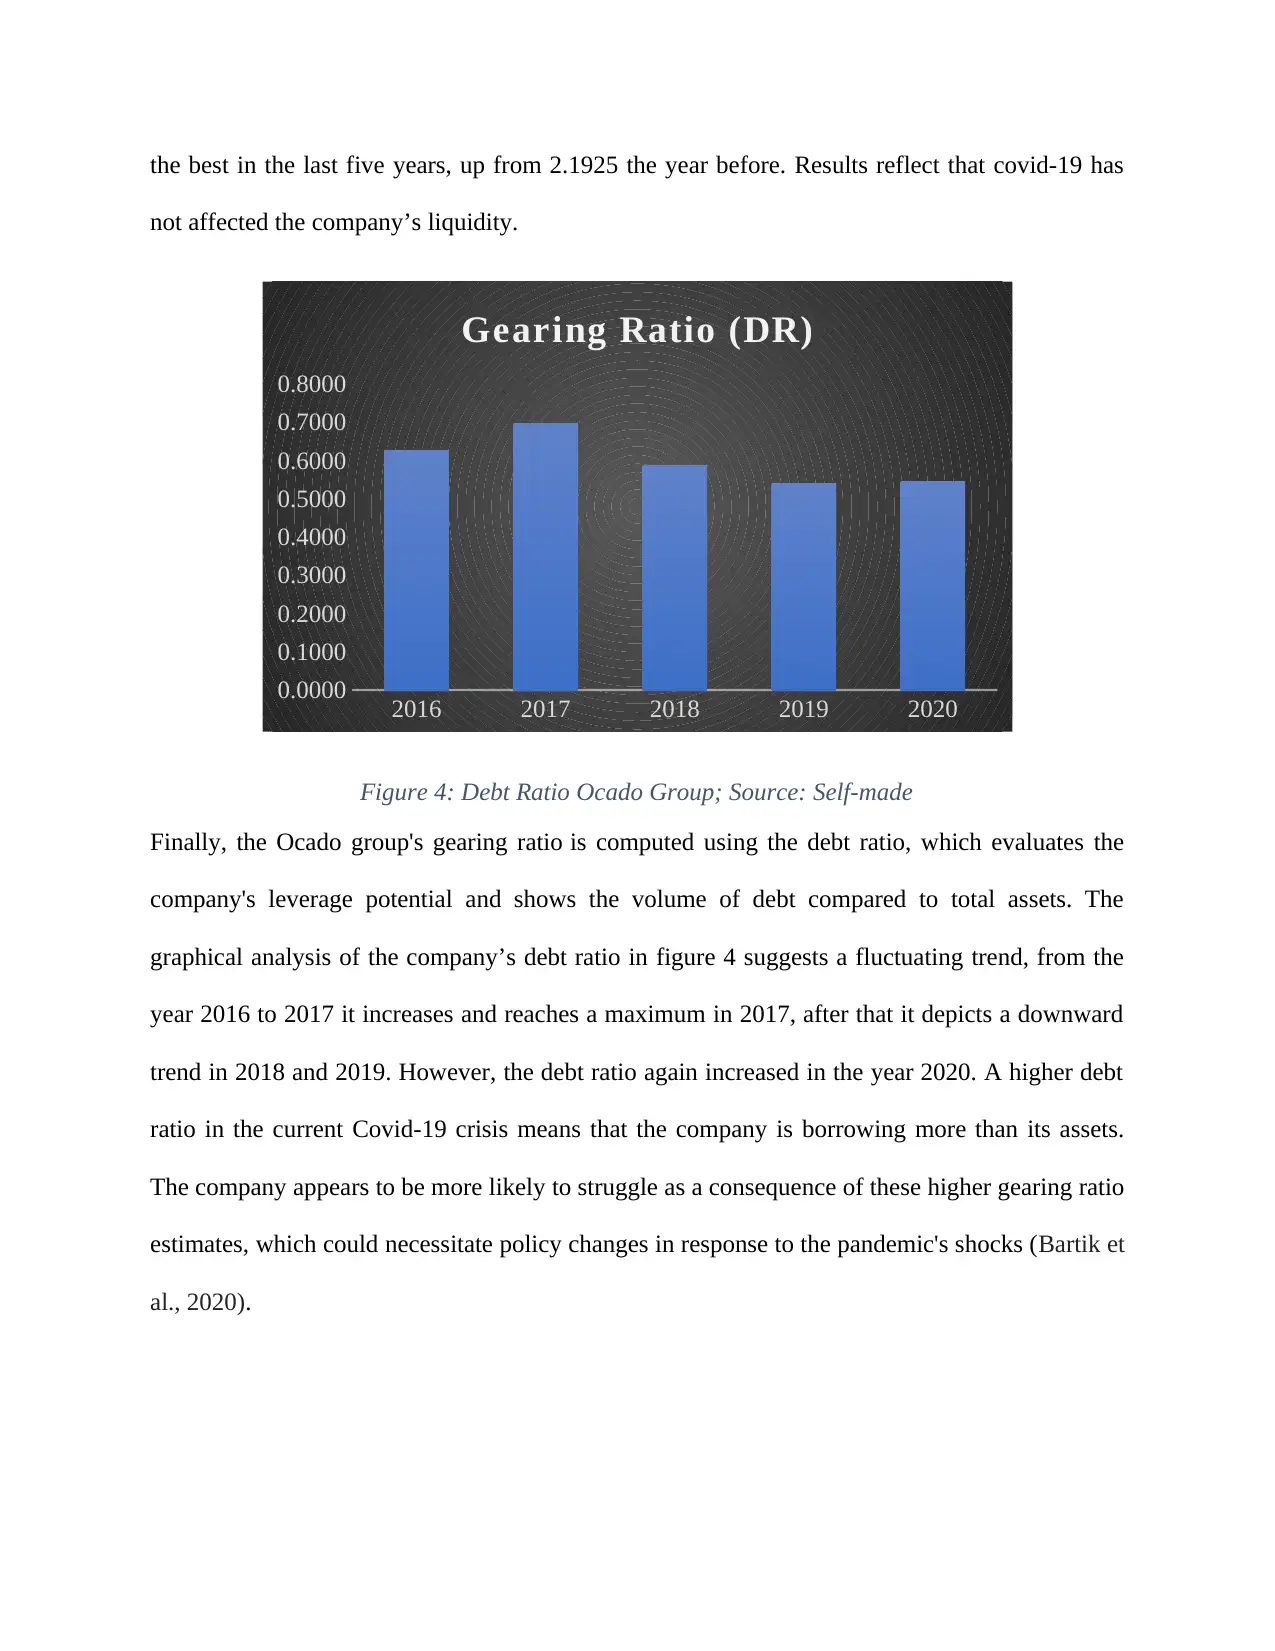
Finally, the Ocado group's gearing ratio is computed using the debt ratio, which evaluates the
company's leverage potential and shows the volume of debt compared to total assets. The
graphical analysis of the company’s debt ratio in figure 4 suggests a fluctuating trend, from the
year 2016 to 2017 it increases and reaches a maximum in 2017, after that it depicts a downward
trend in 2018 and 2019. However, the debt ratio again increased in the year 2020. A higher debt
ratio in the current Covid-19 crisis means that the company is borrowing more than its assets.
The company appears to be more likely to struggle as a consequence of these higher gearing ratio
estimates, which could necessitate policy changes in response to the pandemic's shocks (Bartik et
al., 2020).
not affected the company’s liquidity.
2016 2017 2018 2019 2020
0.0000
0.1000
0.2000
0.3000
0.4000
0.5000
0.6000
0.7000
0.8000
Gearing Ratio (DR)
Figure 4: Debt Ratio Ocado Group; Source: Self-made
Finally, the Ocado group's gearing ratio is computed using the debt ratio, which evaluates the
company's leverage potential and shows the volume of debt compared to total assets. The
graphical analysis of the company’s debt ratio in figure 4 suggests a fluctuating trend, from the
year 2016 to 2017 it increases and reaches a maximum in 2017, after that it depicts a downward
trend in 2018 and 2019. However, the debt ratio again increased in the year 2020. A higher debt
ratio in the current Covid-19 crisis means that the company is borrowing more than its assets.
The company appears to be more likely to struggle as a consequence of these higher gearing ratio
estimates, which could necessitate policy changes in response to the pandemic's shocks (Bartik et
al., 2020).
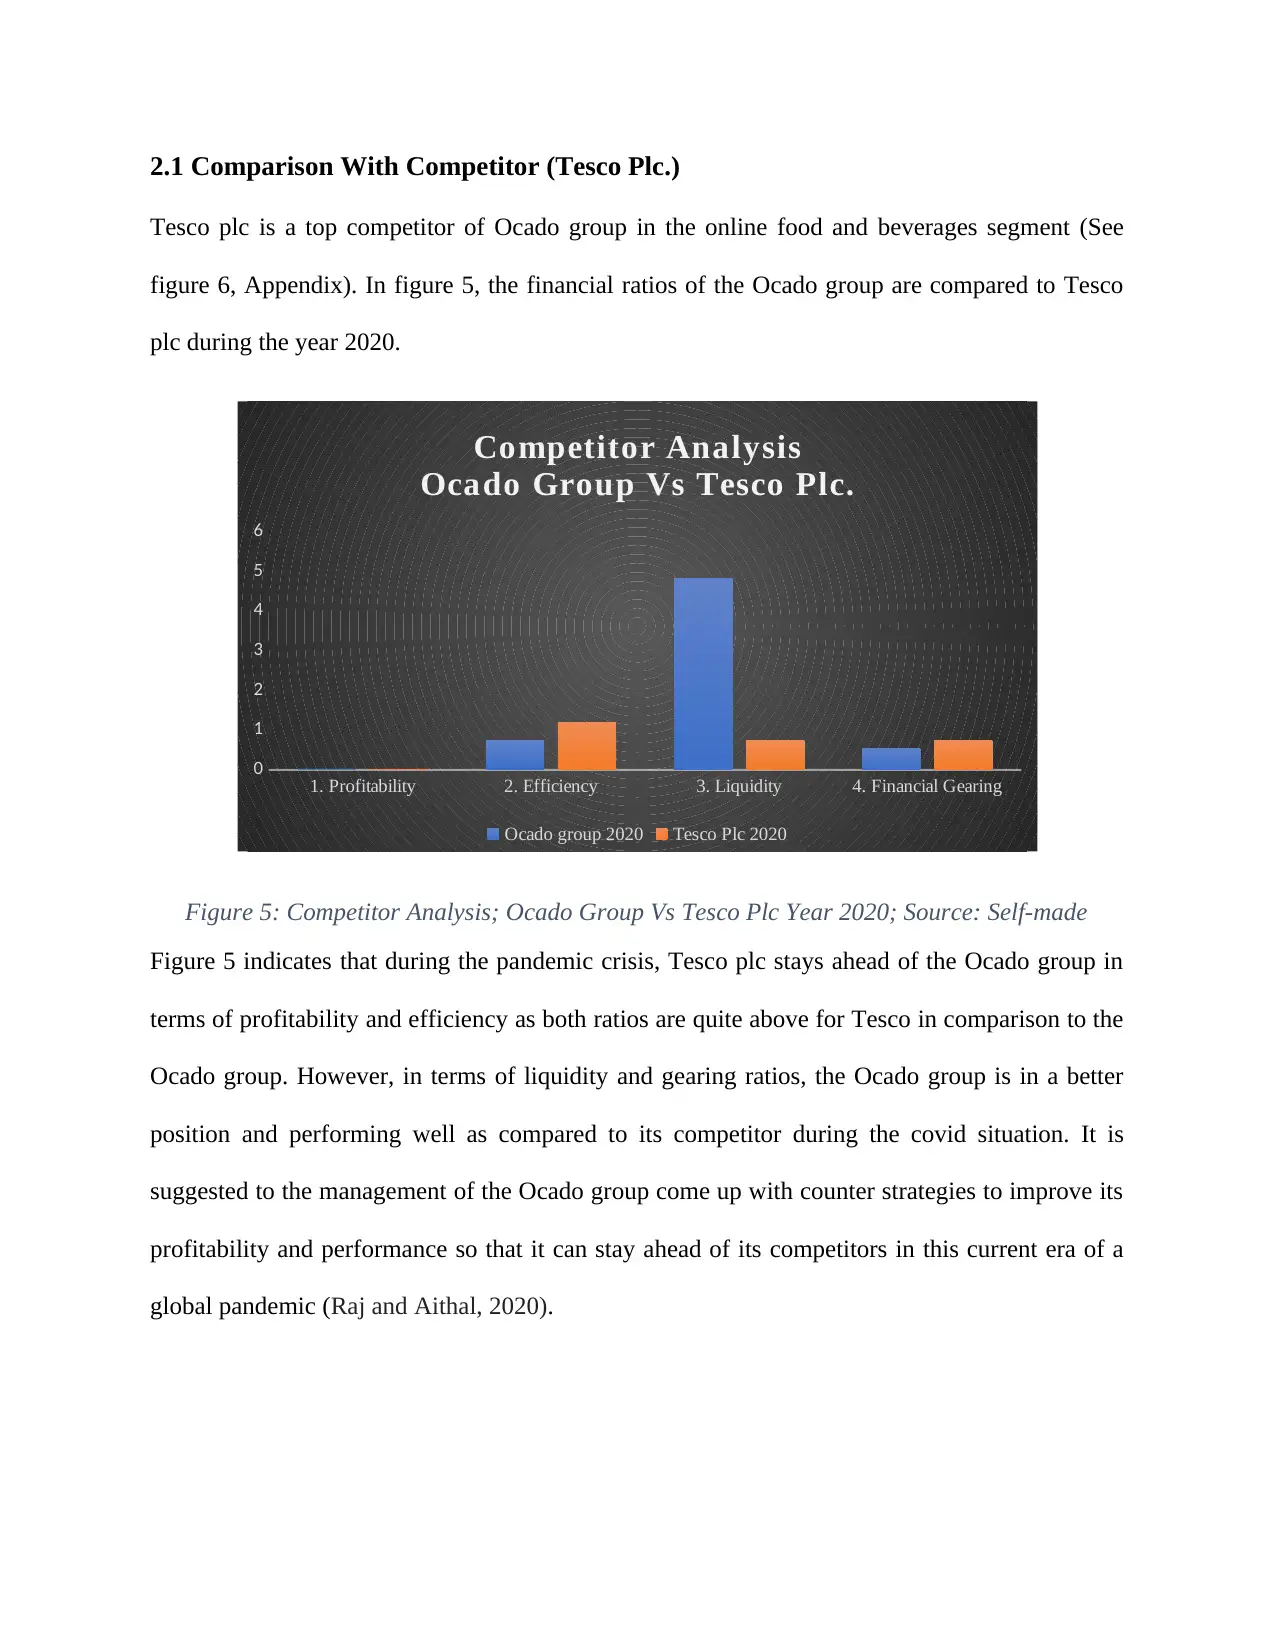
2.1 Comparison With Competitor (Tesco Plc.)
Tesco plc is a top competitor of Ocado group in the online food and beverages segment (See
figure 6, Appendix). In figure 5, the financial ratios of the Ocado group are compared to Tesco
plc during the year 2020.
1. Profitability 2. Efficiency 3. Liquidity 4. Financial Gearing
0
1
2
3
4
5
6
Competitor Analysis
Ocado Group Vs Tesco Plc.
Ocado group 2020 Tesco Plc 2020
Figure 5: Competitor Analysis; Ocado Group Vs Tesco Plc Year 2020; Source: Self-made
Figure 5 indicates that during the pandemic crisis, Tesco plc stays ahead of the Ocado group in
terms of profitability and efficiency as both ratios are quite above for Tesco in comparison to the
Ocado group. However, in terms of liquidity and gearing ratios, the Ocado group is in a better
position and performing well as compared to its competitor during the covid situation. It is
suggested to the management of the Ocado group come up with counter strategies to improve its
profitability and performance so that it can stay ahead of its competitors in this current era of a
global pandemic (Raj and Aithal, 2020).
⊘ This is a preview!⊘
Do you want full access?
Subscribe today to unlock all pages.
Trusted by 1+ million students worldwide
2.2 Ratio Analysis Limitations
By reviewing current outcomes against previous findings, ratio analysis is a valuable tool for
identifying and resolving issues with a company's financial performance. However, there are a
few disadvantages of ratio analysis to be aware of. For instance, according to Maliki (2020), the
majority of the income statement reporting is in actual (realised) costs, while the balance sheet
reporting might be in historical costs. This mismatch can result in abnormal ratios. Likewise, the
financial reports are released in a timely manner, but there is a time gap between them. True
prices are not reflected in accounting records if there has been inflation between periods
(Gadoiu, 2014). As a result, the statistics from different periods are incomparable unless inflation
is considered. Besides, one of the complications with financial ratios is that the data used to
calculate them is not recent; instead, the measurement includes historical data to assess a firm's
current performance and forecast future decisions as the operating dynamics of a company may
change to the extent that contrasting a ratio estimated several years ago to a ratio calculated
today would yield an inaccurate conclusion. Since financial ratios are derived using data from a
company's financial statements, which are issued by the company, there's a risk that executives
will manipulate information to disclose more favourable results than their actual performance.
As a result, financial ratio analysis does not adequately reflect the true nature of the firm
(Laitinen, 2020).
3. Uses and Drawbacks of Preparing Budgets
Budgeting is a valuable concept that outlines the initiatives that a company will require to
accomplish its financial and non-financial goals. It is an essential aspect of effective financial
planning. According to Heupel and Schmitz (2015), the smallest business will benefit from
Paraphrase This Document
Need a fresh take? Get an instant paraphrase of this document with our AI Paraphraser
developing a structured written plan for its continuing operations. However, there are some
advantages and disadvantages to taking into account. For instance, a well-structured plan
(budget) identifies the aspects of the company that generate revenue and those that utilise it,
requiring businesses to assess whether some parts of the business should be reduced while others
should be enlarged. Moreover, if the company fails to achieve its budgeted targets, Budgeting
helps companies in looking for ways to improve their financial and operating position. Further, it
involves resource distribution and reallocation, organising business processes around
departments, and putting development plans into practice. Budgeting also aids the company's
management in planning and encourages them to think in terms of the long term rather than the
short term (King, Clarkson and Wallace, 2010).
On the other hand, budgeting has some disadvantages. As per the study of Lidia (2014), the
formation of budgetary slack in budget planning, which is a deliberate attempt by companies to
increase expenditure amounts while reducing revenue estimates to obtain desirable budget
variances, is a weakness of budgeting. Besides, the most noticeable disadvantage of budgeting is
that it takes a long time to accomplish, particularly for badly managed corporations and those
who want to prepare participatory budgets. The process of preparing budgeting estimates results
in rigidity. For example, if a company plans budgeting estimates on a periodic basis and attempts
to focus solely on the strategy outlined in their budgets for the entire following year, the business
may neglect changing market conditions, which could be a problem (Pohribna and Yuvzhenko,
2018).
3.1 Financial Planning Approaches
Companies use a variety of budgeting methods to plan their budgets for the upcoming year, each
with its own set of advantages and disadvantages. It can be hard to create a budget and decide on
the best budgeting plan for the company's structure and needs. However, this report primarily
focuses on rolling budgeting and zero-based budgeting, as well as their benefits and drawbacks.
When preparing the budget for the next year, these budgets include either facts and figures or
forecasts from the previous year's budget.
According to Bhimani, Sivabalan and Soonawalla (2018), rolling budgeting is a rigorous
method of adding a new budget cycle once the existing one expires. It also has some benefits,
such as keeping companies up to date on all changes, risks, and opportunities due to a rolling
forecast that accounts for fine-tuning of the business strategy and strategic vision. Furthermore,
this approach makes scenario planning easier and, as a result, aids decision-making. The
downside of rolling budgeting is that instead of being done once a year, it is done monthly or
quarterly. However, the concept "zero-based budgeting" refers to the process of creating a budget
from the scratch. It assumes that there are no reserves to bring forward or pre-committed
expenditures. This aids in the productive distribution of resources since it looks at real numbers
rather than historical figures. Making a budget from the scratch will necessitate the participation
of a diverse workforce. Many units will be unable to do so due to a lack of time and human
resources (Ibrahim, 2019).
3.2 Role of Performance Management (PM) in Decision Making
PM is a strategic management process that allows organisations to maintain track of and analyse
their employees' performance. The management of the company will make informed decisions
with the help of performance management. According to Richards et al. (2019), it aims to
provide a framework in which employees can maximise their potential and deliver high-quality
tasks more effectively. The process of PM involves determining and orienting individual and
team objectives with long-term goals and strategies of organisations, preparing for performance
⊘ This is a preview!⊘
Do you want full access?
Subscribe today to unlock all pages.
Trusted by 1+ million students worldwide
1 out of 22
Related Documents


Your All-in-One AI-Powered Toolkit for Academic Success.
+13062052269
info@desklib.com
Available 24*7 on WhatsApp / Email
![[object Object]](/_next/static/media/star-bottom.7253800d.svg)
Unlock your academic potential
Copyright © 2020–2026 A2Z Services. All Rights Reserved. Developed and managed by ZUCOL.